Original
Evaluation of a Physical Activity Promotion Program Using the
Exercise Guide 2006 Aimed at Preventing Lifestyle-related Diseases
among Working People
Fuminari Asada1), Takuo Nomura2)
, Masashi Kubota1)
, Makoto Ohashi1)
and Kenichi Ito3) 1)Research Center for the Health Promotion and Employment Support, Osaka Rosai Hospital
2)Faculty of Allied Health Sciences, Kansai University of Welfare Sciences 3)Graduate School of Comprehensive Rehabilitation, Osaka Prefecture University
(Received: August 12, 2015)
Abstract Objectives:
This study aimed to evaluate the effects of a physical activity promotion program based on Exercise and Physical Activity Reference for Health Promotion 2006 (EPAR) by comparing it with general exercise guid-ance (GEG). Furthermore, we evaluated the efficacy of each program with only obese subjects.
Methods:
The subjects consisted of workers at a manufacturing company. They were randomized into three groups: the EPAR group, the GEG group and the control (CONT) group. The subjects, measurers, and investi-gators were all blinded. The measurements included biochemical parameters, body composition, knee exten-sion force (KEF), exercise self-efficacy (ESE), and stages of behavior change (SBC) in the transtheoretical model. The intervention was performed three times during a 6-month period.
Results:
Forty, 40, and 38 subjects were evaluable in the EPAR, the GEG and the CONT groups, respectively. The EPAR group demonstrated a significantly increased ESE and advanced SBC after the intervention period. The GEG group had a significantly increased body mass index (BMI) and ESE. The CONT group had a significantly increased BMI. In a sub-analysis of the obese subjects, the EPAR group had a significantly increased KEF and ESE, and a significantly advanced SBC, while only ESE increased in the GEG group. In a comparison of changes in each measurement between the groups, the improvement in KEF was significantly greater in the two intervention groups than in the CONT group, and the improvement in SBC was significantly greater in the EPAR than in the CONT group.
Conclusion:
The physical activity promoting program created according to the EPAR may increase exercise self-efficacy and contribute to prevention of lifestyle-related diseases.
(JJOMT, 64: 162―172, 2016)
―Key words―
Physical activity, Occupational health, Lifestyle-related diseases
Introduction
Preventing lifestyle-related diseases is a significant occupational health issue in Japan. The prevalence of obesity has been increasing in the working generation, along with concurrent increases in lifestyle-related dis-eases. In order to prevent the health problems associated with modern lifestyles, it is critical to balance the en-ergy intake from food and the enen-ergy expenditure through physical activity1)
. In the field of health promotion, more attention should be paid to exercise habits. Previous studies have demonstrated that exercise, such as
brisk walking, can reduce the risks for type 2 diabetes, stroke, coronary artery disease, and metabolic syn-drome2) 5)
. Furthermore, an increase in physical activity reportedly has a preventive effect against type 2 diabe-tes, coronary artery disease, hypertension, obesity, and other chronic disorders6) 9)
.
Based on such evidence, many countries are now implementing measures to increase physical activity on a population-wide basis. Comprehensive disease control programs, incorporating goal setting and the compre-hensive evaluation of such programs, are being implemented in the United States10)11)
and the United King-dom12)
. In Japan, the Ministry of Health, Labour and Welfare launched the National Health Promotion Move-ment in the 21st Century (Health Japan 21) campaign in 2000 and started to develop a health promotion plan with concrete numerical goals. In 2006, the organizing committee for Exercise and Physical Activity Reference for Japanese 2006 published the Exercise Guide 2006 with the aim of preventing lifestyle-related diseases13)
. The Exercise Guide 2006 was recommended as a guide in a Japanese preventive measure for lifestyle-related diseases started in 2008, which is known as the Health Checkup and Healthcare Advice with a Particular Fo-cus on Metabolic Syndrome. However, to the best of our knowledge, no studies have so far examined the ef-fects of physical activity promotion programs based on the Exercise Guide 2006.
In traditional exercise guidance for the prevention of lifestyle-related diseases, the strength, frequency, duration, daily schedule, and type of exercise are determined while carefully considering safety limits. Then, the participants are recommended to follow a prescribed exercise program. According to the Exercise Guide 2006, the goals are to be based on an assessment of the current quantity of physical activity including daily ac-tivities. Then, an individual program is planned considering the subject s exercise habits. Concurrently, in-creased energy expenditure from the program is thus estimated. This method is easier to carry out because daily activities are considered to be a part of overall physical activity. To date, no studies have examined the effects of this method in comparison to traditional exercise guidance.
The purpose of this study was to evaluate the two prevailing physical activity promotion programs which are designed to prevent lifestyle-related diseases for workers. The effect of each method was examined by comparing three groups: a general exercise guidance group (GEG group), a physical activity promotion pro-gram based on Exercise and Physical Activity Reference for Health Promotion 2006 group (EPAR group), and a control group (CONT group). A sub-analysis of the obese subjects was also performed to examine the effects of each program on obese individuals.
Methods 1.Subjects
The subjects were enrolled from among workers at a manufacturing company. The intervention period was between June 2008 and December 2008 (6 months). In total, 129 workers were recruited. All of the work-ers participated in the health checkup program administered by the general affairs division of the company. The exclusion criteria were as follows: (i) orthopedic disease or a past or present history of serious disease(s) re-stricting physical activity; (ii) Not allowed to participate in the program by their physician for medical reasons; (iii) refusal to give informed consent; (iv) a past or present history of neurosis or other psychiatric disease(s); and (v) pregnancy. The discontinuation criteria were as follows: (i) unable to continue exercise because of se-vere complication(s); (ii) unable to continue to participate in the study because of psychiatric problem(s); (iii) on overseas assignment; (iv) became pregnant; (v) withdrawal from the study; and (vi) retirement.
After excluding 7 workers who met the exclusion criteria, 122 workers were enrolled in the study (mean age±standard deviation [SD] of 39.0±9.4 years; 37 women and 85 men; mean body mass index [BMI]±SD of 22.9±4.3 kg/m2). The subjects were randomly assigned to the EPAR (n = 42), GEG (n = 41), or CONT (n = 39)
group by an independent investigator using a random number table generated by a computer. All subjects, measurers, and investigators were blinded to group assignments. During the intervention period, 4 subjects were excluded due to pregnancy (n = 2), psychiatric problems (n = 1), and retirement (n = 1), thus leaving 118 subjects for the final analysis (Fig. 1).
After the study period, the physical activity promotion program was offered to the CONT group in order to compensate for any disadvantages incurred. After a comprehensive explanation (in written and verbal
Fig. 1 Flow chart of this study
EPAR group: physical activity promotion program based on Exercise and Physical Activity Reference for Health Promo-tion 2006 group, GEG group: general exercise guidance group, CONT group: control group.
forms), written informed consent was obtained from all subjects. This study was approved by the ethics com-mittee of Osaka Rosai Hospital (approved on January 15, 2008).
2.Intervention program
2-1.Intervention aimed at increasing physical activity (EPAR group)
The current quantity of physical activity was assessed by interviewing each subject regarding physical fitness and daily activities to determine whether the quantity of physical activity met the minimum require-ment13)
for the prevention of lifestyle-related diseases. Each subject was asked to set their own goal for the quantity of physical activity, considering their exercise habits. Then, the subject was informed as to how much he or she could reduce fat by increasing physical activity for 6 months according to the individualized plan (e.g., if a person with a weight of 70 kg walks briskly for 15 minutes every day for a period of 6 months, the in-creased caloric expenditure would theoretically lead to a fat reduction of about 1.8 kg). This intervention pro-gram was considered to have been completed when the subject achieved his or her goal of reducing fat by in-creasing physical activity.
2-2.Conventional intervention focusing on aerobic exercise and muscle strengthening exercise (GEG group)
A feasible exercise plan was determined through discussions between the instructor and each subject based on the results of body composition measurements: muscle strengthening exercise was recommended for those with a low muscle mass, i.e., below the standard; aerobic exercise was recommended for those with a high fat mass, i.e., above the standard; muscle strengthening and aerobic exercise were recommended for those with a low muscle mass and a high fat mass; and general fitness training was recommended for those with normal muscle and fat masses.
2-3.Control group (CONT group)
Each subject was informed only of what type of exercise was needed based on the results of body compo-sition measurements.
2-4.Instructions given to both the EPAR and the GEG group
For both the EPAR and the GEG group, instructions were based on the transtheoretical model (TTM)14) 16) .
Goal setting was not always a part of the instructions. In principle, a physical activity promotion program through goal setting was provided for the subjects between the contemplation stage and the maintenance stage. Effective and feasible instructions were provided by a physical therapist while carefully considering the condition of each individual subject (e.g., bone and joint diseases such as osteoarthritis and lifestyle-related dis-eases).
2-5.Intervention period
The intervention time for each session (including assessment) was 15 minutes for each subject. Interven-tion was performed three times during a period of 6 months (once every 2 months) for both intervenInterven-tion groups.
3.Measurements and assessment
The measurement items included biochemical data, body composition, KEF, exercise self-efficacy (ESE)17) 19)
, and stages of behavior change (SBC) in the TTM. The biochemistry, body composition, KEF, ESE, and SBC measurements were performed at baseline and post-intervention/-observation.
A biochemical analysis was performed at a single laboratory according to the same method. The bio-chemical data included total cholesterol, triglyceride, high-density lipoprotein cholesterol, low-density lipopro-tein cholesterol, and fasting plasma glucose.
Body composition was measured using a body composition analyzer (InBody 720; Biospace Co., Inc., Seoul, Korea). The measurements included body weight, BMI, skeletal muscle mass (SMM), body fat mass, and body fat percentage. At the time of measurement, the room temperature was kept between 20 and 25℃ No physical exercise was allowed on the day of the determinations. The subjects were instructed to abstain from eating for 2 hours before the determinations. All measurements were made after urination.
KEF was measured using an isometric dynamometer (μTas F-01, Anima Co., Inc., Tokyo, Japan). For the muscle strength test, each subject was placed in a sitting position and instructed to maintain an upright trunk posture. During the measurements, a sensor pad was placed on the distal anterior surface of the lower leg and fixed with a restraint strap. Isometric KEF was measured twice for each leg with a 90-degree knee flexion an-gle. In each trial, the subjects were asked to maintain their maximum effort for about 5 seconds. The average of the best scores achieved by each leg was used in the analysis. In addition, the muscle strength to body weight ratio was calculated by dividing the measured muscle strength by body weight (lower muscle strength/body weight: kgf/kg) and it was expressed as a percentage.
ESE was measured using a modified version of the ESE developed by Oka et al.20)
with further modifica-tions. The subjects were asked whether they were able to continue exercising when they were (i) slightly tired, (ii) not in a good mood, (iii) busy, (iv) had bad weather, (v) were alone. The responses were assessed on a 5-point scoring scale: no confidence at all (0 5-point), not enough confidence (1 5-point), uncertain (2 5-points), a little confidence (3 points), and enough confidence (4 points). The total scores ranged from 0 to 20. The assessment of ESE was performed at baseline and post-intervention/-observation by an independent investigator not in-volved in either giving the instructions or performing the analyses.
Exercise habits were evaluated based on the five stages of TTM using a questionnaire. Regular exercise habits were defined as a scheduled exercise regimen that was performed for at least 1 hour per week (daily ac-tivities such as commuting and chores are not regarded as regular exercise). The stages of behavior change (SBC) in the TTM classified according to the theory of Prochaska, as follows: pre-contemplation stage (1 point), contemplation stage (2 points), preparation stage (3 points), action stage (4 points), and maintenance stage (5 points).
4.Statistical analysis
In the statistical analysis, the one-way ANOVA and the Scheffe s multiple comparison test were used to compare the baseline data and changes in the variables including biochemical data, body composition, KEF, ESE, and SBC among the three groups. The comparison of changes baseline and post-intervention/-observation for each group was evaluated using the paired Student st-test for parametric data (biochemical data, body composition, and KEF) and the Wilcoxon signed rank sum test for non-parametric data (ESE and SBC). In addition, the same analyses were performed for the subgroups with obesity (BMI of 25 kg/m2 or
Table 1 Characteristics of the subjects at baseline
Items Units EPAR group GEG group CONT group P value
mean SD mean SD mean SD
Age (year) 38.7±9.7 40.1±9.4 38.7±9.5 n.s. BW (kg) 65.7±15.6 65.5±13.5 62.1±13.2 n.s. BMI (kg/m2) 23.3±4.3 23.4±4.7 22.4±4.0 n.s. TC (mg/dL) 194.1±31.6 191.9±30.4 199.2±33.5 n.s. TG (mg/dL) 94.1±65.3 96.9±73.8 104.6±74.5 n.s. HDL-C (mg/dL) 61.7±13.4 63.4±13.9 64.2±16.9 n.s. LDL-C (mg/dL) 117.1±28.5 111.7±30.3 115.9±32.4 n.s. FPG (mg/dL) 92.2±8.6 94.6±11.4 94.3±13.1 n.s. SMM (kg) 27.1±5.5 27.0±5.6 26.0±5.5 n.s. BFM (kg) 16.8±9.4 16.8±8.8 15.0±6.9 n.s. BFP (%) 24.3±8.8 24.8±9.1 23.6±7.2 n.s. KEF (%) 60.9±17.7 61.1±14.7 68.4±16.9 n.s. ESE (score) 10.6±4.1 11.5±4.7 9.3±4.5 n.s. SBC (score) 2.6±1.5 3.2±1.5 2.7±1.5 n.s.
EPAR group: physical activity promotion program based on Exercise and Physical Activity Reference for Health Promotion 2006 group (n=40), GEG group: general exercise guidance group (n=40), CONT group: control group (n=38), SD: standard deviation, n.s.: not signifi-cant, BW: body weight, BMI: body mass index,TC: total cholesterol,TG: triglyceride, HDL-C: high density lipoprotein-cholesterol, LDL-HDL-C: low density lipoprotein-cholesterol, FPG: fast-ing plasma glucose, SMM: skeletal muscle mass, BFM: body fat mass, BFP: body fat percentage, KEF: knee extension force, ESE: exercise self-efficacy, SBC: stages of behavior change in the transtheoretical model. P value: a result by the one-way ANOVA.
more). Statistical analyses were performed using the Dr. SPSS II software program for Windows (SPSS Inc.). Statistical significance was set at p < 0.05.
Results 1.Comparisons among the three groups
There were no significant differences in any of the baseline measurements among the three groups (Table 1). With regard to body composition, body weight, BMI, body fat mass, and body fat percentage significantly in-creased after intervention in the GEG and the CONT groups. In the EPAR group, body weight and BMI were unchanged and SMM decreased, while the body fat mass and body fat percentage both significantly increased (Table 2).
Changes in the measurement results after intervention for each group are shown in Table 3. Although the muscle strength increased after intervention in all three groups, the amounts of such increases were signifi-cantly larger in the two intervention groups than in the CONT group. ESE increased in both intervention groups. ESE after intervention was significantly higher in the GEG than in the CONT group. In addition, the amount of the increase in ESE was also significantly larger in the GEG group than in the CONT group. SBC ad-vanced after intervention in both groups receiving intervention, with the amount of the increase being signifi-cantly larger in the EPAR group than in the CONT group.
2.Comparisons among the three subgroups of obese subjects
The measurement results for each subgroup of obese subjects on baseline and post-intervention/-observation are shown in Table 4. Unlike the results from the comparisons among the three groups including individuals with and without obesity, body weight, BMI, body fat mass, body fat percentage, and visceral fat area significantly increased only in the CONT subgroup, while no significant changes were observed in either of the intervention subgroups. KEF significantly increased only in the EPAR subgroup of obese subjects. ESE significantly increased in both intervention subgroups of obese subjects. SBC significantly advanced only in the EPAR subgroup. The TG decrease was significantly larger in the GEG subgroup than in the CONT sub-group. The ESE increase was significantly larger in the EPAR subgroup than in the CONT subgroup of obese subjects (Table 5).
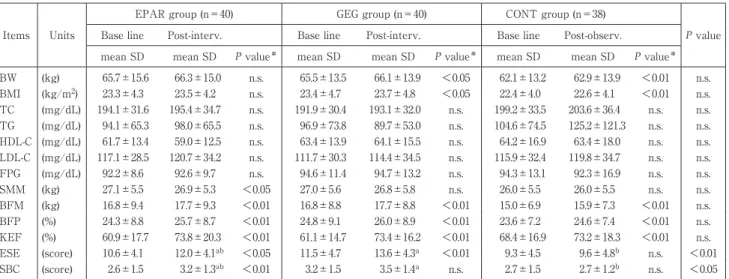
Table 2 Change in the parameters during study period
Items Units
EPAR group (n=40) GEG group (n=40) CONT group (n=38)
P value
Base line Post-interv. Base line Post-interv. Base line Post-observ.
mean SD mean SD P value* mean SD mean SD P value* mean SD mean SD P value*
BW (kg) 65.7±15.6 66.3±15.0 n.s. 65.5±13.5 66.1±13.9 <0.05 62.1±13.2 62.9±13.9 <0.01 n.s. BMI (kg/m2) 23.3±4.3 23.5±4.2 n.s. 23.4±4.7 23.7±4.8 <0.05 22.4±4.0 22.6±4.1 <0.01 n.s. TC (mg/dL) 194.1±31.6 195.4±34.7 n.s. 191.9±30.4 193.1±32.0 n.s. 199.2±33.5 203.6±36.4 n.s. n.s. TG (mg/dL) 94.1±65.3 98.0±65.5 n.s. 96.9±73.8 89.7±53.0 n.s. 104.6±74.5 125.2±121.3 n.s. n.s. HDL-C (mg/dL) 61.7±13.4 59.0±12.5 n.s. 63.4±13.9 64.1±15.5 n.s. 64.2±16.9 63.4±18.0 n.s. n.s. LDL-C (mg/dL) 117.1±28.5 120.7±34.2 n.s. 111.7±30.3 114.4±34.5 n.s. 115.9±32.4 119.8±34.7 n.s. n.s. FPG (mg/dL) 92.2±8.6 92.6±9.7 n.s. 94.6±11.4 94.7±13.2 n.s. 94.3±13.1 92.3±16.9 n.s. n.s. SMM (kg) 27.1±5.5 26.9±5.3 <0.05 27.0±5.6 26.8±5.8 n.s. 26.0±5.5 26.0±5.5 n.s. n.s. BFM (kg) 16.8±9.4 17.7±9.3 <0.01 16.8±8.8 17.7±8.8 <0.01 15.0±6.9 15.9±7.3 <0.01 n.s. BFP (%) 24.3±8.8 25.7±8.7 <0.01 24.8±9.1 26.0±8.9 <0.01 23.6±7.2 24.6±7.4 <0.01 n.s. KEF (%) 60.9±17.7 73.8±20.3 <0.01 61.1±14.7 73.4±16.2 <0.01 68.4±16.9 73.2±18.3 <0.01 n.s. ESE (score) 10.6±4.1 12.0±4.1ab <0.05 11.5±4.7 13.6±4.3a <0.01 9.3±4.5 9.6±4.8b n.s. <0.01 SBC (score) 2.6±1.5 3.2±1.3ab <0.01 3.2±1.5 3.5±1.4a n.s. 2.7±1.5 2.7±1.2b n.s. <0.05
EPAR group: physical activity promotion program based on Exercise and Physical Activity Reference for Health Promotion 2006 group, GEG group: general exercise guidance group, CONT group: control group, SD: standard deviation, n.s.: not significant, BW: body weight, BMI: body mass index,TC: total cholesterol,TG: triglyceride, HDL-C: high density lipoprotein-cholesterol, LDL-C: low density lipoprotein-cholesterol, FPG: fasting plasma glucose, SMM: skeletal muscle mass, BFM: body fat mass, BFP: body fat percentage, KEF: knee extension force, ESE: exercise self-efficacy, SBC: stages of behavior change in the transtheoretical model. P value*: a result by the paired Student s t-test or the Wilcoxon signed rank sum test.
P value: a result by the one-way ANOVA. Results by Scheffe s multiple comparison test showed “a” and/or “b”: when there is the same symbol, there is no significance difference, and when there is a different symbol, there is a significance difference.
Table 3 Comparison of the change rate during the study period among the three groups
Items Units
EPAR group
(n=40) GEG group (n=40) CONT group (n=38) P value
mean SD mean SD mean SD
BW (kg) 0.54±2.46 0.60±1.57 0.77±1.65 n.s. BMI (kg/m2) 0.21±0.82 0.22±0.57 0.26±0.58 n.s. TC (mg/dL) 1.33±21.08 1.25±20.23 4.47±20.70 n.s. TG (mg/dL) 3.83±63.31 −7.18±52.95 20.66±101.72 n.s. HDL-C (mg/dL) −2.65±9.64 0.70±7.54 −0.82±7.26 n.s. LDL-C (mg/dL) 3.58±19.11 2.65±21.05 3.87±19.43 n.s. FPG (mg/dL) 0.45±9.41 0.10±7.74 −1.97±13.94 n.s. SMM (kg) −0.21±0.64 −0.12±0.58 −0.05±0.59 n.s. BFM (kg) 0.95±1.95 0.90±1.24 0.89±1.35 n.s. BFP (%) 1.32±1.97 1.17±1.55 1.00±1.73 n.s. KEF (%) 12.95±12.26a 12.38±12.38a 4.78±10.74b <0.01 ESE (score) 1.38±4.00ab 2.13±2.72a 0.29±2.45b <0.05 SBC (score) 0.60±0.81a 0.28±1.04ab −0.05±1.41b <0.05
EPAR group: physical activity promotion program based on Exercise and Physical Activity Refer-ence for Health Promotion 2006 group (n=40), GEG group: general exercise guidance group (n=40), CONT group: control group (n=38), SD: standard deviation, n.s.: not significant, BW: body weight, BMI: body mass index,TC: total cholesterol,TG: triglyceride, HDL-C: high density lipoprotein-cho-lesterol, LDL-C: low density lipoprotein-cholipoprotein-cho-lesterol, FPG: fasting plasma glucose, SMM: skeletal mus-cle mass, BFM: body fat mass, BFP: body fat percentage, KEF: knee extension force, ESE: exercise self-efficacy, SBC: stages of behavior change in the transtheoretical model. P value: a result by the one-way ANOVA. Results by Scheffe s multiple comparison test showed “a” and/or “b”: when there is the same symbol, there is no significance difference, and when there is a different symbol, there is a significance difference.
Discussion
Previous studies have found that health promotion programs such as Tai Chi21)
, health education22)
, and ex-ercise prescription23)
can improve efficacy. According to Bandura, there are four major sources of self-efficacy17) 19)
Table 4 Change in the parameters during the study period in obese subjects
Items Units
EPAR group (n=10) GEG group (n=11) CONT group (n=9)
P value
Base line Post-interv. Base line Post-interv. Base line Post-observ.
mean SD mean SD P value* mean SD mean SD P value* mean SD mean SD P value*
BW (kg) 84.9±14.9 84.1±13.8 n.s. 81.2±7.1 81.8±8.1 n.s. 77.9±10.1 79.4±10.9 <0.05 n.s. BMI (kg/m2) 29.2±3.7 29.0±4.0 n.s. 29.2±4.3 29.4±4.7 n.s. 27.7±3.3 28.2±3.5 <0.05 n.s. TC (mg/dL) 218.8±29.1 220.1±32.3 n.s. 209.9±35.0 209.2±39.6 n.s. 204.2±40.9 206.2±46.5 n.s. n.s. TG (mg/dL) 138.1±83.5 128.9±58.4ab n.s. 166.5±106.4 114.0±74.3a n.s. 134.7±93.9 249.1±191.8b n.s. <0.05 HDL-C (mg/dL) 54.0±12.5 49.4±5.3 n.s. 56.5±13.8 57.2±12.3 n.s. 54.8±9.3 52.1±8.8 n.s. n.s. LDL-C (mg/dL) 142.0±22.4 151.0±28.3 n.s. 125.6±40.7 134.5±44.1 n.s. 122.6±37.8 117.3±33.2 n.s. n.s. FPG (mg/dL) 94.6±7.8 91.7±6.9 n.s. 94.8±9.9 95.3±8.5 n.s. 100.6±12.5 101.4±12.5 n.s. n.s. SMM (kg) 31.3±6.3 30.7±5.9 n.s. 30.5±4.3 30.5±4.2 n.s. 30.9±4.8 30.8±5.0 n.s. n.s. BFM (kg) 29.0±9.5 29.1±10.0 n.s. 26.6±9.7 27.3±10.0 n.s. 22.6±8.3 24.5±7.7 <0.01 n.s. BFP (%) 33.8±8.5 34.3±9.1 n.s. 32.4±9.3 32.9±9.3 n.s. 28.8±7.8 30.7±6.8 <0.01 n.s. KEF (%) 60.7±16.8 66.7±18.3 <0.05 58.0±17.2 67.9±16.7 n.s. 65.3±14.5 70.7±12.4 n.s. n.s. ESE (score) 9.2±4.3 13.1±3.3 <0.01 11.4±5.4 15.0±3.1 <0.01 11.4±3.2 12.0±3.0 n.s. n.s. SBC (score) 3.0±1.8 3.8±1.1 <0.05 3.4±1.4 3.5±1.5 n.s. 2.9±1.4 3.2±0.7 n.s. n.s.
EPAR group: physical activity promotion program based on Exercise and Physical Activity Reference for Health Promotion 2006 group, GEG group: general exercise guidance group, CONT group: control group, SD: standard deviation, n.s.: not significant, BW: body weight, BMI: body mass index,TC: total cholesterol,TG: triglyceride, HDL-C: high density lipoprotein-cholesterol, LDL-C: low density lipoprotein-cholesterol, FPG: fasting plasma glucose, SMM: skeletal muscle mass, BFM: body fat mass, BFP: body fat percentage, KEF: knee extension force, ESE: exercise self-efficacy, SBC: stages of behavior change in the transtheoretical model. P value*: a result by the paired Student s t-test or the Wilcoxon signed rank sum test.
P value: a result by the one-way ANOVA. Results by Scheffe s multiple comparison test showed “a” and/or “b”: when there is the same symbol, there is no significance difference, and when there is a different symbol, there is a significance difference.
Table 5 Comparison of the change rate during the study period among the three
groups in obese subjects
Items Units EPAR group (n=10) GEG group (n=11) CONT group (n=9) P value
mean SD mean SD mean SD
BW (kg) −0.78±4.02 0.57±1.81 1.52±1.76 n.s. BMI (kg/m2) −0.19±1.32 0.22±0.65 0.52±0.60 n.s. TC (mg/dL) 1.30±24.73 −0.73±24.18 2.00±20.02 n.s. TG (mg/dL) −9.20±70.73ab −52.55±78.36a 114.44±163.14b <0.01 HDL-C (mg/dL) −4.60±8.85 0.73±8.25 −2.67±8.80 n.s. LDL-C (mg/dL) 9.00±27.77 8.90±31.62 −5.22±19.16 n.s. FPG (mg/dL) −2.90±8.95 0.46±5.79 0.89±5.80 n.s. SMM (kg) −0.58±0.83 0.01±0.75 −0.14±0.68 n.s. BFM (kg) 0.19±3.00 0.67±1.17 1.84±1.25 n.s. BFP (%) 0.48±1.90 0.48±1.11 1.91±1.38 n.s. KEF (%) 6.08±7.83 9.88±15.44 5.39±8.29 n.s. ESE (score) 3.90±3.35a 3.63±3.01ab 0.56±1.51b <0.05 SBC (score) 0.80±0.92 0.09±0.83 0.33±1.73 n.s.
EPAR group: physical activity promotion program based on Exercise and Physical Activity Ref-erence for Health Promotion 2006 group (n=40), GEG group: general exercise guidance group (n =40), CONT group: control group (n=38), SD: standard deviation, n.s.: not significant, BW: body weight, BMI: body mass index,TC: total cholesterol,TG: triglyceride, HDL-C: high density lipo-protein-cholesterol, LDL-C: low density lipolipo-protein-cholesterol, FPG: fasting plasma glucose, SMM: skeletal muscle mass, BFM: body fat mass, BFP: body fat percentage, KEF: knee extension force, ESE: exercise self-efficacy, SBC: stages of behavior change in the transtheoretical model. P value:
a result by the one-way ANOVA. Results by Scheffe s multiple comparison test showed “a” and/ or “b”: when there is the same symbol, there is no significance difference, and when there is a different symbol, there is a significance difference.
important role in improving self-efficacy in the present intervention. In particular, helping the subjects recog-nize daily activities as a part of overall physical activity was considered to be effective for improving ESE be-cause this facilitated implementation of the program. In addition, we consider helping the subjects to under-stand the benefits of increased physical activity, in terms of the amount of fat reduction, to also be effective.
Although changing health-related behavior is a difficult task for adults24)
to make sustainable health related behavioral changes. Generally, exercise habits are developed as a result of a successful experience with exercising based on one s own initiative. The present intervention consisted of in-structions (without training), but the effects were not sufficient to have an impact on the biochemical data. We consider the lack of improvement in the biochemical data to possibly be partly attributable to the fact that most of the subjects in the present study were healthy individuals. Previous studies have indicated instruction alone to not be sufficient to improve biochemical data, and many effective programs consisted of both exercise instruction and nutritional guidance25)
. Coakley et al. reported that increasing physical activity by one and half hours per week for a period of 4 years led to a weight reduction of 0.2 kg26)
. According to the report of Ching et al.27)
, increasing physical activity by 10 metabolic equivalents per week for a period of 2 years leads to a BMI re-duction of 0.30 kg/m2. We therefore consider instruction alone to be insufficient for achieving a substantial
change in the health-related behaviors of healthy individuals.
With regard to body composition changes, slight, but steady, increases in body fat mass and obesity were observed in all three groups. These results suggest that the intervention consisting of instruction alone may generally be ineffective for preventing increases in weight and body fat mass. Matthews et al. reported that the amount of physical activity varies seasonally; that is, activity increases in summer and decreases in win-ter28)
. A similar analysis was reported by Uitenbroek29)
. Considering that the post-intervention measurements in the present study were conducted in winter, the amounts of physical activity of the subjects may thus have been affected by the season. However, in the sub-analysis of obese subjects, the interventions were found to be effective for preventing changes in body composition not only in the GEG group (traditional intervention for lifestyle-related diseases), but also in the EPAR group. These results show that an occupational health promo-tion program consisting of instrucpromo-tion alone, while being effective for individuals with obesity, would not be very useful for preventing deleterious changes in body composition in the general population.
The benefits of muscle-strengthening in lifestyle-related disease prevention include increases in insulin sensitivity and glucose transporter 4 protein due to increased muscle mass, a preventive effect against the pro-gression of sarcopenia, and an increase in basal metabolism30)
. In the present study, there was no significant in-crease in SMM, while there were significant inin-creases in muscle strength in the EPAR and GEG groups. Mus-cle strength depends on both morphological (muscular hypertrophy) and neural factors (maximal voluntary ac-tivation level)31)
; hence, neuroadaptation occurs relatively easily32)
. The increase of KEF in the EPAR group without the increase of SMM can be explained by neural factors. The results suggest that intervention based on EPAR can increase muscle strength, even though this intervention is aimed at increasing the amount of physical activity, including daily activities.
Estabrooks et al. conducted a group intervention program (once per week for 3 months) in elderly sub-jects and reported increases in both self-efficacy and the amount of physical activity33)
. Kelley et al. reported that ESE improved by health education provided by physicians34)
. Pinto et al. also reported that ESE improved by exercise prescription based on the behavior change theory35)
. Many studies have demonstrated exercise programs to be effective for improving ESE21)36)37)
. The results of this study demonstrate that the program con-sisting of instructions alone can improve or maintain ESE. In our view, as suggested by previous studies21)35)
, the intervention will be more effective if fitness facilities are used or the duration and/or frequency of intervention can be increased. We herein applied a feasible and acceptable intervention method in order to avoid interfering with the subjects work schedules. Despite this limitation, the present study demonstrated this intervention program to be effective for improving the confidence of the subjects engaged in exercise. We anticipate that such improved confidence might well change subsequent health-related behaviors. This assumption is sup-ported by the evidence that an improvement in ESE leads to an improvement in SBC, and that ESE and SBC are correlated20)
. However, given that health-related behaviors tend to be transient, continuous intervention is necessary.
Significant improvement in SBC was observed in the EPAR group. We consider this to have been attribut-able to the way in which the subjects were attribut-able engage in a wide range of physical activities (including daily activities) for achieving the established goals. Previous studies have shown improvements of SBC with various forms of intervention, including printed media according to SBC38)
, counseling25)
, conveying message39)
coun-seling by a physician40)
. We observed an improvement in SBC only in the EPAR group, thus suggesting the physical activity promotion program based on the Exercise Guide 2006 to be useful for improving the health-related behavior as a means of achieving lifestyle-health-related disease prevention. In general, workers are too busy to implement a program that is time consuming. We therefore consider it to be important to increase physical activity (including daily activities) instead of merely recommending exercise.
Limitations
This study is associated with some limitations. First, we did not perform nutritional assessments and were unable to fully analyze the effects of the intervention on the biochemical and body composition data. Second, we used a questionnaire as a subjective measurement tool and thus could not clarify whether the subjects ac-tually put the instructions into practice. Finally, it is unknown how much the interventional program contrib-uted to the promotion of physical activities, this study did not verify changes in physical activity (the amount of exercise) before and after intervention. Therefore, further verification is necessary.
Summary
The present study evaluated the effects of physical activity promotion programs on the prevention of lifestyle-related diseases in working people. We compared two intervention groups (conventional intervention for lifestyle-related disease prevention and novel intervention based on the Exercise Guide 2006) and a control group. The results showed interventions consisting of instructions alone to not be sufficiently effective for im-proving biochemical data. With regard to body composition, it was found to be difficult to prevent increases in body weight and body fat mass. However, in a sub-analysis of the obese subjects, both interventions were ef-fective for preventing undesirable body composition changes. In addition, muscle strength improved through the instructions provided by a physical therapist. These results indicate that both interventions improved the confidence of subjects in performing exercises and other physical activities. In particular, the physical activity promotion program based on the Exercise Guide 2006 was effective for promoting physical activity. We be-lieve that an education that emphasizes physical activity is necessary to increase worker self-efficacy for exer-cise and to prevent lifestyle-related diseases.
References
1) Institute of Medicine of the National Academies: Dietary Reference Intakes for Energy, Carbohydrate, Fiber, Fat, Fatty Ac-ids, Cholesterol, Protein, and Amino Acids. The National Academies Press, 2005, pp 38―52.
2) Hu FB, Sigal RJ, Rich-Edwards JW, et al: Walking compared with vigorous physical activity and risk of type 2 diabetes in women: a prospective study. JAMA 282: 1433―1439, 1999.
3) Hu FB, Stampfer MJ, Colditz GA, et al: Physical activity and risk of stroke in women. JAMA 283: 2961―2967, 2000.
4) Manson JE, Hu FB, Rich-Edwards JW, et al: A Prospective study of walking as compared with vigorous exercise in the pre-vention of coronary heart disease in women. N Engl J Med 341: 650―658, 1999.
5) Johnson JL, Slentz CA, Houmard JA, et al: Exercise Training Amount and Intensity Effects on Metabolic Syndrome (from Studies of a Targeted Risk Reduction Intervention through Defined Exercise). Am J Cardiol 100: 1759―1766, 2007.
6) Jeon CY, Lokken RP, Hu FB, et al: Physical Activity of moderate intensity and Risk of Type 2 Diabetes: a systematic review. Diabetes Care 30: 744―752, 2007.
7) Bassuk SS, Manson JE: Epidemiological evidence for the role of physical activity in reducing risk of type 2 diabetes and car-diovascular disease. J Appl Physiol 99: 1193―1204, 2005.
8) Church TS, Earnest CP, Skinner JS, et al: Effects of Different Doses of Physical Activity on Cardiorespiratory Fitness Among Sedentary, Overweight or Obese Postmenopausal Women With Elevated Blood Pressure A Randomized Controlled Trial. JAMA 19: 2081―2091, 2007.
9) Van Sluijs EM, McMinn AM, Griffin SJ: Effectiveness of interventions to promote physical activity in children and adoles-cents. systematic review of controlled trials. Br J Sports Med 42: 653―657, 2008.
10) Office of Disease Prevention and Health Promotion: Healthy People 2020. http://www.healthypeople.gov/2010/ (2015-08-11). 11) Office of Disease Prevention and Health Promotion: Healthy People 2020. http://www.healthypeople.gov/ (2015-08-11). 12) Department of Health of GOV. UK: UK physical activity guidelines. https://www.gov.uk/government/publications/uk-physi
cal-activity-guidelines (2015-08-11).
w0.nih.go.jp/eiken/programs/pdf/exercise_guide.pdf (2015-08-11).
14) Sarkin JA, Johnson SS, Prochaska JO, et al: Applying the transtheoretical model to regular moderate exercise in an over-weight population: validation of a stages of change measure. Prev Med 33: 462―469, 2001.
15) Prochaska JO, Butterworth S, Redding CA, et al: Initial efficacy of MI, TTM tailoring and HRI s with multiple behaviors for employee health promotion. Prev Med 46: 226―231, 2008.
16) Johnson JL, Prochaska JO, Paiva AL, et al: Advancing bodies of evidence for population-based health promotion programs: randomized controlled trials and case studies. Popul Health Manag 16: 373―380, 2013.
17) Bandura A: Self-efficacy: Toward a unifying theory of behavioral change. Psychol Rev 84: 191―215, 1977.
18) Taylor CB, Bandura A, Ewart CK, et al: Exercise testing to enhance wives confidence in their husbands cardiac capability soon after clinically uncomplicated acute myocardial infarction. Am J Cardiol 55: 635―638, 1985.
19) Bandura A: Health promotion by social cognitive means. Health Educ Behav 31: 143―164, 2004.
20) Oka K: Stages of change for exercise behavior and self-efficacy for exercise among middle-aged adults. Nihon Koshu Eisei Zasshi 50: 208―215, 2003.
21) Li F, McAuley E, Harmer P, et al: Tai Chi enhances Self-efficacy and exercise behavior in older adults. J Aging Phys Act 23: 161―171, 2001.
22) Kelley K, Abraham C: RCT of a theory-based intervention promoting healthy eating and physical activity amongst out-patients older than 65 years. Soc Sci Med 59: 787―797, 2004.
23) Pinto BM, Frierson GM, Rabin C, et al: Home-based physical activity intervention for breast cancer patients. J Clin Oncol 23: 3577―3587, 2005.
24) Cohen RY, Brownell KD, Felix MR: Age and sex differences in health habits and beliefs of schoolchildren. Health Psychol 9: 208―224, 1990.
25) Dunn A, Marcus B, Kampert J, et al: Comparison of Lifestyle and Structured Interventions to Increase Physical Activity and Cardiorespiratory Fitness. JAMA 281: 327―334, 1999.
26) Coakley EH, Rimm EB, Colditz G, et al: Predictors of weight change in men: results from the Health Professionals Follow-up Study. Int J Obes Relat Metab Disord 22: 89―96, 1998.
27) Ching PL, Willett WC, Rimm EB, et al: Activity level and risk of overweight in male health professionals. Am J Public Health 86: 25―30, 1996.
28) Matthews CE, Freedson PS, Hebert JR, et al: Seasonal variation in household, occupational, and leisure time physical activity: longitudinal analyses from the seasonal variation of blood cholesterol study. Am J Epidemiol 15: 172―183, 2001.
29) Uitenbroek DG: Seasonal variation in leisure time physical activity. Med Sci Sports Exerc 25: 755―760, 1993.
30) Lakka TA, Laaksonen DE: Physical activity in prevention and treatment of the metabolic syndrome. Appl Physiol Nutr Me-tab 32: 76―88, 2007.
31) Phillips SM, Tipton KD, Aarsland A, et al: Mixed muscle protein synthesis and breakdown after resistance exercise in hu-mans. Am J Physiol 273: E99―107, 1997.
32) Kraemer WJ, Deschenes MR, Fleck SJ: Physiological adaptations to resistance exercise. Implications for athletic conditioning. Sports Med 6: 246―256, 1988.
33) Estabrooks PA, Fox EH, Doerksen SE, et al: Participatory research to promote physical activity at congregate-meal sites. J Aging Phys Act 13: 121―144, 2005.
34) Kelley K, Abraham C: RCT of a theory-based intervention promoting healthy eating and physical activity amongst out-patients older than 65 years. Soc Sci Med 59: 787―797, 2004.
35) Pinto BM, Frierson GM, Rabin C, et al: Home-based physical activity intervention for breast cancer patients. J Clin Oncol 23: 3577―3587, 2005.
36) Senuzun F, Fadiloglu C, Burke LE, et al: Effects of home-based cardiac exercise program on the exercise tolerance, serum lipid values and Self-efficacy of coronary patients. Eur J Cardiovasc Prev Rehabil 13: 640―645, 2006.
37) Gary R: Exercise Self-efficacy in older women with diastolic heart failure: results of a walking program and education inter-vention. J Gerontol Nurs 32: 31―39, 2006.
38) Marcus BH, Bock BC, Pinto BM, et al: Efficacy of an individualized, motivationally-tailored physical activity intervention. Ann Behav Med 20: 174―180, 1998.
39) Peterson TR, Aldana SG: Improving exercise behavior: an application of the stages of change model in a worksite setting. Am J Health Promot 13: 229―232, 1999.
40) Calfas KJ, Sallis JF, Oldenburg B, et al: Mediators of change in physical activity following an intervention in primary care: PACE. Prev Med 26: 297―304, 1997.
Reprint request: Fuminari Asada , PT, MS
Research Center for the Health Promotion and Employment Support, Osaka Rosai Hospital, 3-1179, Nagasone, Kita-ku, Sakai-city, Osaka, 591-8025, Japan.
別刷請求先 〒591―8025 大阪府堺市北区長曽根町 1179―3 大阪労災病院治療就労両立支援センター 浅田 史成
勤労者の生活習慣病予防を目的としたエクササイズガイド 2006 を用いた
身体活動促進プログラムの検証
浅田 史成1) ,野村 卓生2) ,久保田昌詞1) 大橋 誠1) ,伊藤 健一3) 1)大阪労災病院治療就労両立支援センター 2)関西福祉科学大学保健医療学部 3)大阪府立大学大学院総合リハビリテーション学研究科 ―キーワード― 身体活動,産業保健,生活習慣病 目的:本研究は,健康づくりのための運動指針 2006 に基づく身体活動促進プログラム(以下,EPAR)の効果を一般 的な運動指導(以下,GEG)とともに検証することを目的とした.さらに,我々はそれぞれのプログラムの有効性を肥 満者のみで検討した.方法:対象は製造業で勤務する勤労者である.対象は EPAR 群,GEG 群とコントロール(以下,CONT)群の 3 つの グループへ無作為に分類した.対象者,測定者および解析者は盲検化した.測定項目は生化学検査値,身体組成,膝伸 展筋力(以下,KEF),運動の自己効力感(以下,ESE),トランスセオレティカルモデルにおける行動の変容ステージ (以下,SBC)とした.介入は 6 カ月間の間に 3 回実施した.
結果:対象は EPAR 群 40 名,GEG 群 40 名,CONT 群 38 名であった.EPAR 群では介入後,ESE が有意に増加し, SBC も有意に進展した.GEG 群においては,body mass index(以下,BMI)と ESE が有意に増加した.CONT 群では, BMI が有意に増加した.肥満者のサブ解析では,EPAR 群で KEF,ESE と SBC の有意な増加を認め,GEG 群では ESE のみ有意な増加を認めた.群間における変化量の検討において,KEF は CONT 群よりも EPAR 群と GEG 群で有意に高 く,CONT 群よりも EPAR で SBC は有意に向上した.
結論:健康づくりのための運動指針 2006 に基づく身体活動促進プログラムは,運動への自己効力感が増加し,生活習 慣病予防に寄与する可能性が示唆された.
利益相反:利益相反基準に該当無し
(日職災医誌,64:162─172,2016) ⒸJapanese society of occupational medicine and traumatology http://www.jsomt.jp