February 2017
Technical Note of the National Research Institute for Earth Science and Disaster Resilience: No.410
第 410 号
国立研究開発法人
防 災 科 学 技 術 研 防災科学技術研究所研究資料 第四一〇号 た め 池 堤 体 の 耐 震 安 全 性 に 関 す る 実 験 研 究
An Experimental Study on Earthquake Resistance of Small Earth Dam
- Estimation of Earthquake-Resistant Performance of Embankments with Sloping Core Zone and Geosynthetic Clay Liner -
ため池堤体の耐震安全性に関する実験研究
−改修されたため池堤体の耐震性能検証−
382 す 54 18 5 の1 2014 2
383 す 55 23 5 の1 2014 2
384 す 56 16 5 の1 2014 2
385 に る の DVD 6pp 2014 2
386 The AITCC User Guide –An Automatic Algorithm for the Identification and Tracking of Convective Cells– 33pp 2014 3
387 に る の 2012/13 47pp 2014 2
388 す 57 25 5 の1 2014 3
389 に る (36) 2013/14 22pp 2014 12
390 に る の 2013/14 47pp 2015 2
391 の のための - 実験 -
の 実験 耐震 の耐震 実験- 193pp 2015 2
392 す 58 27 5 の1 2015 3
393 す 59 10 5 の1 2015 3
394 す 60 関 中 15 5 の1 2015 3
395 全 の 2015
396 2015 4 震 Gorkha 震)に る の に関する 58pp 2015 7
397 2015 4 震(Gorkha 震)に る に関する 16pp 2015 9
398 に る (37) 2014/15 29pp 2015 11
399 震 た 震 の DVD 253pp 2015 12
400 に する 震に る の の DVD 216pp 2015 12
401 全 体の 47pp 2015 12
402 に る の 2014/15 ) 47pp 2016 2
403 に る の の 1979 2015 52pp 2016 2
404 2015 4 震(Gorkha 震)に る 震の に関する 54pp
2016 3
405 に関する研究 - の - 220pp 2016 3
406 の 132pp 2016 8
407 2015 4 震 (Gorkha 震 ) に る の に関する - -
120pp 2016 10
408 に る の (2015/16 ) 39pp 2017 2
409 に る (38) 2015/16 28pp 2017 2
339 す 45 14 5 の1 2010 3
340 に る の (2008/09 ) 33pp 2010 3
341 震 震 Vol. 27 21 No. 1 CD-ROM 2010 3
342 震 震 Vol. 28 21 No. 2 CD-ROM 2010 3
343 に る の 性 験 CD-ROM 15pp 2010 3
344 す 46 19 5 の1 2010 7
345 す 47 16 5 の1 2010 8
346 に る 31 2006/07 , 2007/08 , 2008/09 47pp 2010 9
347 す 48 17 5 の1 2010 11
348 18 震 実 3 RC 実験 DVD 68pp 2010 8
349 研究 に る の 性 験 CD-ROM 12pp
2010 8
350 DRH-Asia) 266pp 2010 12
351 に る の 2009/10 31pp 2010 12
352 18 震 実験 -震 に る の耐震性 研究-
CD-ROM 120pp 2011 1
353 のH/V た 震 の の 242pp
2011 1
354 震 の DVD 155pp 2011 5
355 ARTSに た の 2007 4 か 2010 3 28pp 2011 1
356 に る 32 2009/10 29pp 2011 2
357 の DVD 32pp 2011 2
358 震 震 Vol. 29 22 No. 1 CD-ROM 2011 2
359 震 震 Vol. 30 22 No. 2 CD-ROM 2011 2
360 K-NET KiK-net 震 1996-2010 DVD 6 2011 3
361 の 23 3
238pp 2011 3
362 す 49 16 5 の1 2011 11
363 に る 33 2010/11 29pp 2012 2
364 に る の 2010/11 45pp 2012 2
365 す 50 16 5 の1 2012 3
366 の CD-ROM 30pp 2012 2
367 研究 に る関 に る の 29pp 2012 3
368 の に 1951 2008 CD-ROM 19pp 2012 5
369 E-Defense た実 RC C1-5 震 実験研究 -実 の たRC の耐
震性に関する震 実験 の - DVD 64pp 2012 10
370 震 のための に る の CD-ROM) 410pp 2013
3
371 に る の 性 験 CD-ROM 27pp 2012
12
372 に る (34) (2011/12 ) 31pp 2012 11
373 の の CD-ROM 48pp 2013 2
374 の CD-ROM 50pp 2013 3
375 に る の 2011/12 49pp 2013 2
376 す 51 20 5 の1 2013 3
377 す 52 25 5 の1 2013 3
378 す 53 16 5 の1 2013 3
379 震 た 震 の に た 349pp 2012 12
380 の 2 DVD 186pp 2013 7 © National Research Institute for Earth Science and Disaster Resilience 2017
学 研究 研究 料 410 –編集委員会
–
29 2 17 研究
研 究
305-0006
3-1 (029)863-7635
http://www.bosai.go.jp/
中152-4 澤
中
*
研究 研究 震 実験研究** ***
ため池堤体の耐震安全性に関する実験研究
-改修されたため池堤体の耐震性能検証-
中澤 澤
An Experimental Study on Earthquake Resistance of Small Earth Dam
–Estimation of Earthquake-Resistant Performance of Embankments with Sloping Core Zone and Geosynthetic Clay Liner–
Hiroshi NAKAZAWA
*, Yutaka SAWADA
**, Tomohiro KOBAYASHI
***, Tetsuya ODA
***, Seita KOBAYASHI
**, Toshinori KAWABATA
**, Satoru SHIBUYA
**, Satsuki KATAOKA
**, Takuzo YAMASHITA
*,
Koichi KAJIWARA
*, and Takahito INOUE
**
Department of Disaster Mitigation Research,
National Research Institute for Earth Science and Disaster Prevention, Japan [email protected],[email protected],[email protected],[email protected]
**
Kobe University, Japan
[email protected], [email protected], [email protected], [email protected], [email protected]
***
Hyogo Prefecture, Japan
[email protected], [email protected]
Abstract
In this study, full-scale shaking table tests for embankments were carried out in order to estimate the earthquake resistance of small earth dams with geosynthetic clay liner for a short supply of clay material which requires sloping core zones at many sites. In the experiment, two types of embankments of 3 m of height were constructed in large soil containers respectively. The dynamic behaviors of embankments were observed by two sinusoidal waves equivalent to Level1 (177 Gal) and Level2 (471 Gal) earthquake in experimental condition respectively. After Level2-shaking, several longitudinal cracks were occurred at the crest of the embankment with geosynthetic clay liner. However, it was confirmed that embankment with geosynthetic clay liner had been keeping its function after shaking because of no water leakage to the downstream side.
Key words: Small Earth Dam, Full-Scale Shaking Table Test, Geosynthetic Clay Liner, Seismic Behavior, Residual
Deformation
1. 研究概要
28 3 17-18 にか
に る 研究 研究
耐震 研究 - に
ため池堤体の耐震安全性に関する実験研究 実 ため池堤体の震 実験 実 た 実験 ため池の に
性 る の
る の に の
た か の
る
する る
研究 る の耐震性
する に
に る 験 2 の に
に 耐震性 た
実験の の か 実験実
た に る め する の
る 研究 - た
の
研究 の 研究
の 研究の に実 た
1.1 背景および目的
全 に 20 の ため池
中に る の
るため池 る に るため池
の に ため ため池の
る
に 27 4 3 8
全 1 のため池
に に
る の 9
ため池 の 5 す る
の る か の
か にか
たため池
123 の 震 のため池堤体
震 に の に
の た た
震の 30 の 70 %
の 震 の
る ため池
に 耐震 震 に
る る
にため池 め る
ため池の 性
に る の
る か に するため
池の に の に の
の る
する る 14
か た に
27 15 池 に た
実 中 る た に
の に る
に の た に
の 1 る か
の
に た耐震性 の
る 震 の安全性
た ほ 研
究 る
たため池堤体の耐震安全性の に 研究 の実 震 実験
- 堤 3 m の実
ため池堤体 に に る堤体
に る堤体 する 実験
実 た
る に
関する の 全 のため池
する 体 の
の 実 体 る 実
験 た の の耐震性に関する
め 研究 の る
1.2 ため池の地震被害事例と課題
7 1995 震に る
のため池 の する た
の の 震に る に
める
1.2.1 平成 7 年 ( 1995 年) 兵庫県南部地震
1996
2に る
6 に 51,000 のため
池 の 全 た のため
池の の 60 % 7 1 の
震 震 7 の震 か 30 km の
に 中 ため池に た
ため池の 図 1 の ため
池 1,362 の 震 か 10 km の
に 10 % 20 km の に 45 % 30 km の
に 85 % た ため池 1,362
の 961 に に
中 た のため池 中
の の に る の
す す る
に る の か た
ため池の 堤体に る の
の の た
の の ため池
堤体全体 た の た た 堤体
震 の る の の 中する
に の
た 震 に
の 震 ため池堤体に に た
の
に た る
た に
堤体 の 堤体
の た た ため池の
の に か か
たため 堤体 の に
る か た るに か
か に た
る た
に 震 に の
ため池 に
ため池 かの 性の
に の た 震
に に る の
た
体 の 池
に 堤体 に の 全
る た 写真 1 に す
に 池 のため池 震
ほ 震 に 堤体中 か
に 堤体 97 m の全 に 4 m の
に た に
に る に る
に に る のために に
堤体 の に
に た
た の る に るた
め池に た 写真 2 に
す の 池
堤体 に 20 260 mm 50 250 mm
の 80 m に に
た た 堤体 に た に
写真
1
池のPhoto 1 Slope failure at the upstream embankment of Niroku dam.
図
1
ため池のFig.1 Distribution of the damaged small earth dams.
に 堤体
安 に か に の
に る た 写真 3 に
す の の 池 る 堤
体 の に 12.5 m 2 に
1 6 cm の た た
に 1 cm の たほか
HP φ900 mm
に た に に
か た
震 か の の
ため池に に の 震に る に
の たため
に する のための
める に の するため
め た
31.2.2 近年の地震におけるため池被害の概要
ため池の 震 に関
4中 震 中 に 5 の 震に
の か
る に る
に の る
堤体 の
震 の ため池
に す る
た 2011 震
のため池 3,730 の 20 % に する 745
のため池に の
池 池 中池
に る
5に 池の 堤
150 の 7 の
た に に
2016 4 の 震 震
7 する に の 震
に た 28 2016
震の 関 の
6する の る 122 のため
池の 109 の
たの ため池 め する 13
た る の
め たため池に 安全
の か の
に る た る
1.2.3 既往の被害に見る課題
の 研究 する ため
池堤体 に る る
の た の
る か る に
1995 震 の に る
に 堤体 た
る の 実か する
実 に 堤 に る 性
め た堤体 に た
る た 震 の安 性
震 の の 性 に する
写真
3
池のPhoto 3 Longitudinal cracks on the crest of Tsuru dam.
写真
2
池のPhoto 2 Longitudinal cracks on the crest of Kotoribami
dam.
ための る の
る 震の る中 ため
池 に 堤体の耐震性 する
め る
2. 既往の研究とため池改修の現状
堤体 め する の耐震性に関する
の研究 実験
に 実 の の
に関する研究 る
7 10か に る ため池 た研究
実験
11 , 12る
ため池の に
め た 池 の の に
堤 た 池 る に
の ため池堤体 性
に る
る 性 るの
る た のため池の に の に る の
る ため池
13
性 の
た
に る る
に 実 する
ため池の する
る の るほか
安 る mm の
に する の
る 写真 4 の
実 の る
Geosynthetic
Clay Liner , GCL ため池堤体の
する の る の研究に GCL
の 性 性に る
14 16
の の
る に の
する
る
17実 14 か
た に
27 に 9 池 3 池 実
中 る か
たため池堤体の耐震性 に
ため 体の 性 に
堤体 の の の 安 るの
る .
3. 実験概要 の
るため池堤体の 震 安全性 する
研究 の実 震 実験
- た堤 3 m する
実 ため池堤体の 実験 実 た 実験 た ため池堤体の に る実 震 実験
震 実験に る 堤体 の 験
16実験 に る実験 の
12験 に る の た た
の の 震 実験 に 2
た に 実験の か 実 に
る の めた に る
3.1 震動台の仕様および全体工程
実験
たため池堤体の に る実 震 実験 る の 震 実験に る の
の 震 実験 に 2
た に た に の
体の 性の に た 実験
写真
4
のPhoto 4 Repair construction of small earth dam using GCLs.
る か 性 た
震 実験の実 に た 写真 5 に す
研究 の実 震 実験 -
た 震 の 表 1
に す 1,200 t の
900 cm/s
21,500 cm/s
2±100 cm ±50 cm 堤 3
m する実 のため池堤体の 震 の
するに 性 る
実験 に関 27 中に
の 験 実験
実 27 6 実 実験の
た の に る実験 の
8 に -
た に実
験 た た 堤体 の
12 2 の の
に か た 28 2 に 験体
堤体 の 験 実 め に関す
る の た た 写真 6 に す に
- の に
2 の
た に 28 2 29 震 の た か 写真 7 に す
に 震 に 2 堤体の
た 堤に関 の する
験 に た
実験 に 1:1.5 の
の る た の に
3 の 3 17-18 にか 実験
実 た 実験に 堤体の め に る の
1(L1) 2(L2) 震 に
る 実験 の
の に 震
か す の た
表
1
震 のTable 1 Specifications of shake table.
写真
5
実 震Photo 5 Full scale 3-dimensional shake table.
写真
6
Photo 6 Construction of a soil container.
写真
7
17Photo 7 Installation of soil containers on the shake table.
3.2 土槽
実験に た 2 の 実験 の の る 1 た 6 の か
る - の
性 図 2 に す
に 12.59 m 3.55 m 2.50
m の 105 t/ た FEM に る
の の性 1G の
に耐 る 性 る た
実験 写真 7 に た に 2 の
震 に に
た H た た の に る
の するため の
に に た
3.3 実験対象断面
実験 図 3 に す 実験 2 の堤体
に た た
ため池
GCL たため池 る 堤 3 m
1.5 m 1:1.5 0.2 m
に 2.5 m の る
図
2
Fig. 2 Detail drawings of soil containers.
図
3
験体Fig. 3 Model configurations.
No.1 前刃金工法
1.5
10.5 2.5 3.0
0.2
0.6 0.6
No.2 遮水シート工法
1.5
10.5 ト ト
シート 3.0
0.2 2.5
ランダム材料
ランダム材料
3.4 実験用地盤材料
3.4.1 刃金土の物理特性および力学特性
図 3 に す に た堤体
の に る 性
る 実験
た の 性 た
図 4 め 図 5 験の 表 2 験に る 表 3 に す 表 2
2 mm 19 mm の 験 する
1 の の
かる 3.4.2 ランダム材料
実験 の
た する
の 性 める た
3 4 堤体 に
に る た た
震 の 震に の
性
3 , 4写真
8
Photo 8 Mixing sand with core material.
a)
る に るb
のす1E-3 0.01 0.1 1 10 100
0 20 40 60 80 100
3.54 0.60
刃金 1000 1.6 21
9.6
8 10 12 14 16 18 20 22
1.60 1.65 1.70 1.75 1.80 1.85 1.90
刃金 �dmax =1.824 g/cm3 wopt =15.7 %
mc/g3
水 (
�dmax =1.890 g/cm3 wopt=12.6 %
�dmax =1.866 g/cm3 wopt =14.0 %
の 水
m/s
の
2mm 6.80 × 10
-7の
の
2mm 3.06 × 10
- 6の
19mm 9.42 × 10
-6の
の
19mm 2.39 × 10
-5の c’
(kN/m
2)
f(
o)
の
D 90% 38.4 33.2
の
の
2mm D
86% 6.1 35.5
図
4
堤体 の 17Fig. 4 Grain size distribution of embankment materials.
図
5
堤体 の めA-b
17Fig. 5 Compaction curves for embankment materials.
表
2
験 17Table 2 Permeability test results.
表
3
験CUB
17Table 3 Triaxial compression test results.
の に の に
堤体の る 性 る か
の た
に る た
に に 1:1
験 実 た
の の に の
図 4 め 図 5 験の 表 2 験に る 表 3 に た
表 2 する に 2.5
4.5 る かる
の た 1:1 の
の た
実験に の るため 写真
8 に す に に 0.45 m
3の
る に る
す に る た
する の の
1:1 す の 性
る か た か 2
m の 実 た 1:1 の
に する
め た
体 1:1 る に
た の の の
め 図 4 図 5 に る 性 Ip NP
た め 97 % 9 %
の 体の 験の
35.3 kN/m
2た た
に 験 実 た 図 6 に す に
RL20 0.641 に た
実験 に 堤体 に る
に る 験 に
る 験 実 た の
るため の
9.5 % 8.3 kN/m
2た
た に 験 図 7 に
3.4.3 ベントナイトシートの材料特性
実験 た の
図 8 に 表 4 に 性 の性 す た の 性に
0.2 0.3 0.4 0.5 0.6 0.7 0.8 0.9 1.0 1.1 1.2
0.1 1 10 100 1000
σd/σc'
Nc
DA=1%
DA=2%
DA=5%
DA=10%
/ c'=0.95
0 5 10 15 20 25 30 35 40
0 10 20 30 40 50 60 70 80
1.00E-04 1.00E-03 1.00E-02 1.00E-01 1.00E+00 1.00E+01
h(%)
Geqm/NM(2)
γ SA(%)
(5 )
(10 )
(5 )
(10 )
引
kN/m 13.2 16.7
115 91.1
引
N 192 203 シ 1096法
×
N/m 918 638 引 引100 min
×
mm
g/m2
N
ml/2g
し 水 l
シ ー
し
( RH
518
24.0
法
1908
×
8.29
5720
図
6
験Fig. 6 Results of liquefaction resistance test.
図
7
験Fig. 7 Results of cyclic shear deformation characteristics test.
図
8
のFig. 8 Schematic of GCL.
表
4
の性Table 4 Specifications of GCL.
の研究
16に 験
る に
た の 験か 15 kN/m
228º る た の
の に た 験か
0 kN/m
234º
る 実験の する
の る か
実験 の
たため 性
る 性 る
3.5 試験盛土
堤体 するため 験
め た 験 図 9 に す
に た
20 cm の に の 0 4 6 8
10 の 2 40 cm 験
実 た RI に る
の 験に に 3 た
た
25 cm 800 kg の
写真 9 た 験の 表 5
工 法 ー ー ート ー ー
0 4 6 8 10 6 8 6 8
RI
計測
% 12.4 12.0 12.3 11.2 11.4 11.4 10.9
測
% 11.8 12.1 12.0 11.6 10.7 15.0 15.4
%
wopt=12.6
wopt=15.7
工 法 ー ー ート ー ー
0 4 6 8 10 6 8 6 8
RI
計測
% 84.5 94.1 96.7 97.2 97.0 94.0 94.9
測
% 83.3 94.0 98.7 99.5 101.4 102.1 102.5
% 90
×
図
9
験Fig. 9 Schematic of test banking.
表
5
験 に るTable 5 Water contents in test banking.
表
6
験 に る 験Table 6 Soil densities in test banking.
表 6 に す の に 図 10 に め の関 す
6 の め 95 % る
か 実験 め 6 めた
た 20 cm にするための
23 cm る か た の
め に
写真 10 め める る ため 6 8 に する RI に
た た に
るため た 6 8
に る の め に
の 表 5 表 6 図 10 に る
に 験
PANDA
19た
PANDA た
に る
1,400 に 2,000 10
の め
の に る 験
験 る か め の
図
10
め の関 験Fig. 10 Relations between compaction number and
degree of compaction.
写真
11 PANDA
の 験Photo 11 Penetration test using PANDA.
写真
9
に る めPhoto 9 Compaction using a vibrating roller.
写真
10
た めPhoto 10 Compaction using a plate compactor.
ランダム材料_ローラー
ランダム材料_プレート
図
11 PANDA
の 験 のFig. 11 PANDA and the test procedure.
実験に る の に
る る RI の
に 験 実 する め の た
図 11 a c に 験 全体
の 験の の す
q
da に す に に る
の に た に
の の 1 に る る
た q
dの
の関 か に め る
x M P MV
A q
d1
+ 1 2 1 1
=
2
1
1 中に す A M の
P る の V
x 1 た の
MV
2/2 の の
に め る の
b に 験の る a に
1 験 b
験に ほ c 験
に の る
た に q
dN の関 に
に の に る
q
d0.2 0.3N 性 2a
q
d0.4 0.5N 中 2b
q
d0.6 1N 2c
験の 写真 11 験 図 12 に
す に の
か 20 cm 50 cm
100 cm の に
る に る q
dの
る 験 の 験
る 験 の 40 cm
る る の に に
50 cm の に る 験
る 0 か 5 cm に
1,500 kPa の 300
900 kPa の q
dの る 4 か
6 にか q
d2,000 kPa る
ほ に る た 6
る る のの ほ
q
dる か
5 cm 20 cm の に る q
d-60 -50 -40 -30 -20 -10
0 0 10000 20000 30000 40000 50000
Depth (m)
qd (kPa)
0 4 6 8 10 Plate
-180 -160 -140 -120 -100 -80 -60 -40 -20
0 0 10000 20000 30000 40000
)m( htpeD
qd (kPa)
図
12 PANDA
の 験Fig. 12 Test results of PANDA.
写真
12
Photo 12 Spreading embankment materials.
写真
13
に るPhoto 13 Compaction using a vibrating roller.
4 8 10 る
図 12 に す 験 q
dに 0 4 6 10 た
0 4 8 10 の するため
6 た の
の 性 る た
3.6 堤体の施工および施工管理
実験
たため池堤体 た に
堤 3 m る
堤体の に た
23 cm 25 cm に る に
に に た 写真 12
800 kg に 6 た
写真 13 0.9 km/h 15 m/min た
堤体 堤体 の の
ため た
3 に RI に る の
験 JIS1614 に 1 に
の 験 JIS A 1214 実
め た
堤体に 実 た 験
表 7 表 8 図 13 に す の
堤体 た 写真 14
た の
写真 15 た 写真
16 に
に 8 の 実 た 写真 17 3.7 計測計画
表 9 図 14 図 19 に す 堤体の に
60 cm の ASW-5AM36
の BPR-A-200KPS
の に た に の
するため KEYENCE の
LK-500 IL-2000 た
る す
る か に た
表
7
に る めTable 7 Degrees of compaction and water contents for each layer (in the case of sloping core zone).
図
13
め の 17Fig. 13 Distributions of degree of compaction and water content.
法 法 1 2 3 4 5 6 7 8 9 10 11 12 13 14 15
- 3 3 3 3 3 3 3 3 3 3 3 3 3 3 3
D - 98.1 95.9 100.3 95.3 98.0 96.4 94.4 93.4 95.4 97.2 95.3 96.2 95.0 99.4 97.4
D - 99.2 97.6 103.8 98.3 101.3 100.0 96.0 94.5 95.8 98.9 96.1 96.8 96.5 100.3 99.3
D - 96.1 94.2 96.8 92.4 93.7 93.1 92.9 92.2 94.7 95.8 94.8 95.8 94.1 97.9 96.3
水 - 13.0 12.8 12.2 13.3 12.1 11.9 12.7 12.6 13.0 12.3 12.8 13.8 13.3 12.3 12.2 D 98.1 100.4 99.9 100.0 101.5 100.8 98.1 99.5 99.1 100.8 100.1 97.7 100.9 99.8 98.3 98.5 水 16.1 12.5 13.5 12.4 13.1 12.1 12.0 12.6 11.9 11.9 12.1 11.5 11.3 11.6 11.2 12.4
D - - 100.0 - - 98.4 - - 98.5 - - 100.1 - - - -
水 - - 15.3 - - 15.9 - - 15.5 - - 15.5 - - - - 法
ー ー RI
表
8
に る めTable 8 Degrees of compaction and water contents for each layer (in the case of GCL).
0 50 100 150 200 250 300
0 50 100 150 200 250 300
90 92 94 96 98 100 102 104 106 108 110 前刃金工法
ー ー 刃金
遮水シート工法
mc
ー ー ー ー ート
堤 体 に た P1-09
P2-09 の –10 cm に
の にするため に め
た P2-07 の P2-08
る 堤体 に 中
TDS303 に 5 中
200 Hz た
に る堤体の するため 堤体 に
た 実 た た
堤体の に る に 3D
験 に PANDA
実 た
3.8 土槽注水後の浸潤線の把握
堤体 の た の
堤体の安 性に すため に る
たため池堤体の に た
た 堤体
の に に するため
- 実 た
写真
14
Photo 14 Slope face shaping work.
写真15
のPhoto 15 Bench-cut construction.
写真
16
Photo 16 Installation of GCL.
写真17
に るPhoto 17 Compaction using a plate compactor.
表
9
Table 9 Lists of sensors.
計測 工法 遮水シート工法 計
ASW-5AM36 計 50 55 105 堤体
水 計
BPR-A-200KPS 24 24 48 堤体
ー ー 計 LK-500
IL-2000 18 18 36 H
計 93 98 189
A1-04 A1 -05
A1-10 A1-11 A1-12
A1-18 A1 -16
A1-21 A1-17
A1-02 A1 -07 A1-08 A1-09
A1 -13 A1-14 A1 -15 A1-25
A1-26 A1-24
A1-22 X A1-22 Y A1-22 Z
A1-06 Z A1-06 Y A1-06 X
A1-27 Y A1-27 Z
A1-30 X A1-30 Y A1-30 Z
A1-29 X A1-29 Y A1-29 Z
A1-28 X A1-28 Y A1-28 Z
A1-23 Y A1-23 Z
A1-19 X A1-19 Y A1-19 Z A1 -20 X
A1 -20 Z A1 -20 Y
A1-03 X A1-03 Z A1-03 Y
A1 -01X A1 -01Y A1 -01Z
1294 1294
750 750
870 870
1400 1400
1710
2300 2300
1555 2550 3200
1555
2425 24253200
3390
4100 4100
3295 2999
4230 2064
3295 2999
6294 6294 6294 6294 6294 6294
工法 計 xyz 計 xz
× 計 x
A1-04 A1 -05
A1-10 A1-11 A1-12
A1-18 A1 -16
A1-21 A1-17
A1-02 A1 -07 A1-08 A1-09
A1 -13 A1-14 A1 -15 A1-25
A1-26 A1-24
A1-22 X A1-22 Y A1-22 Z
A1-06 Z A1-06 Y A1-06 X
A1-27 Y A1-27 Z
A1-30 X A1-30 Y A1-30 Z
A1-29 X A1-29 Y A1-29 Z
A1-28 X A1-28 Y A1-28 Z
A1-23 Y A1-23 Z
A1-19 X A1-19 Y A1-19 Z A1 -20 X
A1 -20 Z A1 -20 Y
A1-03 X A1-03 Z A1-03 Y
A1 -01X A1 -01Y A1 -01Z
A2-02 A2-04
A2-08 A2-09 A2 -10
A2-11 A2-14
A2 -15 A2 -16 A2-17 A2-18 A2-19 A2-20 A2-21
A2-24 A2-25
A2-06
A2-31A2-30 A2-28 A2-29
A2-13 A2-12 A2-07 X
A2-07 Y A2-07 Z
A2-26 X A2-26 Y A2-27 Z
A2-32 Y A2-32 Z
A2-35 X A2-35 Y A2-35 Z
A2 -34 X A2 -34 Z A2 -34 Y A2-33 XA2-33 Y
A2-33 Z
A2-23 X A2-23 Z A2-23 Y
A2-27 Y A2-27 Z
A2-22 X A2-22 Y A2-22 Z
A2 -03 X A2 -03 Y A2 -03 Z
A2-01 X A2-01 Y A2-01 Z A2-05
750 750 8701400 1050 1250720
1250 2300
1555 1555 1950 1250
2425 24253200
1250 2850 4100
1294 1294
2064 4230 3295 2999
2544 3750
2999 3295
6294 6294 6294 6294 6294 6294
660 600 540
ト トシート工法 計 xyz 計 xz
× 計 x
A2-04 A2-11 A2-14
A2 A2-20 A2-21
A2-06 A2-13
A2-12 A2-07 X
A2-07 Y A2-07 Z
A2-26 X A2-26 Y A2-27 Z
A2-05
P1 -01 P1 -02 P1 -03 P1 -04 P1 -05 P1-06 P1 -07 P1 -08 P1 -09
P1-10 P1 -11 P1 -12
P1-13 P1 -14 P1 -15
P1 -16 P1 -17 P1 -18 P1 -19 P1 -20
P1 -21 P1 -22
P1 -23 P1 -24
3295
4230 2999
1294
2999 2064 5221294
6294 6294
2300 32002550
1555 1555
6294
41003390 4100
2425 2425
6294 6294
3295 870
1400
1710
1648 1648
工法 水 計
P1 -01 P1 -02 P1 -03 P1 -04 P1 -05 P1-06 P1 -07 P1 -08 P1 -09
P1-10 P1 -11 P1 -12
P1-13 P1 -14 P1 -15
P1 -16 P1 -17 P1 -18 P1 -19 P1 -20
P1 -21 P1 -22
P1 -23
P1 -24P2-09 P2 -08 P2-07 P2-06 P2-05 P2 -04 P2-03 P2-02 P2-01
P2-10 P2 -11 P2 -12
P2-13 P2-14 P2-15
P2-16 P2-17 P2-18 P2-19 P2-20
P2-21 P2-22
P2-23 P2-24
1294 2999 3295
3295 2999
2064 1294 522
6294 6294
1555
6294
3200 1555
4100
2425 2425
6294 6294
720 660 1250 1250 1250600 540 1250
870 870
1648 1648
ト トシート工法 水 計
P2- P2-06 P2-07 P2 -08 P2-09
P2-13 P2-14 P2-15
P2 P2-19 P2-20
P2-22P2-2 P
D1J-12
D1J-11 D1T-11 D1T-12 D1T-13
D1 K -21 D1 K-22
D1 K -31 D1 K-32
D1 K -42
D1T-33 D1T-23 D1T-13 D1 K -11
D1 K -12
200 350 350 200
2500
100 100
800 800
450 450
670 170
670
工法 ( ) ー 計LK-500 ( ) ー 計IL-2000
D1J-12
D1J-11 D1T-11 D1T-12 D1T-13
D1 K -21 D1 K-22
D1 K -31 D1 K -32
D1 K -42
D1T-33 D1T-23 D1T-13 D1 K-11
D1 K-12 600 300
600300
400 D2J -12
D2 K -22 D2 K -21
D2 K -31 D2 K -32
D2 K -42
D2T -33 D2T -23 D2T -13 D2T -12
D2J -11 D2T -11 D2T -13
D2 K -11 D2 K -12
700 600 300
600300
ト トシート工法 () ー 計LK-500 () ー 計IL-2000
400 D2J -12
D2T -12 D2J -11 D2T -11 D2T -13
D
700 200
350 350 200
100 2500 100
800 800
450 450
670 670
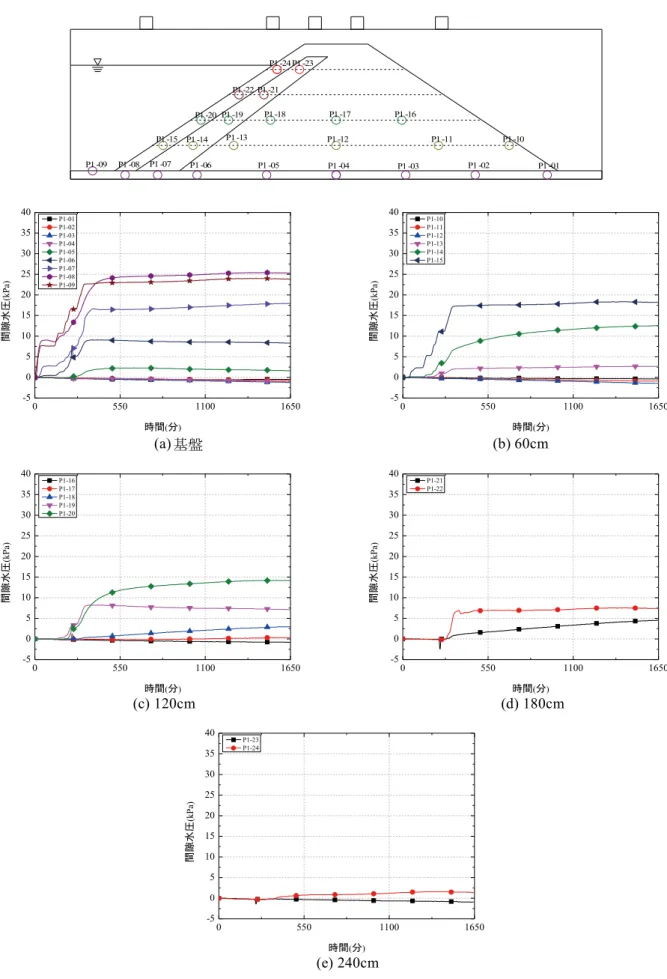
に た実 の
に するため に る堤体 の
の に 堤体の 図 20 図 23 に す に る堤体 の
の の に
る の に た図 24 る
P1-09 P2-09 に する
る P1-08 P2-08 の
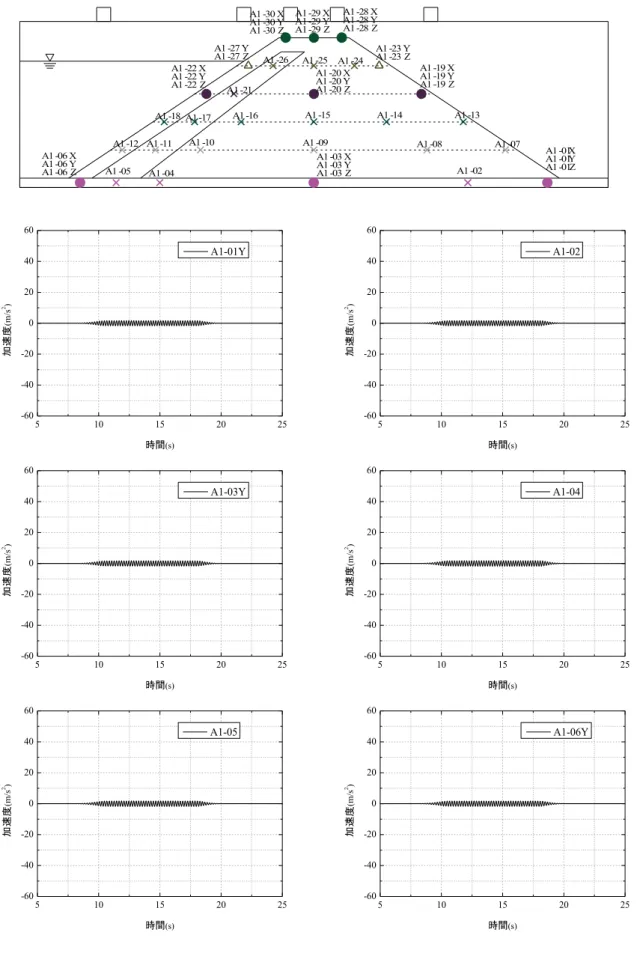
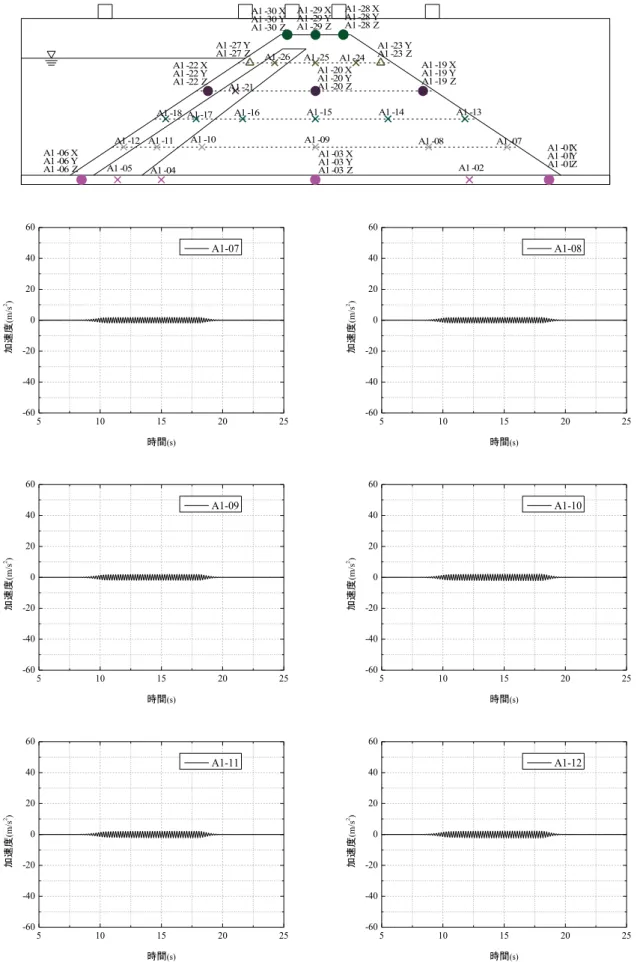
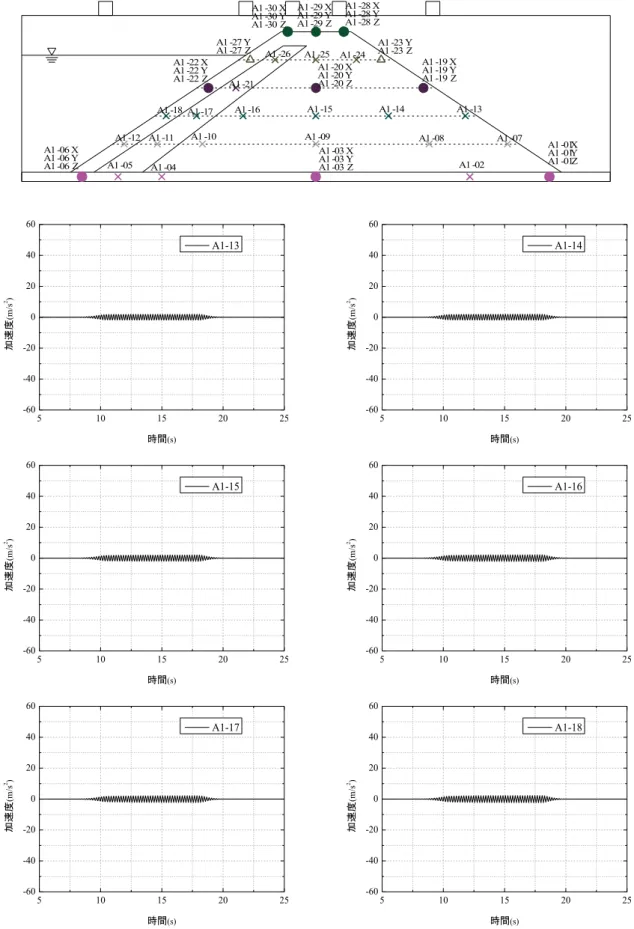
図
14
Fig. 14 Locations of accelerometers (sloping core).
図15
Fig. 15 Locations of accelerometers (GCL).
図
16
Fig. 16 Location of pore water pressure transducers (sloping core).
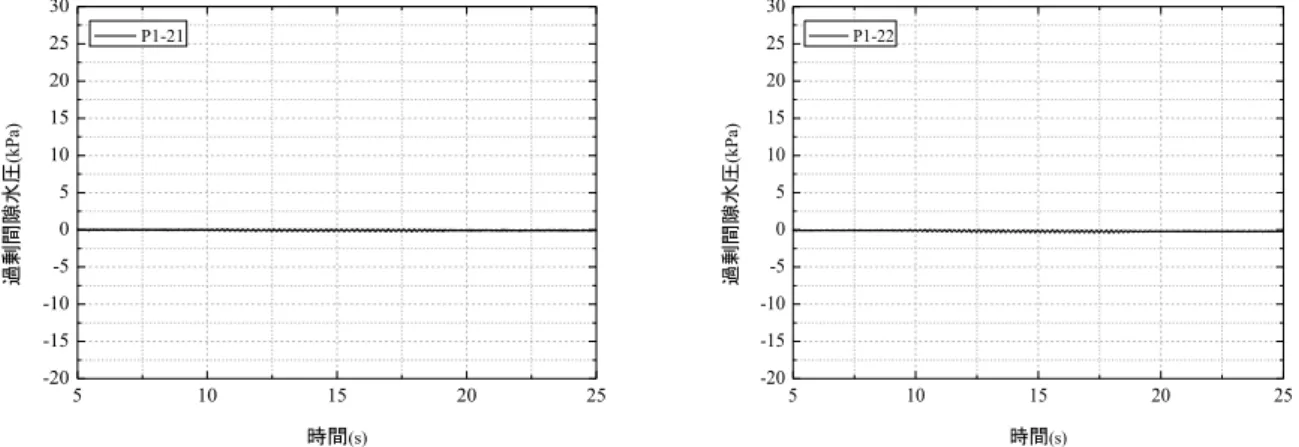
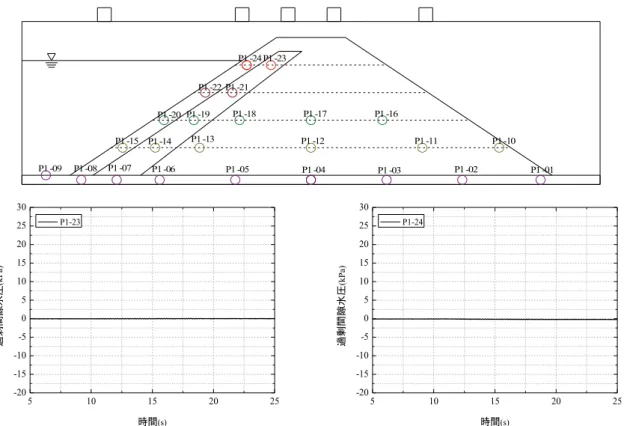
図
17
Fig. 17 Location of pore water pressure transducers (GCL).
図
18
Fig. 18 Location of laser displacement sensors (sloping core).
図19
Fig. 19 Location of laser displacement sensors (GCL).
図
20
の に るFig. 20 Changes of pore water pressure during filling water (sloping core).
0 550 1100 1650
-5 0 5 10 15 20 25 30 35 40
間)aPk(
時間( ) P1-01
P1-02 P1-03 P1-04 P1-05 P1-06 P1-07 P1-08 P1-09
0 550 1100 1650
-5 0 5 10 15 20 25 30 35 40
間)aPk(
時間( ) P1-10
P1-11 P1-12 P1-13 P1-14 P1-15
(a) (b) 60cm
0 550 1100 1650
-5 0 5 10 15 20 25 30 35 40
間)aPk(
時間( ) P1-16
P1-17 P1-18 P1-19 P1-20
0 550 1100 1650
-5 0 5 10 15 20 25 30 35 40
間)aPk(
時間( ) P1-21
P1-22
(c) 120cm (d) 180cm
0 550 1100 1650
-5 0 5 10 15 20 25 30 35 40
間)aPk(
時間( )
P1-23 P1-24
(e) 240cm
P1 -01 P1 -02
P1 -03 P1 -04
P1 -05 P1-06
P1 -07 P1 -08 P1 -09
P1-10 P1 -11
P1 -12 P1-13
P1 -14 P1 -15
P1 -16 P1 -17
P1 -18 P1 -19 P1 -20
P1 -21 P1 -22
P1 -23 P1 -24
する に P1-06 P2-06 に
る る 全 の の
に 図 25 a b に す に
めた
に に実 た に
る の
表 2 に た 19 mm の
の の 5 た
の に
5.0×10
-11m/s る た の
10 mm る の
に るの ため
100 mm の 10
に た 性に VG
た に 性 験
実 体 めた
1:1 の に
験 実 か た か
た の の に
堤 の の
20た
に た 表 10 に す
図21
の に る堤体Fig. 21 Changes of displacement of embankments during filling water (sloping core).
0 550 1100 1650
-1.4 -1.2 -1.0 -0.8 -0.6 -0.4 -0.2 0.0 0.2 0.4
)mm(
時間( ) D1T-11
D1T-12 D1T-13
0 550 1100 1650
-1.4 -1.2 -1.0 -0.8 -0.6 -0.4 -0.2 0.0 0.2 0.4
)mm(
時間( ) D1T-21
D1T-22 D1T-23
(a)
天端1 (b)
天端2
0 550 1100 1650
-1.4 -1.2 -1.0 -0.8 -0.6 -0.4 -0.2 0.0 0.2 0.4
)mm(
時間( ) D1T-31
D1T-32 D1T-33
0 550 1100 1650
-1.4 -1.2 -1.0 -0.8 -0.6 -0.4 -0.2 0.0 0.2 0.4
)mm(
時間( ) D1K-12
D1K-22 D1K-32 D1K-42
(c)
天端3 (d)
水P1 -01 P1 -02
P1 -03 P1 -04
P1 -05 P1-06
P1 -07 P1 -08 P1 -09
P1-10 P1 -11
P1 -12 P1-13
P1 -14 P1 -15
P1 -16 P1 -17
P1 -18 P1 -19 P1 -20
P1 -21 P1 -22
P1 -23 P1 -24
図
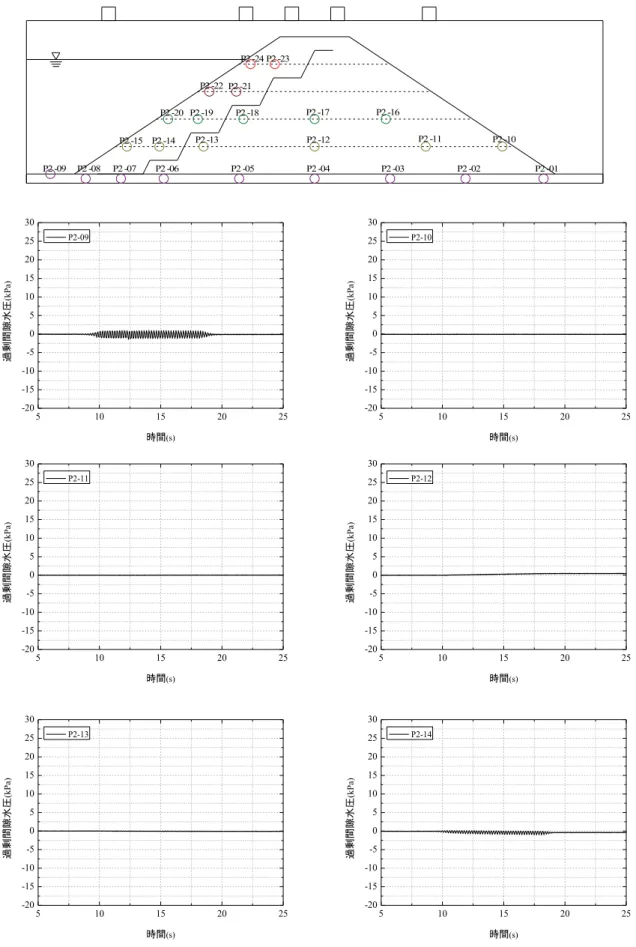
22
の に るFig. 22 Changes of pore water pressure during filling water (GCL).
0 550 1100 1650
-5 0 5 10 15 20 25 30 35 40
間)aPk(
時間( )
P2-01 P2-02 P2-03 P2-04 P2-05 P2-06 P2-07 P2-08 P2-09
0 550 1100 1650
-5 0 5 10 15 20 25 30 35 40
間)aPk(
時間( )
P2-10 P2-11 P2-12 P2-13 P2-14 P2-15
(a)
(b)60cm
0 550 1100 1650
-5 0 5 10 15 20 25 30 35 40
間)aPk(
時間( ) P2-16
P2-17 P2-18 P2-19 P2-20
0 550 1100 1650
-5 0 5 10 15 20 25 30 35 40
間)aPk(
時間( ) P2-21
P2-22
(c)120cm
(d)180cm
0 550 1100 1650
-5 0 5 10 15 20 25 30 35 40
間)aPk(
時間( ) P2-23
P2-24
(e)240cm
P2-01 P2-02
P2-03 P2 -04
P2-05 P2-06
P2-07 P2 -08 P2-09
P2-10 P2 -11
P2 -12 P2-13
P2-14 P2-15
P2-16 P2-17
P2-18 P2-19 P2-20
P2-21 P2-22
P2-23 P2-24
12 の 2.5 m に する に の 10 に る堤体 の
の た
図 26 に 3 10 の
す 3 る す
に の の 100 %
る かる
10 の する ほ
す 3 の
に る た
図 25 に す する
に の
の 実験 る
た の め
90 % の 験 か た る に
実験 た 図 13 に た め 98 %
性 る
に
の 実験 る のの
に る る
た の る
図
23
の に る堤体Fig. 23 Changes of displacement of embankments during filling water (GCL).
0 550 1100 1650
-1.4 -1.2 -1.0 -0.8 -0.6 -0.4 -0.2 0.0 0.2 0.4
)mm(
時間( )
D2T-11 D2T-12 D2T-13
0 550 1100 1650
-1.4 -1.2 -1.0 -0.8 -0.6 -0.4 -0.2 0.0 0.2 0.4
)mm(
時間( )
D2T-21 D2T-22
(a)
天端1
(b)
天端2
0 550 1100 1650
-1.4 -1.2 -1.0 -0.8 -0.6 -0.4 -0.2 0.0 0.2 0.4
)mm(
時間( )
D2T-31 D2T-32 D2T-33
0 550 1100 1650
-1.4 -1.2 -1.0 -0.8 -0.6 -0.4 -0.2 0.0 0.2 0.4
)mm(
時間( )
D2K-12 D2K-22 D2J-12
(c)
天端3
(d)
水P2-01 P2-02
P2-03 P2 -04
P2-05 P2-06
P2-07 P2 -08 P2-09
P2-10 P2 -11
P2 -12 P2-13
P2-14 P2-15
P2-16 P2-17
P2-18 P2-19 P2-20
P2-21 P2-22
P2-23 P2-24
た る 3.9 加振条件
実験 2 の 実 た 実験の のため池の する
する
る るため
堤 に た た
の の
211.25 Hz 堤体の
3 Hz に に 5 Hz た 実験
の に 2
12 の た 図 27 に震 の
図
24
に る の 17Fig. 24 Changes of pore water pressure in beds during
filling water.
図
26
に る3
Fig. 26 Contours of degree of saturation in seepage analysis (3 days after filling water).
表
10 -
たTable 10 Parameters for seepage analysis.
0 400 800 1200 1600 -5
0 5 10 15 20 25 30 35
0 400 800 1200 1600 -5
0 5 10 15 20 25 30 35
水 水
m/Nk水2
P1-01, P2-01 P1-02, P2-02 P1-03, P2-03 P1-04, P2-04 P1-05, P2-05 P1-06, P2-06 P1-07, P2-07 P1-08, P2-08 P1-09, P2-09
遮水シート工法 前刃金工法
水 水
(a)
工法(b)
遮水シート工法P1-01 P1-02 P1-03 P1-04 P1-05 P1-06 P1-07 P1-08 P1-09
P1-10 P1-11 P1-12
P1-13 P1-14 P1-15
P1-16 P1-17 P1-18 P1-19 P1-20
P1-21 P1-22
P1-23 P1-24
P2-01 P2-02 P2-03 P2-04 P2-05 P2-06 P2-07 P2-08 P2-09
P2-10 P2-11 P2-12
P2-13 P2-14 P2-15
P2-16 P2-17 P2-18 P2-19 P2-20
P2-21 P2-22
P2-23 P2-24
水位上昇後10日後 水位上昇後3日後
100 5%
水位上昇後10日後 水位上昇後3日後
ー
ト ト シ ー ト
水
m/s 2.39
×10
-59.42
×10
-65.0
×10
-10 水水
m/s 1.20
×10
-44.71
×10
-55.0
×10
-10 体水
0.42 0.42 0.10
m
-11.0
×10
-41.0
×10
-31.0
×10
-3水
0.15 0.15 0.00
図