101
102
103
104
105
106
主な研究成果物
O R I G I N A L A R T I C L E
Chronic Kidney Disease Japan Cohort study: baseline
characteristics and factors associated with causative diseases and renal function
Enyu Imai• Seiichi Matsuo• Hirofumi Makino• Tsuyoshi Watanabe• Tadao Akizawa•Kosaku Nitta • Satoshi Iimuro•Yasuo Ohashi •Akira Hishida
Received: 23 April 2010 / Accepted: 6 July 2010 / Published online: 11 August 2010 ÓJapanese Society of Nephrology 2010
Abstract
Background Prevalence of chronic kidney disease (CKD) is estimated to be 13.3 million in Japan, but patient char- acteristics during the predialysis period (CKD stages 3–5) are not well studied.
Methods We established the Chronic Kidney Disease Japan Cohort (CKD-JAC) to study the incidence of car- diovascular disease (CVD), end-stage renal disease (ESRD), and all-cause mortality in predialysis patients
treated by nephrologists for 4 years. The inclusion criteria were (1) Japanese and Asian patients living in Japan, (2) age 20–75 years, and (3) estimated glomerular filtration rate (eGFR) 10–59 ml/min/1.73 m2.
Results We analyzed 2977 participants for baseline characteristics. Mean eGFR was 28.6±11.8 ml/min/
1.73 m2, and mean albuminuria was 976±1340 mg/g Cr.
In our study, 91.9% of participants had hypertension, but it was well controlled (131/76 mmHg). Angiotensin con- verting enzyme (ACE) inhibitors and angiotensin receptor blockers (ARBs) were used by most participants. Less than 15% of participants had history of ischemic heart disease, and 11.5% had history of stroke. Heart failure and arte- riosclerosis obliterans were present in 3.9% and 3.6% of patients, respectively. Indicators of arteriosclerosis, higher pulse wave velocity (PWV), and high pulse pressure were associated with diabetes and particularly with diabetic nephropathy. Patients included due to glomerulonephritis seemed to be at low risk for atherosclerosis and also to show lower levels of hypertension.
Conclusions The difference between causative diseases is associated with different comorbidity and level of arterio- sclerosis. Future analysis of the cohort will clarify whether incidence of ESRD and CVD differs among causative diseases.
Keywords CKD DiabetesChronic
glomerulonephritisHypertensionPWVPulse pressure
Introduction
The incidence of end-stage renal disease (ESRD) is on the increase worldwide [1], and Japan is one of the countries with the highest incidence of ESRD. More than 37,000 For The CKD-JAC Study Group.
E. Imai (&)S. Matsuo
Department of Nephrology, Nagoya University Graduate School of Medicine, 65 Tsurumai, Showa-ku, Nagoya 466-8550, Japan e-mail: [email protected]
H. Makino
Department of Medicine and Clinical Science, Okayama University Graduate School of Medicine, Dentistry and Pharmaceutical Sciences, Okayama, Japan
T. Watanabe
The Third Department of Internal Medicine, Fukushima Medical College, Fukushima, Japan
T. Akizawa
Department of Nephrology, Showa University, Tokyo, Japan K. Nitta
Department of Medicine, Kidney Center, Tokyo Women’s Medical University, Tokyo, Japan
S. IimuroY. Ohashi
Department of Biostatistics, School of Public Health, The University of Tokyo, Tokyo, Japan
A. Hishida
First Department of Medicine, Hamamatsu University School of Medicine, Hamamatsu, Japan
123
Clin Exp Nephrol (2010) 14:558–570 DOI 10.1007/s10157-010-0328-6
ESRD patients were introduced to renal replacement ther- apy in 2008 [2]. Diabetes, which has been a leading cause of ESRD during the last 10 years, accounted for 16126 new dialysis patients (43.2%). Glomerulonephritis and nephro- sclerosis were responsible for 8602 (23.0%) and 3936 (10.5%) new dialysis patients, respectively [2]. Prevalence of chronic kidney disease (CKD) is estimated at 13.3 million (13% of adult population) in Japan, with CKD patients at stages 1 to 5 numbering 0.6 million, 1.7 million, 10.7 million, 200 thousand, and 40 thousand, respectively [3]. However, patient characteristics during the predialysis period (CKD stages 3–5) are not well studied because few cohort studies have been conducted.
Cardiovascular disease (CVD) is a major threat for patients with CKD [4]. In population-based studies, the risk of CVD increases in association with decreasing renal function in Western as well as in Asian countries [4,5].
However, few prospective observational studies have been conducted to observe cardiovascular and renal outcomes in CKD population. A cohort of CKD patients treated with a high standard of care by nephrologists is necessary to analyze renal and cardiovascular events precisely.
A body of evidence has shown that arteriosclerosis contributes to high cardiovascular mortality. Increased arterial stiffness has been reported in CKD patients, and these findings have been associated with cardiovascular mortality. Aortic pulse wave velocity (PWV) and pulse pressure (PP) are strong independent predictors of cardio- vascular mortality [6–9].
The Chronic Renal Insufficiency Cohort (CRIC) study [10] was undertaken in the USA to examine the risk factors for progression of CKD with respect to development of CVD among CKD patients, and to develop models for develop- ment of CVD that could identify high-risk subgroups. We saw the need to deal with the same issues in a Japanese cohort, and established the Chronic Kidney Disease Japan Cohort (CKD-JAC) [11]. While the risk of coronary artery disease is lower in the Japanese general population [12], the main aim of the prospective CKD-JAC study is to investi- gate the incidence of CVD, ESRD, and all-cause mortality for 4 years in 3000 CKD patients, defined by GFR 10–59 ml/min/1.73 m2. Analysis by causative diseases and renal function will clearly shed light on the difference in cardiovascular and renal outcomes in CKD patients.
Methods
Inclusion and exclusion criteria
Methods have been described elsewhere [11].
The following inclusion criteria were used at screening:
(1) Japanese and Asian patients living in Japan, (2) age
20–75 years, and (3) a broad spectrum of CKD with esti- mated GFR (eGFR) 10–59 ml/min/1.73 m2. eGFR was calculated by a modified three-variable equation for esti- mating GFR in Japanese patients [13]:
eGFR¼194Age0:287sCr1:094ð0:739 if femaleÞ:
The following patients were excluded from participation: (1) patients with polycystic kidney disease, human immunodeficiency virus (HIV) infection, liver cirrhosis, active cancer or cancer treatment within last 2 years; (2) transplant recipients and patients who have previously received long-term dialysis; and (3) individuals who refused to provide informed consent.
Screening and enrollment
Eligible patients were screened by eGFR as calculated by the Japanese equation for estimating GFR from serum creatinine, shown above. Eligible patients were evaluated at baseline, and sociodemographic information, individual and family history, medication records, anthropometric measurements, blood pressure, heart rate, and ankle- brachial index, were collected.
Blood pressure and PWV measurement
Blood pressure was measured at outpatient clinics by automated sphygmomanometer after 5 min of rest. Blood pressure was measured three times at intervals of 1 min on the right arm. A conventional sphygmomanometer was used when the participant showed frequent premature contraction, atrial fibrillation or atrial flutter. PP was cal- culated by subtracting diastolic blood pressure from sys- tolic blood pressure. PWV was measured at each hospital.
Pressure waveforms of the brachial and tibial arteries were recorded by oscillometry, using occlusion/sensing cuffs adapted to both arms and both ankles.
Definition of hypertension, diabetes, and glomerulonephritis
Definition of hypertension was 140 mmHg or higher in systolic blood pressure and/or 90 mmHg or higher in dia- stolic blood pressure, or taking antihypertensives. Diabetes was defined as A1C 6.5% or higher, or taking antidiabetics.
Glomerulonephritis was defined by biopsy or clinical diagnosis by doctor in charge.
Collection of biological samples and measurements Whole blood, serum, and urine samples were collected for measurement of serum creatinine and serum cystatin C,
Clin Exp Nephrol (2010) 14:558–570 559
123
HbA1c, intact parathyroid hormone (iPTH), urine albumin, and urine creatinine at a central laboratory. HbA1c mea- sured by the Japanese Diabetes Society (JDS) method was corrected to the A1C value measured by the National Glycohemoglobin Standardization Program (NGSP) method by adding 0.4% as determined by JDS. Each clinical center measured serum creatinine at each visit.
Twenty-four-hour urine samples were collected from each patient once every year to measure creatinine clearance.
General methods for statistical analysis
Standard descriptive statistics were used to describe base- line characteristics. Summary statistics such as means, medians, standard deviations, and ranges were calculated for measured variables. One-way analysis of variance was used to compare intergroup values as occasion demanded.
Frequencies were tabulated for categorical and ordinal variables, and internal comparison was made using the chi- squared test.
The two-sided 95% confidence interval was calculated by estimation. The significance level was set at two-sided 5%.
Results
We enrolled outpatients as participants in the CKD-JAC study from April 2007 to December 2008. The number of registered cases was 3087. Sixteen patients were excluded because they met the exclusion criteria, and baseline data abstraction was not completed for an additional 25 patients.
Sixty-nine patients dropped out after registration without completing baseline data abstraction: 59 of those patients withdrew their consent, and an additional 5 patients were excluded by doctors in charge. Four patients were lost to follow-up because they did not return to the hospital, and 1 patient died. After deleting these patients from the registry, a total of 2977 cases were analyzed for baseline characteristics.
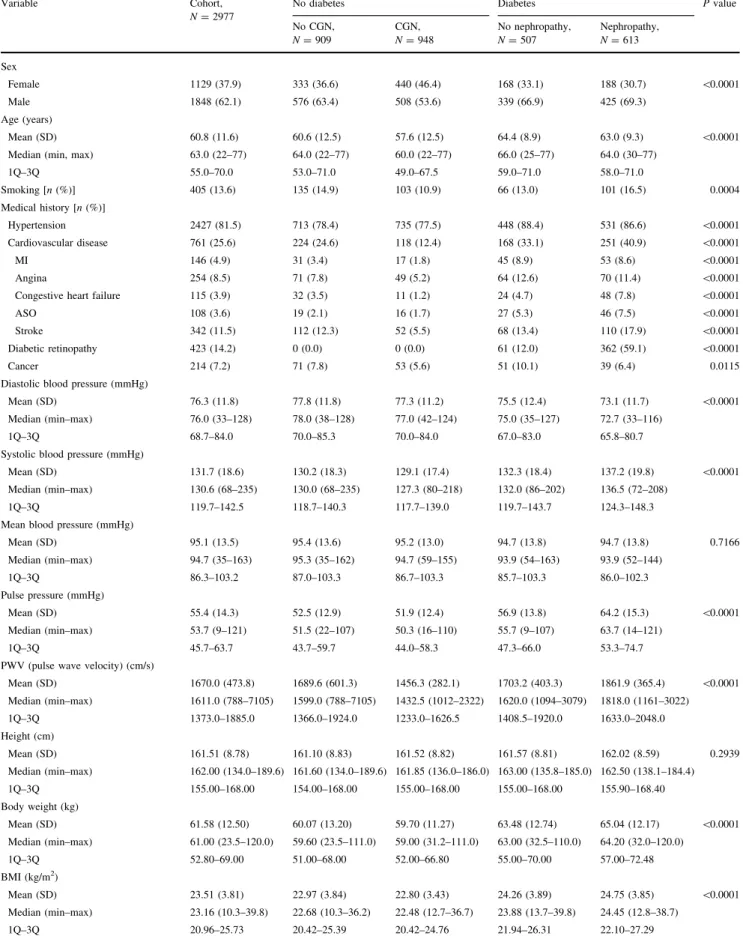
Baseline demographics and clinical characteristics of participants (Table1)
The final enrolled cohort consisted of 1848 Japanese males (62.1%) and 1129 Japanese females (37.9%). Age [mean±standard deviation (SD)] was 60.8±11.6 years.
Of these participants, 1120 (37.6%) had diabetes, and 613 (20.6%) of that group were diagnosed with diabetic nephropathy, among whom 57 cases (9.3%) were biopsy- proven diabetic nephropathy. Of 691 diabetic patients who did not have diabetic nephropathy, 190 cases (27.5%) were diagnosed as having primary glomerulonephritis by biopsy.
Diagnosis of primary glomerulonephritis without diabetes was reached for 948 patients (31.9%), of whom 601 (63.4%) had biopsy-proven glomerulonephritis. Of patients diag- nosed as nondiabetes and nonprimary glomerulonephritis, 177 cases (19.7%) were diagnosed by renal biopsy.
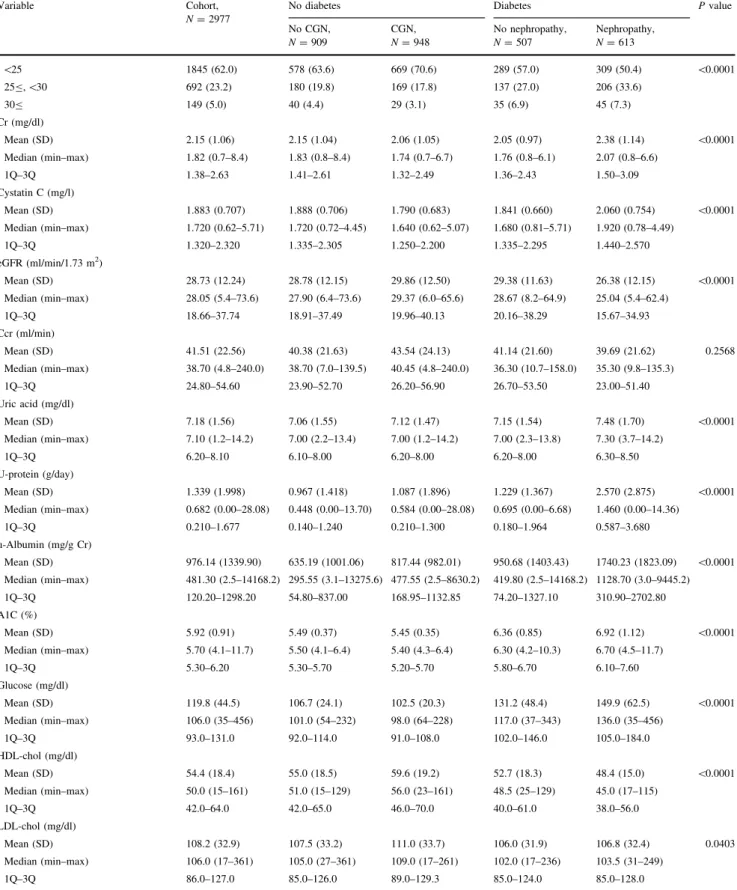
Mean BMI was 23.5±3.8 kg/m2. Mean serum creati- nine was 2.15±1.06 mg/dl, and mean eGFR was 28.7± 12.2 ml/min/1.73 m2. Mean cystatin C was 1.88±0.71 mg/l. Mean albuminuria was 976±1340 mg/g Cr.
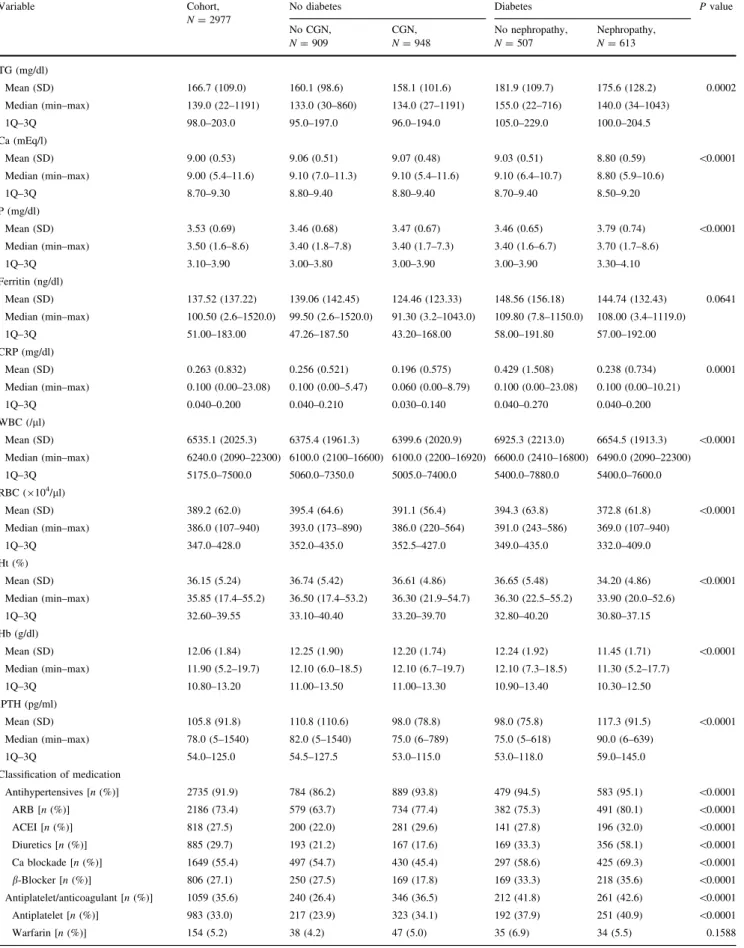
Most participants had hypertension (91.9%) and were under treatment with antihypertensives. Mean blood pressure in participants was 131.7 (18.6)±76.3 (11.8) mmHg. ACEIs/ARBs were used by most participants.
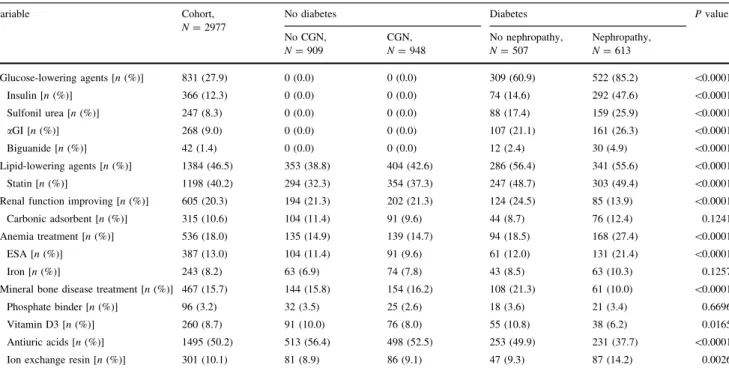
However, ARBs were used more frequently (73.4%) than ACEIs (27.5%). b-Blockers and diuretics were used by 27.1% and 29.7% of participants, respectively. Ca channel blockers were used by 55.4% of patients. Of patients, 1384 were being treated for dyslipidemia with lipid- lowering agents.
Less than 15% of participants had history of ischemic heart disease, and 11.5% had history of stroke. Heart fail- ure and arteriosclerosis obliterans were present in 3.9% and 3.6% of patients, respectively. Current smokers accounted for 16.4% of all participants. Presence of diabetic nephropathy significantly changed patient characteristics.
Patients with nephropathy had lower eGFR and more advanced anemia than those without nephropathy.
Patients with CKD due to glomerulonephritis were younger and less likely to have hypertension or cardio- vascular comorbidity.
PWV and PP values were lowest in patients with CKD caused by glomerulonephritis (Tables 2, 3). Association with higher PWV and large PP was greatest in patients with diabetic nephropathy, followed by diabetes mellitus (DM) without nephropathy, and the lowest level of association was seen in non-DM patients.
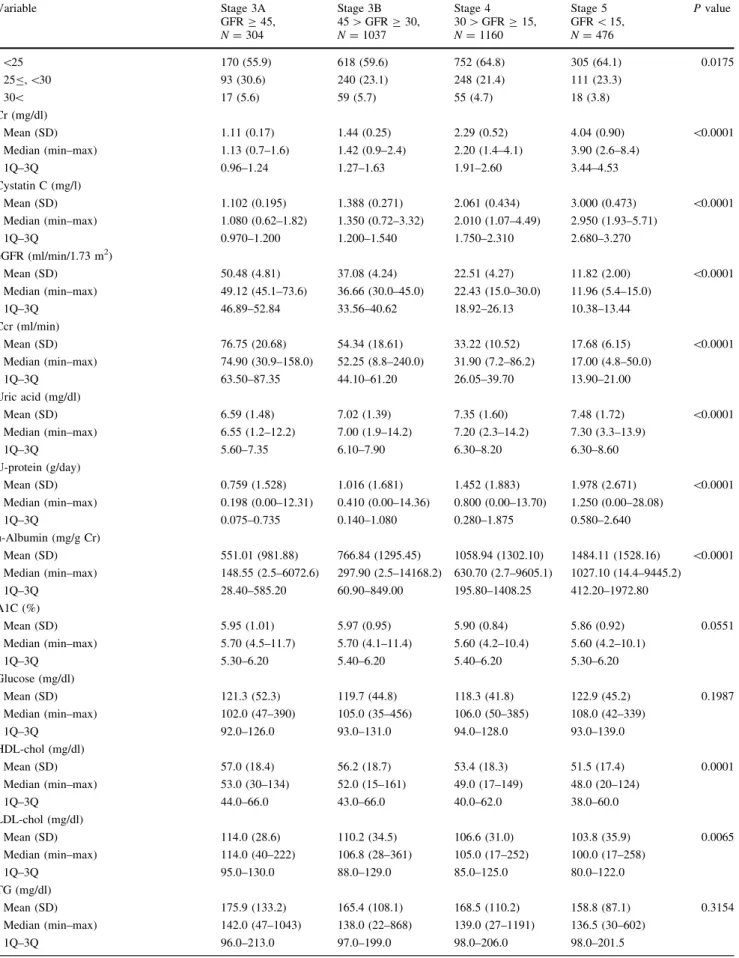
Baseline characteristics by eGFR level (Table4)
The numbers of participants with eGFRC45, 45[eGFRC 30, 30[eGFRC 15, and\15 ml/min/1.73 m2were 304, 1037, 1160, and 476, respectively. Systolic and mean blood pressures increased in association with decreasing eGFR, but diastolic blood pressure was not significantly different.
Proteinuria increased in proportion to declining eGFR. Both low-density lipoprotein (LDL) and high-density lipoprotein (HDL) cholesterol decreased with declining eGFR. There was also a decrease in triglycerides, but it was not statisti- cally significant. Serum calcium decreased and serum phosphate increased in proportion to decreased eGFR, which was associated with increased parathyroid hormone.
Comorbidity of cardiovascular diseases was more pre- valent in proportion to declining eGFR.
560 Clin Exp Nephrol (2010) 14:558–570
123
Table 1 Patient characteristics classified by causative disease
Variable Cohort,
N=2977
No diabetes Diabetes Pvalue
No CGN, N=909
CGN, N=948
No nephropathy, N=507
Nephropathy, N=613 Sex
Female 1129 (37.9) 333 (36.6) 440 (46.4) 168 (33.1) 188 (30.7) \0.0001
Male 1848 (62.1) 576 (63.4) 508 (53.6) 339 (66.9) 425 (69.3)
Age (years)
Mean (SD) 60.8 (11.6) 60.6 (12.5) 57.6 (12.5) 64.4 (8.9) 63.0 (9.3) \0.0001
Median (min, max) 63.0 (22–77) 64.0 (22–77) 60.0 (22–77) 66.0 (25–77) 64.0 (30–77)
1Q–3Q 55.0–70.0 53.0–71.0 49.0–67.5 59.0–71.0 58.0–71.0
Smoking [n(%)] 405 (13.6) 135 (14.9) 103 (10.9) 66 (13.0) 101 (16.5) 0.0004
Medical history [n(%)]
Hypertension 2427 (81.5) 713 (78.4) 735 (77.5) 448 (88.4) 531 (86.6) \0.0001
Cardiovascular disease 761 (25.6) 224 (24.6) 118 (12.4) 168 (33.1) 251 (40.9) \0.0001
MI 146 (4.9) 31 (3.4) 17 (1.8) 45 (8.9) 53 (8.6) \0.0001
Angina 254 (8.5) 71 (7.8) 49 (5.2) 64 (12.6) 70 (11.4) \0.0001
Congestive heart failure 115 (3.9) 32 (3.5) 11 (1.2) 24 (4.7) 48 (7.8) \0.0001
ASO 108 (3.6) 19 (2.1) 16 (1.7) 27 (5.3) 46 (7.5) \0.0001
Stroke 342 (11.5) 112 (12.3) 52 (5.5) 68 (13.4) 110 (17.9) \0.0001
Diabetic retinopathy 423 (14.2) 0 (0.0) 0 (0.0) 61 (12.0) 362 (59.1) \0.0001
Cancer 214 (7.2) 71 (7.8) 53 (5.6) 51 (10.1) 39 (6.4) 0.0115
Diastolic blood pressure (mmHg)
Mean (SD) 76.3 (11.8) 77.8 (11.8) 77.3 (11.2) 75.5 (12.4) 73.1 (11.7) \0.0001
Median (min–max) 76.0 (33–128) 78.0 (38–128) 77.0 (42–124) 75.0 (35–127) 72.7 (33–116)
1Q–3Q 68.7–84.0 70.0–85.3 70.0–84.0 67.0–83.0 65.8–80.7
Systolic blood pressure (mmHg)
Mean (SD) 131.7 (18.6) 130.2 (18.3) 129.1 (17.4) 132.3 (18.4) 137.2 (19.8) \0.0001
Median (min–max) 130.6 (68–235) 130.0 (68–235) 127.3 (80–218) 132.0 (86–202) 136.5 (72–208)
1Q–3Q 119.7–142.5 118.7–140.3 117.7–139.0 119.7–143.7 124.3–148.3
Mean blood pressure (mmHg)
Mean (SD) 95.1 (13.5) 95.4 (13.6) 95.2 (13.0) 94.7 (13.8) 94.7 (13.8) 0.7166
Median (min–max) 94.7 (35–163) 95.3 (35–162) 94.7 (59–155) 93.9 (54–163) 93.9 (52–144)
1Q–3Q 86.3–103.2 87.0–103.3 86.7–103.3 85.7–103.3 86.0–102.3
Pulse pressure (mmHg)
Mean (SD) 55.4 (14.3) 52.5 (12.9) 51.9 (12.4) 56.9 (13.8) 64.2 (15.3) \0.0001
Median (min–max) 53.7 (9–121) 51.5 (22–107) 50.3 (16–110) 55.7 (9–107) 63.7 (14–121)
1Q–3Q 45.7–63.7 43.7–59.7 44.0–58.3 47.3–66.0 53.3–74.7
PWV (pulse wave velocity) (cm/s)
Mean (SD) 1670.0 (473.8) 1689.6 (601.3) 1456.3 (282.1) 1703.2 (403.3) 1861.9 (365.4) \0.0001
Median (min–max) 1611.0 (788–7105) 1599.0 (788–7105) 1432.5 (1012–2322) 1620.0 (1094–3079) 1818.0 (1161–3022)
1Q–3Q 1373.0–1885.0 1366.0–1924.0 1233.0–1626.5 1408.5–1920.0 1633.0–2048.0
Height (cm)
Mean (SD) 161.51 (8.78) 161.10 (8.83) 161.52 (8.82) 161.57 (8.81) 162.02 (8.59) 0.2939
Median (min–max) 162.00 (134.0–189.6) 161.60 (134.0–189.6) 161.85 (136.0–186.0) 163.00 (135.8–185.0) 162.50 (138.1–184.4)
1Q–3Q 155.00–168.00 154.00–168.00 155.00–168.00 155.00–168.00 155.90–168.40
Body weight (kg)
Mean (SD) 61.58 (12.50) 60.07 (13.20) 59.70 (11.27) 63.48 (12.74) 65.04 (12.17) \0.0001
Median (min–max) 61.00 (23.5–120.0) 59.60 (23.5–111.0) 59.00 (31.2–111.0) 63.00 (32.5–110.0) 64.20 (32.0–120.0)
1Q–3Q 52.80–69.00 51.00–68.00 52.00–66.80 55.00–70.00 57.00–72.48
BMI (kg/m2)
Mean (SD) 23.51 (3.81) 22.97 (3.84) 22.80 (3.43) 24.26 (3.89) 24.75 (3.85) \0.0001
Median (min–max) 23.16 (10.3–39.8) 22.68 (10.3–36.2) 22.48 (12.7–36.7) 23.88 (13.7–39.8) 24.45 (12.8–38.7)
1Q–3Q 20.96–25.73 20.42–25.39 20.42–24.76 21.94–26.31 22.10–27.29
Clin Exp Nephrol (2010) 14:558–570 561
123
Table 1continued
Variable Cohort,
N=2977
No diabetes Diabetes Pvalue
No CGN, N=909
CGN, N=948
No nephropathy, N=507
Nephropathy, N=613
\25 1845 (62.0) 578 (63.6) 669 (70.6) 289 (57.0) 309 (50.4) \0.0001
25B,\30 692 (23.2) 180 (19.8) 169 (17.8) 137 (27.0) 206 (33.6)
30B 149 (5.0) 40 (4.4) 29 (3.1) 35 (6.9) 45 (7.3)
Cr (mg/dl)
Mean (SD) 2.15 (1.06) 2.15 (1.04) 2.06 (1.05) 2.05 (0.97) 2.38 (1.14) \0.0001
Median (min–max) 1.82 (0.7–8.4) 1.83 (0.8–8.4) 1.74 (0.7–6.7) 1.76 (0.8–6.1) 2.07 (0.8–6.6)
1Q–3Q 1.38–2.63 1.41–2.61 1.32–2.49 1.36–2.43 1.50–3.09
Cystatin C (mg/l)
Mean (SD) 1.883 (0.707) 1.888 (0.706) 1.790 (0.683) 1.841 (0.660) 2.060 (0.754) \0.0001
Median (min–max) 1.720 (0.62–5.71) 1.720 (0.72–4.45) 1.640 (0.62–5.07) 1.680 (0.81–5.71) 1.920 (0.78–4.49)
1Q–3Q 1.320–2.320 1.335–2.305 1.250–2.200 1.335–2.295 1.440–2.570
eGFR (ml/min/1.73 m2)
Mean (SD) 28.73 (12.24) 28.78 (12.15) 29.86 (12.50) 29.38 (11.63) 26.38 (12.15) \0.0001
Median (min–max) 28.05 (5.4–73.6) 27.90 (6.4–73.6) 29.37 (6.0–65.6) 28.67 (8.2–64.9) 25.04 (5.4–62.4)
1Q–3Q 18.66–37.74 18.91–37.49 19.96–40.13 20.16–38.29 15.67–34.93
Ccr (ml/min)
Mean (SD) 41.51 (22.56) 40.38 (21.63) 43.54 (24.13) 41.14 (21.60) 39.69 (21.62) 0.2568
Median (min–max) 38.70 (4.8–240.0) 38.70 (7.0–139.5) 40.45 (4.8–240.0) 36.30 (10.7–158.0) 35.30 (9.8–135.3)
1Q–3Q 24.80–54.60 23.90–52.70 26.20–56.90 26.70–53.50 23.00–51.40
Uric acid (mg/dl)
Mean (SD) 7.18 (1.56) 7.06 (1.55) 7.12 (1.47) 7.15 (1.54) 7.48 (1.70) \0.0001
Median (min–max) 7.10 (1.2–14.2) 7.00 (2.2–13.4) 7.00 (1.2–14.2) 7.00 (2.3–13.8) 7.30 (3.7–14.2)
1Q–3Q 6.20–8.10 6.10–8.00 6.20–8.00 6.20–8.00 6.30–8.50
U-protein (g/day)
Mean (SD) 1.339 (1.998) 0.967 (1.418) 1.087 (1.896) 1.229 (1.367) 2.570 (2.875) \0.0001
Median (min–max) 0.682 (0.00–28.08) 0.448 (0.00–13.70) 0.584 (0.00–28.08) 0.695 (0.00–6.68) 1.460 (0.00–14.36)
1Q–3Q 0.210–1.677 0.140–1.240 0.210–1.300 0.180–1.964 0.587–3.680
u-Albumin (mg/g Cr)
Mean (SD) 976.14 (1339.90) 635.19 (1001.06) 817.44 (982.01) 950.68 (1403.43) 1740.23 (1823.09) \0.0001 Median (min–max) 481.30 (2.5–14168.2) 295.55 (3.1–13275.6) 477.55 (2.5–8630.2) 419.80 (2.5–14168.2) 1128.70 (3.0–9445.2)
1Q–3Q 120.20–1298.20 54.80–837.00 168.95–1132.85 74.20–1327.10 310.90–2702.80
A1C (%)
Mean (SD) 5.92 (0.91) 5.49 (0.37) 5.45 (0.35) 6.36 (0.85) 6.92 (1.12) \0.0001
Median (min–max) 5.70 (4.1–11.7) 5.50 (4.1–6.4) 5.40 (4.3–6.4) 6.30 (4.2–10.3) 6.70 (4.5–11.7)
1Q–3Q 5.30–6.20 5.30–5.70 5.20–5.70 5.80–6.70 6.10–7.60
Glucose (mg/dl)
Mean (SD) 119.8 (44.5) 106.7 (24.1) 102.5 (20.3) 131.2 (48.4) 149.9 (62.5) \0.0001
Median (min–max) 106.0 (35–456) 101.0 (54–232) 98.0 (64–228) 117.0 (37–343) 136.0 (35–456)
1Q–3Q 93.0–131.0 92.0–114.0 91.0–108.0 102.0–146.0 105.0–184.0
HDL-chol (mg/dl)
Mean (SD) 54.4 (18.4) 55.0 (18.5) 59.6 (19.2) 52.7 (18.3) 48.4 (15.0) \0.0001
Median (min–max) 50.0 (15–161) 51.0 (15–129) 56.0 (23–161) 48.5 (25–129) 45.0 (17–115)
1Q–3Q 42.0–64.0 42.0–65.0 46.0–70.0 40.0–61.0 38.0–56.0
LDL-chol (mg/dl)
Mean (SD) 108.2 (32.9) 107.5 (33.2) 111.0 (33.7) 106.0 (31.9) 106.8 (32.4) 0.0403
Median (min–max) 106.0 (17–361) 105.0 (27–361) 109.0 (17–261) 102.0 (17–236) 103.5 (31–249)
1Q–3Q 86.0–127.0 85.0–126.0 89.0–129.3 85.0–124.0 85.0–128.0
562 Clin Exp Nephrol (2010) 14:558–570
123
Table 1continued
Variable Cohort,
N=2977
No diabetes Diabetes Pvalue
No CGN, N=909
CGN, N=948
No nephropathy, N=507
Nephropathy, N=613 TG (mg/dl)
Mean (SD) 166.7 (109.0) 160.1 (98.6) 158.1 (101.6) 181.9 (109.7) 175.6 (128.2) 0.0002
Median (min–max) 139.0 (22–1191) 133.0 (30–860) 134.0 (27–1191) 155.0 (22–716) 140.0 (34–1043)
1Q–3Q 98.0–203.0 95.0–197.0 96.0–194.0 105.0–229.0 100.0–204.5
Ca (mEq/l)
Mean (SD) 9.00 (0.53) 9.06 (0.51) 9.07 (0.48) 9.03 (0.51) 8.80 (0.59) \0.0001
Median (min–max) 9.00 (5.4–11.6) 9.10 (7.0–11.3) 9.10 (5.4–11.6) 9.10 (6.4–10.7) 8.80 (5.9–10.6)
1Q–3Q 8.70–9.30 8.80–9.40 8.80–9.40 8.70–9.40 8.50–9.20
P (mg/dl)
Mean (SD) 3.53 (0.69) 3.46 (0.68) 3.47 (0.67) 3.46 (0.65) 3.79 (0.74) \0.0001
Median (min–max) 3.50 (1.6–8.6) 3.40 (1.8–7.8) 3.40 (1.7–7.3) 3.40 (1.6–6.7) 3.70 (1.7–8.6)
1Q–3Q 3.10–3.90 3.00–3.80 3.00–3.90 3.00–3.90 3.30–4.10
Ferritin (ng/dl)
Mean (SD) 137.52 (137.22) 139.06 (142.45) 124.46 (123.33) 148.56 (156.18) 144.74 (132.43) 0.0641
Median (min–max) 100.50 (2.6–1520.0) 99.50 (2.6–1520.0) 91.30 (3.2–1043.0) 109.80 (7.8–1150.0) 108.00 (3.4–1119.0)
1Q–3Q 51.00–183.00 47.26–187.50 43.20–168.00 58.00–191.80 57.00–192.00
CRP (mg/dl)
Mean (SD) 0.263 (0.832) 0.256 (0.521) 0.196 (0.575) 0.429 (1.508) 0.238 (0.734) 0.0001
Median (min–max) 0.100 (0.00–23.08) 0.100 (0.00–5.47) 0.060 (0.00–8.79) 0.100 (0.00–23.08) 0.100 (0.00–10.21)
1Q–3Q 0.040–0.200 0.040–0.210 0.030–0.140 0.040–0.270 0.040–0.200
WBC (/ll)
Mean (SD) 6535.1 (2025.3) 6375.4 (1961.3) 6399.6 (2020.9) 6925.3 (2213.0) 6654.5 (1913.3) \0.0001
Median (min–max) 6240.0 (2090–22300) 6100.0 (2100–16600) 6100.0 (2200–16920) 6600.0 (2410–16800) 6490.0 (2090–22300)
1Q–3Q 5175.0–7500.0 5060.0–7350.0 5005.0–7400.0 5400.0–7880.0 5400.0–7600.0
RBC (9104/ll)
Mean (SD) 389.2 (62.0) 395.4 (64.6) 391.1 (56.4) 394.3 (63.8) 372.8 (61.8) \0.0001
Median (min–max) 386.0 (107–940) 393.0 (173–890) 386.0 (220–564) 391.0 (243–586) 369.0 (107–940)
1Q–3Q 347.0–428.0 352.0–435.0 352.5–427.0 349.0–435.0 332.0–409.0
Ht (%)
Mean (SD) 36.15 (5.24) 36.74 (5.42) 36.61 (4.86) 36.65 (5.48) 34.20 (4.86) \0.0001
Median (min–max) 35.85 (17.4–55.2) 36.50 (17.4–53.2) 36.30 (21.9–54.7) 36.30 (22.5–55.2) 33.90 (20.0–52.6)
1Q–3Q 32.60–39.55 33.10–40.40 33.20–39.70 32.80–40.20 30.80–37.15
Hb (g/dl)
Mean (SD) 12.06 (1.84) 12.25 (1.90) 12.20 (1.74) 12.24 (1.92) 11.45 (1.71) \0.0001
Median (min–max) 11.90 (5.2–19.7) 12.10 (6.0–18.5) 12.10 (6.7–19.7) 12.10 (7.3–18.5) 11.30 (5.2–17.7)
1Q–3Q 10.80–13.20 11.00–13.50 11.00–13.30 10.90–13.40 10.30–12.50
iPTH (pg/ml)
Mean (SD) 105.8 (91.8) 110.8 (110.6) 98.0 (78.8) 98.0 (75.8) 117.3 (91.5) \0.0001
Median (min–max) 78.0 (5–1540) 82.0 (5–1540) 75.0 (6–789) 75.0 (5–618) 90.0 (6–639)
1Q–3Q 54.0–125.0 54.5–127.5 53.0–115.0 53.0–118.0 59.0–145.0
Classification of medication
Antihypertensives [n(%)] 2735 (91.9) 784 (86.2) 889 (93.8) 479 (94.5) 583 (95.1) \0.0001
ARB [n(%)] 2186 (73.4) 579 (63.7) 734 (77.4) 382 (75.3) 491 (80.1) \0.0001
ACEI [n(%)] 818 (27.5) 200 (22.0) 281 (29.6) 141 (27.8) 196 (32.0) \0.0001
Diuretics [n(%)] 885 (29.7) 193 (21.2) 167 (17.6) 169 (33.3) 356 (58.1) \0.0001
Ca blockade [n(%)] 1649 (55.4) 497 (54.7) 430 (45.4) 297 (58.6) 425 (69.3) \0.0001
b-Blocker [n(%)] 806 (27.1) 250 (27.5) 169 (17.8) 169 (33.3) 218 (35.6) \0.0001
Antiplatelet/anticoagulant [n(%)] 1059 (35.6) 240 (26.4) 346 (36.5) 212 (41.8) 261 (42.6) \0.0001
Antiplatelet [n(%)] 983 (33.0) 217 (23.9) 323 (34.1) 192 (37.9) 251 (40.9) \0.0001
Warfarin [n(%)] 154 (5.2) 38 (4.2) 47 (5.0) 35 (6.9) 34 (5.5) 0.1588
Clin Exp Nephrol (2010) 14:558–570 563
123
Table 1continued
Variable Cohort,
N=2977
No diabetes Diabetes Pvalue
No CGN, N=909
CGN, N=948
No nephropathy, N=507
Nephropathy, N=613
Glucose-lowering agents [n(%)] 831 (27.9) 0 (0.0) 0 (0.0) 309 (60.9) 522 (85.2) \0.0001
Insulin [n(%)] 366 (12.3) 0 (0.0) 0 (0.0) 74 (14.6) 292 (47.6) \0.0001
Sulfonil urea [n(%)] 247 (8.3) 0 (0.0) 0 (0.0) 88 (17.4) 159 (25.9) \0.0001
aGI [n(%)] 268 (9.0) 0 (0.0) 0 (0.0) 107 (21.1) 161 (26.3) \0.0001
Biguanide [n(%)] 42 (1.4) 0 (0.0) 0 (0.0) 12 (2.4) 30 (4.9) \0.0001
Lipid-lowering agents [n(%)] 1384 (46.5) 353 (38.8) 404 (42.6) 286 (56.4) 341 (55.6) \0.0001
Statin [n(%)] 1198 (40.2) 294 (32.3) 354 (37.3) 247 (48.7) 303 (49.4) \0.0001
Renal function improving [n(%)] 605 (20.3) 194 (21.3) 202 (21.3) 124 (24.5) 85 (13.9) \0.0001
Carbonic adsorbent [n(%)] 315 (10.6) 104 (11.4) 91 (9.6) 44 (8.7) 76 (12.4) 0.1241
Anemia treatment [n(%)] 536 (18.0) 135 (14.9) 139 (14.7) 94 (18.5) 168 (27.4) \0.0001
ESA [n(%)] 387 (13.0) 104 (11.4) 91 (9.6) 61 (12.0) 131 (21.4) \0.0001
Iron [n(%)] 243 (8.2) 63 (6.9) 74 (7.8) 43 (8.5) 63 (10.3) 0.1257
Mineral bone disease treatment [n(%)] 467 (15.7) 144 (15.8) 154 (16.2) 108 (21.3) 61 (10.0) \0.0001
Phosphate binder [n(%)] 96 (3.2) 32 (3.5) 25 (2.6) 18 (3.6) 21 (3.4) 0.6696
Vitamin D3 [n(%)] 260 (8.7) 91 (10.0) 76 (8.0) 55 (10.8) 38 (6.2) 0.0165
Antiuric acids [n(%)] 1495 (50.2) 513 (56.4) 498 (52.5) 253 (49.9) 231 (37.7) \0.0001
Ion exchange resin [n(%)] 301 (10.1) 81 (8.9) 86 (9.1) 47 (9.3) 87 (14.2) 0.0026
Cardiovascular diseases means participant had medical history of myocardial infarction, angina, congestive heart failure, arteriosclerosis obliterans or stroke MImyocardial infarction,ASOarteriosclerosis obliterans,BMIbody mass index,ARBangiotensin receptor blocker,ACEIangiotensin converting enzyme inhibitor,aGI a-glucosidase inhibitor,CGNchronic glomerulonephritis,CRPC-reactive protein,ESAerythrocyte stimulating agents,LDLlow-density lipoprotein,HDLhigh-density lipoprotein,RBCred blood cells,TGtriglyceride,WBCwhite blood cells
Table 2 Distribution of PWV in the cohort
PWV (cm/s) Sex Age (years) n Mean SD
Cohort Female \65 82 1449.2 277.0
C65 55 1801.5 380.8
Male \65 139 1518.7 296.6
C65 120 1935.8 620.8
No DM
No CGN Female \65 30 1449.9 295.8
C65 15 1852.0 413.6
Male \65 43 1530.6 357.1
C65 53 1908.4 815.5
CGN Female \65 32 1372.0 246.3
C65 16 1692.3 310.1
Male \65 46 1372.3 198.1
C65 10 1734.2 315.2
DM
No nephropathy Female \65 7 1512.0 204.9
C65 12 1754.9 374.9
Male \65 21 1537.6 271.1
C65 20 1913.1 491.2
Nephropathy Female \65 13 1603.6 291.1
C65 12 1930.4 425.5
Male \65 29 1719.8 221.4
C65 37 2041.8 370.1
Table 3 Distribution of pulse pressure in the cohort
Pulse pressure (mmHg) Sex Age (years) n Mean SD
Cohort Female \65 655 51.1 13.2
C65 455 60.3 14.6
Male \65 944 52.8 13.0
C65 877 59.0 14.5 No DM
No CGN Female \65 183 48.3 11.9
C65 141 58.7 14.0
Male \65 273 49.1 11.9
C65 288 55.3 12.1
CGN Female \65 300 49.2 11.5
C65 137 56.5 12.8
Male \65 313 49.9 10.3
C65 191 56.1 14.5 DM
No nephropathy Female \65 79 53.5 13.4
C65 87 60.4 13.9
Male \65 138 53.4 11.8
C65 197 59.1 14.4
Nephropathy Female \65 93 60.8 15.6
C65 90 68.6 15.8
Male \65 220 61.1 14.7
C65 201 67.0 14.7
564 Clin Exp Nephrol (2010) 14:558–570
123
Table 4 Baseline characterization
Variable Stage 3A Stage 3B Stage 4 Stage 5 Pvalue
GFRC45, N=304
45[GFRC30, N=1037
30[GFRC15, N=1160
GFR\15, N=476 Sex
Female 113 (37.2) 367 (35.4) 445 (38.4) 204 (42.9) 0.0478
Male 191 (62.8) 670 (64.6) 715 (61.6) 272 (57.1)
Age (years)
Mean (SD) 55.0 (13.3) 60.4 (12.0) 61.9 (10.6) 62.5 (10.7) \0.0001
Median (min–max) 58.0 (22–76) 63.0 (22–77) 64.0 (24–77) 65.0 (25–77)
1Q–3Q 45.0–66.0 54.0–70.0 56.0–70.0 57.0–71.0
Smoking [n(%)] 44 (14.5) 150 (14.5) 144 (12.4) 67 (14.1) 0.4646
Medical history [n(%)]
Hypertension 225 (74.0) 816 (78.7) 966 (83.3) 420 (88.2) \0.0001
Cardiovascular disease 55 (18.1) 248 (23.9) 307 (26.5) 151 (31.7) 0.0001
MI 9 (3.0) 47 (4.5) 62 (5.3) 28 (5.9) 0.2377
Angina 20 (6.6) 85 (8.2) 100 (8.6) 49 (10.3) 0.3155
Congestive heart failure 4 (1.3) 35 (3.4) 46 (4.0) 30 (6.3) 0.0034
ASO 11 (3.6) 32 (3.1) 48 (4.1) 17 (3.6) 0.6284
Stroke 31 (10.2) 114 (11.0) 132 (11.4) 65 (13.7) 0.3978
Diabetic retinopathy 29 (9.5) 128 (12.3) 171 (14.7) 95 (20.0) \0.0001
Cancer 21 (6.9) 75 (7.2) 88 (7.6) 30 (6.3) 0.8317
Diastolic blood pressure (mmHg)
Mean (SD) 76.2 (11.3) 76.5 (11.4) 76.0 (12.2) 76.3 (12.3) 0.6793
Median (min–max) 76.2 (47–107) 76.3 (38–118) 76.0 (33–128) 76.8 (34–127)
1Q–3Q 69.7–82.3 69.0–84.0 68.0–84.0 70.0–84.0
Systolic blood pressure (mmHg)
Mean (SD) 128.9 (17.3) 130.0 (17.8) 132.2 (19.1) 135.8 (19.1) \0.0001
Median (min–max) 128.0 (80–185) 129.3 (72–202) 132.0 (68–235) 133.0 (90–202)
1Q–3Q 117.0–140.0 118.7–140.0 120.0–143.7 123.0–148.7
Mean blood pressure (mmHg)
Mean (SD) 94.1 (12.6) 94.6 (12.9) 95.3 (13.9) 96.5 (14.1) 0.0448
Median (min–max) 93.4 (60–128) 94.0 (53–147) 94.7 (35–162) 95.6 (54–163)
1Q–3Q 85.5–102.7 86.2–102.1 86.3–103.3 87.6–104.7
Pulse pressure (mmHg)
Mean (SD) 52.7 (13.1) 53.6 (13.8) 56.1 (14.5) 59.4 (14.2) \0.0001
Median (min–max) 51.0 (23–107) 51.7 (9–112) 54.3 (24–121) 58.0 (23–107)
1Q–3Q 43.7–60.0 44.0–61.0 46.0–64.3 50.0–68.0
PWV (pulse wave velocity) (cm/s)
Mean (SD) 1463.2 (383.5) 1647.6 (389.3) 1728.5 (577.9) 1767.8 (332.7) 0.2021
Median (min–max) 1367.5 (1025–2316) 1545.0 (925–3079) 1697.0 (788–7105) 1740.0 (1088–2738)
1Q–3Q 1163.0–1554.0 1370.0–1875.0 1398.0–1917.0 1551.0–1945.0
Height (cm)
Mean (SD) 163.24 (8.85) 162.33 (8.66) 160.80 (8.70) 160.36 (8.85) \0.0001
Median (min–max) 163.00 (135.8–189.6) 163.00 (134.0–188.0) 161.00 (138.0–185.0) 161.00 (137.5–184.4)
1Q–3Q 157.00–170.00 156.00–169.00 154.30–167.30 153.00–167.20
Body weight (kg)
Mean (SD) 65.04 (12.19) 62.46 (12.65) 60.54 (12.38) 60.03 (12.14) 0.0002
Median (min–max) 64.50 (36.0–110.9) 61.60 (28.6–120.0) 60.00 (23.5–107.0) 60.00 (31.2–99.8)
1Q–3Q 56.00–72.00 53.00–70.00 51.95–68.00 51.30–68.00
BMI (kg/m2)
Mean (SD) 24.30 (3.56) 23.68 (3.88) 23.28 (3.80) 23.19 (3.76) 0.0294
Median (min–max) 24.15 (13.7–39.8) 23.18 (12.1–38.7) 23.01 (10.3–36.3) 22.88 (12.7–36.3)
1Q–3Q 22.04–26.44 20.98–25.78 20.83–25.49 20.67–25.66
Clin Exp Nephrol (2010) 14:558–570 565
123
Table 4continued
Variable Stage 3A Stage 3B Stage 4 Stage 5 Pvalue
GFRC45, N=304
45[GFRC30, N=1037
30[GFRC15, N=1160
GFR\15, N=476
\25 170 (55.9) 618 (59.6) 752 (64.8) 305 (64.1) 0.0175
25B,\30 93 (30.6) 240 (23.1) 248 (21.4) 111 (23.3)
30\ 17 (5.6) 59 (5.7) 55 (4.7) 18 (3.8)
Cr (mg/dl)
Mean (SD) 1.11 (0.17) 1.44 (0.25) 2.29 (0.52) 4.04 (0.90) \0.0001
Median (min–max) 1.13 (0.7–1.6) 1.42 (0.9–2.4) 2.20 (1.4–4.1) 3.90 (2.6–8.4)
1Q–3Q 0.96–1.24 1.27–1.63 1.91–2.60 3.44–4.53
Cystatin C (mg/l)
Mean (SD) 1.102 (0.195) 1.388 (0.271) 2.061 (0.434) 3.000 (0.473) \0.0001
Median (min–max) 1.080 (0.62–1.82) 1.350 (0.72–3.32) 2.010 (1.07–4.49) 2.950 (1.93–5.71)
1Q–3Q 0.970–1.200 1.200–1.540 1.750–2.310 2.680–3.270
eGFR (ml/min/1.73 m2)
Mean (SD) 50.48 (4.81) 37.08 (4.24) 22.51 (4.27) 11.82 (2.00) \0.0001
Median (min–max) 49.12 (45.1–73.6) 36.66 (30.0–45.0) 22.43 (15.0–30.0) 11.96 (5.4–15.0)
1Q–3Q 46.89–52.84 33.56–40.62 18.92–26.13 10.38–13.44
Ccr (ml/min)
Mean (SD) 76.75 (20.68) 54.34 (18.61) 33.22 (10.52) 17.68 (6.15) \0.0001
Median (min–max) 74.90 (30.9–158.0) 52.25 (8.8–240.0) 31.90 (7.2–86.2) 17.00 (4.8–50.0)
1Q–3Q 63.50–87.35 44.10–61.20 26.05–39.70 13.90–21.00
Uric acid (mg/dl)
Mean (SD) 6.59 (1.48) 7.02 (1.39) 7.35 (1.60) 7.48 (1.72) \0.0001
Median (min–max) 6.55 (1.2–12.2) 7.00 (1.9–14.2) 7.20 (2.3–14.2) 7.30 (3.3–13.9)
1Q–3Q 5.60–7.35 6.10–7.90 6.30–8.20 6.30–8.60
U-protein (g/day)
Mean (SD) 0.759 (1.528) 1.016 (1.681) 1.452 (1.883) 1.978 (2.671) \0.0001
Median (min–max) 0.198 (0.00–12.31) 0.410 (0.00–14.36) 0.800 (0.00–13.70) 1.250 (0.00–28.08)
1Q–3Q 0.075–0.735 0.140–1.080 0.280–1.875 0.580–2.640
u-Albumin (mg/g Cr)
Mean (SD) 551.01 (981.88) 766.84 (1295.45) 1058.94 (1302.10) 1484.11 (1528.16) \0.0001
Median (min–max) 148.55 (2.5–6072.6) 297.90 (2.5–14168.2) 630.70 (2.7–9605.1) 1027.10 (14.4–9445.2)
1Q–3Q 28.40–585.20 60.90–849.00 195.80–1408.25 412.20–1972.80
A1C (%)
Mean (SD) 5.95 (1.01) 5.97 (0.95) 5.90 (0.84) 5.86 (0.92) 0.0551
Median (min–max) 5.70 (4.5–11.7) 5.70 (4.1–11.4) 5.60 (4.2–10.4) 5.60 (4.2–10.1)
1Q–3Q 5.30–6.20 5.40–6.20 5.40–6.20 5.30–6.20
Glucose (mg/dl)
Mean (SD) 121.3 (52.3) 119.7 (44.8) 118.3 (41.8) 122.9 (45.2) 0.1987
Median (min–max) 102.0 (47–390) 105.0 (35–456) 106.0 (50–385) 108.0 (42–339)
1Q–3Q 92.0–126.0 93.0–131.0 94.0–128.0 93.0–139.0
HDL-chol (mg/dl)
Mean (SD) 57.0 (18.4) 56.2 (18.7) 53.4 (18.3) 51.5 (17.4) 0.0001
Median (min–max) 53.0 (30–134) 52.0 (15–161) 49.0 (17–149) 48.0 (20–124)
1Q–3Q 44.0–66.0 43.0–66.0 40.0–62.0 38.0–60.0
LDL-chol (mg/dl)
Mean (SD) 114.0 (28.6) 110.2 (34.5) 106.6 (31.0) 103.8 (35.9) 0.0065
Median (min–max) 114.0 (40–222) 106.8 (28–361) 105.0 (17–252) 100.0 (17–258)
1Q–3Q 95.0–130.0 88.0–129.0 85.0–125.0 80.0–122.0
TG (mg/dl)
Mean (SD) 175.9 (133.2) 165.4 (108.1) 168.5 (110.2) 158.8 (87.1) 0.3154
Median (min–max) 142.0 (47–1043) 138.0 (22–868) 139.0 (27–1191) 136.5 (30–602)
1Q–3Q 96.0–213.0 97.0–199.0 98.0–206.0 98.0–201.5
566 Clin Exp Nephrol (2010) 14:558–570
123
Table 4continued
Variable Stage 3A Stage 3B Stage 4 Stage 5 Pvalue
GFRC45, N=304
45[GFRC30, N=1037
30[GFRC15, N=1160
GFR\15, N=476 Ca (mEq/l)
Mean (SD) 9.20 (0.43) 9.11 (0.45) 8.98 (0.49) 8.70 (0.66) \0.0001
Median (min–max) 9.20 (7.6–10.7) 9.10 (6.4–10.6) 9.00 (6.8–11.6) 8.70 (5.4–10.6)
1Q–3Q 8.90–9.50 8.80–9.40 8.70–9.30 8.30–9.10
P (mg/dl)
Mean (SD) 3.28 (0.57) 3.31 (0.60) 3.55 (0.62) 4.09 (0.77) \0.0001
Median (min–max) 3.30 (1.7–5.0) 3.30 (1.6–8.6) 3.50 (1.7–7.8) 4.00 (2.1–7.3)
1Q–3Q 2.90–3.70 2.90–3.70 3.10–3.90 3.60–4.50
Ferritin (ng/dl)
Mean (SD) 129.06 (124.77) 126.01 (120.63) 141.72 (152.82) 155.03 (134.91) 0.0159
Median (min–max) 97.10 (3.4–1088.9) 95.00 (4.0–1043.0) 100.00 (3.2–1520.0) 118.00 (2.6–749.0)
1Q–3Q 43.90–174.70 44.90–173.00 51.10–177.25 62.00–203.00
CRP (mg/dl)
Mean (SD) 0.195 (0.456) 0.241 (0.605) 0.280 (0.792) 0.307 (1.340) 0.4328
Median (min–max) 0.080 (0.00–4.92) 0.100 (0.00–10.21) 0.100 (0.00–11.99) 0.080 (0.00–23.08)
1Q–3Q 0.040–0.150 0.040–0.200 0.040–0.200 0.030–0.200
WBC (/ll)
Mean (SD) 6733.7 (2005.6) 6623.5 (1980.1) 6528.7 (2064.6) 6235.1 (2011.1) 0.0025
Median (min–max) 6400.0 (2100–16600) 6300.0 (2090–16920) 6280.0 (2230–22300) 6000.0 (2300–16360)
1Q–3Q 5300.0–7990.0 5200.0–7600.0 5200.0–7500.0 4800.0–7200.0
RBC (9104/ll)
Mean (SD) 430.1 (56.6) 412.9 (59.1) 375.4 (55.7) 345.7 (46.6) \0.0001
Median (min–max) 431.0 (233–588) 410.0 (216–940) 374.0 (107–890) 345.0 (173–531)
1Q–3Q 396.0–464.0 374.0–449.0 340.0–408.0 317.0–372.0
Ht (%)
Mean (SD) 39.59 (4.99) 38.20 (4.98) 34.99 (4.57) 32.41 (4.13) \0.0001
Median (min–max) 39.80 (20.0–53.2) 38.10 (19.9–55.2) 34.80 (18.4–50.5) 32.60 (17.4–49.8)
1Q–3Q 36.30–42.90 34.80–41.30 32.00–37.70 29.70–35.10
Hb (g/dl)
Mean (SD) 13.35 (1.84) 12.79 (1.74) 11.65 (1.59) 10.69 (1.37) \0.0001
Median (min–max) 13.40 (6.7–19.7) 12.70 (5.2–18.5) 11.50 (6.2–17.4) 10.70 (6.0–16.8)
1Q–3Q 12.20–14.60 11.60–13.90 10.60–12.60 9.80–11.50
iPTH (pg/ml)
Mean (SD) 56.1 (26.5) 67.9 (34.8) 107.7 (69.1) 213.2 (146.2) \0.0001
Median (min–max) 51.0 (11–195) 61.0 (5–376) 93.0 (5–1020) 179.0 (18–1540)
1Q–3Q 36.0–70.0 46.0–82.0 66.0–132.0 120.0–274.0
Classification of medication
Antihypertensives [n(%)] 259 (85.2) 933 (90.0) 1089 (93.9) 454 (95.4) \0.0001
ARB [n(%)] 216 (71.1) 735 (70.9) 871 (75.1) 364 (76.5) 0.0415
ACEI [n(%)] 68 (22.4) 305 (29.4) 336 (29.0) 109 (22.9) 0.0067
Diuretics [n(%)] 58 (19.1) 266 (25.7) 368 (31.7) 193 (40.5) \0.0001
Ca blockade [n(%)] 115 (37.8) 485 (46.8) 705 (60.8) 344 (72.3) \0.0001
b-Blocker [n(%)] 53 (17.4) 228 (22.0) 340 (29.3) 185 (38.9) \0.0001
Antiplatelet/anticoagulant [n(%)] 90 (29.6) 375 (36.2) 419 (36.1) 175 (36.8) 0.1493
Antiplatelet [n(%)] 81 (26.6) 338 (32.6) 396 (34.1) 168 (35.3) 0.0591
Warfarin [n(%)] 14 (4.6) 67 (6.5) 54 (4.7) 19 (4.0) 0.1274
Glucose-lowering agents [n(%)] 68 (22.4) 284 (27.4) 331 (28.5) 148 (31.1) 0.0602
Insulin [n(%)] 26 (8.6) 110 (10.6) 152 (13.1) 78 (16.4) 0.002
Sulfonil urea [n(%)] 25 (8.2) 101 (9.7) 83 (7.2) 38 (8.0) 0.1802
aGI [n(%)] 25 (8.2) 105 (10.1) 101 (8.7) 37 (7.8) 0.4197
Biguanide [n(%)] 7 (2.3) 20 (1.9) 13 (1.1) 2 (0.4) 0.0504
Clin Exp Nephrol (2010) 14:558–570 567