BACKGROUND
Advanced glycation-end products (AGEs) are a het-erogeneous group of fluorescent and non-fluorescent compounds implicated in the pathogenesis of the micro- and macro-vascular complications of
diabe-tes, and in renal disease and atherosclerosis in the non-diabetic population. AGEs can form in short- and long-lived proteins such as albumin, immunoglobu-lins, lipoproteins, skin collagen, ocular, renal and vascular tissues (1). AGEs may be both a cause and effect of inflammation, oxidative stress and dyslipo-proteinemia (2, 3). Recent animal and human studies show benefit of AGE-inhibitors and AGE-breakers in ameliorating renal and cardiovascular damage (4, 5). Therefore AGE levels may have a role in the identification of Type 1 diabetic patients at high risk for complications and also provide a tool for
moni-ORIGINAL
Longitudinal analysis of low-molecular weight
fluoro-phores in type 1 diabetes mellitus
Andrzej S Januszewski
1, Merlin C Thomas
2, Connie S Karschimkus
1,
Jasmine S Chung
1, Kevin G Rowley
1, Craig L Nelson
1, David N O’Neal
1,
George Dragicevic
1, Colin A Harper
3, James D Best
1, and Alicia J Jenkins
1 1)University of Melbourne, Department of Medicine, St Vincent’s Hospital, Melbourne, Austra-lia ;2)
Baker Institute, Melbourne, Australia ; and3)
Department of Ophthalmology, University of Melbourne, Australia
Abstract : Objectives : Circulating low molecular weight ( 10 kDa) fluorophores (LMW-F) measured by non-specific fluorescence spectroscopy may detect small advanced glyca-tion end-products (AGEs) not recognized by other assays. This longitudinal study assessed correlates of LMW-F and predictive power of LMW-F levels for vascular health in Type 1 diabetes (T1DM) patients. Methods : Fasting patients with T1DM (n=37) were studied twice at intervals of 12-60 months (mean SD, 33 15 months). LMW-F levels were also measured once in 112 healthy control subjects. Results : Relative to controls, LMW-F levels were higher in diabetic subjects at initial and final time points (mean SD), 5.4 1.9 AU/ml and 4.5 1.8 AU/ml respectively vs. 3.8 2.1 AU/ml ; p=0.0001 and p=0.06). Baseline LMW-F lev-els predicted subsequent hs-CRP and oxLDL/LDL values. LMW-F levlev-els decreased sig-nificantly over time in diabetes (5.4 1.9 vs. 4.5 1.8 AU/ml ; p=0.02). Rises in LMW-F lev-els in individual diabetic subjects correlated significantly with worsening renal function (BUN), glycemia (HbA1c) and with vascular dysfunction (systemic vascular resistance).
Conclusions : LMW-F levels predict levels of inflammation and oxidation in T1DM. Changes
in LMW-F levels in T1DM reflect variations in glycemia and renal function. Biochemi-cal characterization of LMW-F would facilitate understanding of the potential utility of LMW-F as a therapeutic target. J. Med. Invest. 55 : 29-36, February, 2008
Keywords : advanced glycation end products, low molecular weight fluorophores, type 1 diabetes, renal function
Received for publication July 10, 2007 ; accepted December 26, 2007.
Address correspondence and reprint requests to Andrzej Januszewski MD, PhD, Department of Medicine, St Vincent’s Hospital, The University of Melbourne, 29 Regent St (Cnr. Princes St), Fitzroy VIC 3065, Australia and Fax : +61-3-9288-2581.
toring therapeutic interventions.
Circulating low molecular weight (!10 kDa) AGEs (LMW-AGEs or AGE-peptides) can be measured by relatively simple non-specific fluorescence spectros-copy, which may otherwise only be detected by so-phisticated and laborious assays (6). Given the cur-rent lack of biochemical characterization of these compounds, an alternative less specific name is low molecular weight fluorophores (LMW-F). Relative to healthy subjects, serum LMW-F levels have been reported to be elevated in diabetes (7-9), in (diabetic and non-diabetic) renal failure (10) and to be low-ered by hemodialysis (11). In a large cross-sectional study of Type 2 diabetes patients LMW-AGEs were inversely related to renal function and to hemoglo-bin levels (independent of renal function) (8). Us-ing a fluorescence spectroscopy assay with potential clinical utility, we previously reported that plasma LMW-F levels were elevated in patients with Type 1 diabetes (T1DM) and vascular complications, and that levels did not differ between complication-free T1DM patients and healthy non-diabetic subjects (12). In this cross-sectional study LMW-F levels were correlated with renal function, but not with age, diabetes duration, body habitus, smoking, glycemia, lipid levels or arterial elasticity (12).
We now present the behavior over time of LMW-F levels in T1DM patients, and their relationships with renal and vascular health, and measures of glyce-mia, inflammation and oxidative damage.
METHODS
Subject characterization : The study was approved by the St Vincent’s Hospital Human Research Eth-ics Committee and each subject gave written in-formed consent. Thirty-seven patients with T1DM (13 with and 24 without complications) with (mean !SD) diabetes duration of 21!13 years from the St. Vincent’s diabetes clinics volunteered for the study. Patients attended at least twice at an inter-val of 12-60 months ; long enough for changes in glycemia to be reflected by the concurrent HbA1c level. We compared results with data obtained (on one occasion) from 112 healthy control subjects. These control subjects did not have clinically evi-dent macrovascular disease, hypertension, diabe-tes, renal disease or dyslipidemia requiring drug treatment. They were not taking any medications (other than the oral contraceptive pill). No subject was taking antioxidant vitamin supplements.
Smok-ers were not excluded from the study.
Blood pressure and arterial elasticity were meas-ured in fasted supine subjects by pulse-wave analysis (HDI Inc, Egan, MN) as previously described (13), including measures of vascular elasticity and sys-temic vascular resistance (SVR). Venous blood was taken after an overnight fast and a single void urine sample collected. Routine clinical chemistry was performed by the St.Vincent’s Hospital Pathology Department. For research analyses plasma (1 mM EDTA) and serum were prepared (2000 g, 15 min, 4"!) and stored (-80"!) until LMW-F, cystatin C and measures of inflammation (high sensitivity C-reactive protein, (hs-CRP) and ESR) and oxidative damage (Oxidized LDL, (OxLDL)) were assayed. Levels of LMW-fluorophores in (first-thaw) plasma were determined in duplicate by fluorescence spec-troscopy as described (8), with intra- and inter-assay coefficients of variation (CV) of 5.2% and 7.3% re-spectively. In preliminary studies there were no sta-tistically significant differences between LMW-F in serum and EDTA plasma from the same subjects, and LMW-fluorescence was stable through two, but not three, freeze-thaw cycles. For the analysis of yearly changes a subset of subjects (n=37) with one year or more between-visit intervals were studied (see below). Creatinine clearance was calculated using the Cockroft-Gault formula (14, 15). Nor-mal range is defined as 90 - 150 ml/min. Cystatin C was measured in serum by nephelometry using Dade Boehring, Germany instrument. The refer-ence interval is 0.53 - 0.95 mg/l. Intra- and interas-say CV’s were!3.3%. Oxidative stress : Oxidized LDL was measured in serum by ELISA (Mercodia AB, Uppsala, Sweden). All intra- and inter-assay CVs were!6.3% and!12.0% respectively.
To control for the potential influence of the dif-ferent time intervals at which patients were stud-ied and reduce variance, all changes were normal-ized, using the formula below, as the percentage change per annum, with initial visit values being taken as 100%. Thus, a positive or negative percent change at last visit reflects both change in magni-tude and direction.
Percent change=100(
Years
!Last visit-Years
!First visit)
Years
!First visit Years = time between 1st
and last assessment in years Data were analyzed using Statistica for Windows (StatSoft, Inc. (2007) Tulsa, OK. STATISTICA (data analysis software system), version 8.0 www.statsoft.
com). Non-normally distributed variables : hsCRP, triglycerides (TG), urinary albumin and albumin to creatinine ratio (ACR) values, were transformed logarithmically. Differences between diabetic and control subjects were analyzed using Student-t-test and between control subjects and diabetic patients subdivided into those with and without complica-tions (CX[+] and CX[-] respectively) - using one way analysis of variance (ANOVA). For correlation analy-ses Pearson’s correlation coefficient was calculated and multiple regression analysis done. Statistical significance was taken at p!0.05.
RESULTS
Subject characteristics are reported in Table 1. Thirty-seven subjects (20 women and 17 men, 13 with and 24 without diabetes complications) with T1DM studied at an interval of at least 1 year were evaluated. Mean"SD follow-up time was 33"15 months, with a range of 12 - 60 months. Data are given for controls (at baseline) and for all diabetic subjects at their first and final visit. There was no statistically significant change in any clinical or
bio-chemical parameter analyzed over the study dura-tion.
Longitudinal measures of LMW-F in diabetes and its complications. The baseline characteristics of the group studied longitudinally did not differ from that of the whole larger diabetic group (n=148) in the previously reported cross-sectional study (12), and also did not differ significantly from those diabetic subjects not restudied (data not shown). Relative to healthy controls, plasma LMW-F were increased in patients with T1DM at the initial but not at the final visit (5.4"1.9 AU/ml at the initial visit and 4.5" 1.8 AU/ml at the final visit vs. 3.8"2.1 AU/ml ; p= 0.0001 and p=0.06 respectively). Levels of LMW-F were significantly higher at the beginning of the study relative to those at the final visit (5.4"1.9 AU/ml vs. 4.5"1.8 AU/ml, p=0.02). In 19 subjects in whom LMW-F levels were measured more than twice, mean LMW-F levels between first and final visit correlated with values obtained at the last visit (r=0.79 ; p!0.00001). However, when data from the first visit were compared with mean levels obtained at all other visits (including the last one) the statis-tical significance disappeared (5.4"1.9 AU/ml vs. 4.9"1.8 AU/ml, p=0.24).
Table 1. Clinical characteristics of Control and Type 1 diabetic (T1DM) subjects. Data are mean"SEM. Control subjects Type 1 DM First visit Type 1 DM Last visit n (M/F) 112 (52/60) 37 (17/20) 37 (17/20) Age (years) 37"12 34"14 37"14 BMI (kg/m2) 25.0"4.1 25.6"4.4 26.0"4.9 SBP (mmHg) 120"13 128"13* 128"15* DBP (mmHg) 68"10 73"10* 73"10* MAP (mmHg) 87"12 94"11* 93"12* Pulse pressure (mmHg) 52"8 57"14* 55"10 LAE (ml/mmHg
!
10) 17.6"4.9 16.4"4.6 16.9"6.0 SAE (ml/mmHg!
100) 8.3"3.4 6.1"2.7* 6.9"3.5* SVR (dyne!
sec!
cm-5) 1246"230 1336"268 1296"270Fasting serum glucose (mmol/l) 4.9"0.5 11.7"4.6* 11.5"5.6*
HbA1c (%) 5.1"0.3 8.1"1.5* 8.1"1.9*
Total Cholesterol (mmol/l) 5.1"1.0 5.0"1.0 4.6"1.0* Triglycerides (mmol/l) 1.11"0.68 1.16"0.82 0.97"0.56 HDL-Cholesterol (mmol/l) 1.52"0.38 1.49"0.53 1.36"0.33 OxLDL/LDL ratio (U/mmol) 33.2"12.3 35.5"6.9 33.8"13.9
Hemoglobin (g/l) 140"16 137"20 137"15
ESR (mm/h) 14.3"47.9 9.6"9.2 12.4"11.3
Urinary Albumin/Creatinine (mg/mmol) 0.8"1.2 9.9"21.7* 19.8"69.7*
Serum BUN (mg/l) 4.9"1.2 6.2"2.3* 7.2"3.9* Cystatin C (mg/l) 0.78"0.10 0.89"0.36 1.03"0.58* GFR (ml/s) 1.75"0.54 1.71"0.53 1.95"1.92 Hs-CRP (mg/l) 1.7"2.2 2.4"2.5 2.7"2.6* LMW-F (AU/ml) 3.8"2.1 5.4"1.9* 4.5"1.8* Current smokers (n/%) 15/13 7/19 10/27*
Lipid lowering drugs (n/%) 0 22 30
There was no statistically significant difference between LMW-F levels between women and men at the beginning (mean!SD : females 5.9!2.2 AU/ ml vs. males 4.8!1.3 AU/ml ; p=0.08) or end of the study (mean!SD : females 5.0!2.0 AU/ml vs. males 3.9!1.3 AU/ml ; p=0.07). However in men LMW-F levels decreased significantly during the study (4.8!1.3 AU/ml at the initial visit vs. 3.9! 1.3 AU/ml at the final visit ; p=0.03) whereas lev-els in women did not change significantly (5.9! 2.2 AU/ml at study beginning vs. 5.0!2.0 AU/ml at the end ; p=0.18). There was no statistically sig-nificant difference between LMW-F levels in sub-jects stratified by diabetes complication status. In the complication-free group baseline LMW-F levels were 5.6!2.0 AU/ml and 4.5!1.3 AU/ml at the end of the study. In the diabetic group with compli-cations baseline LMW-F levels were 5.1!1.9 AU/ ml and 4.6!2.5 AU/ml at the end of the study. This change did not reach statistical significance in either group. The time intervals at which subjects were studied did not correlate with differences be-tween LMW-F levels.
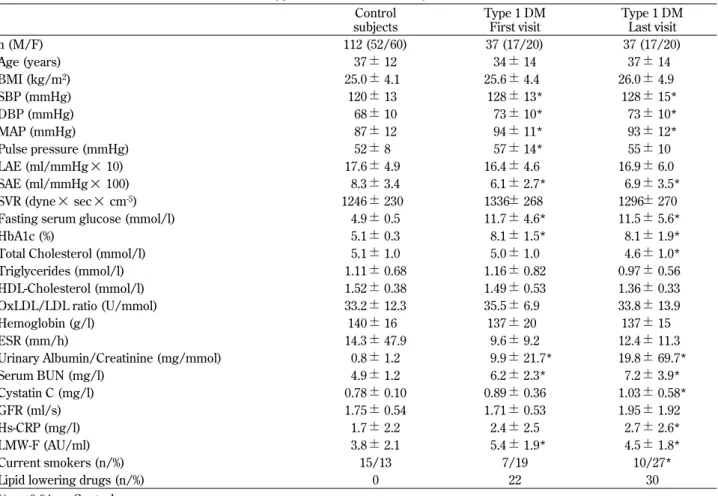
In univariate analysis of cross-sectional data, initial LMW-F levels correlated with baseline hs-CRP (r= 0.51 ; p=0.005) values, with ACR (r=0.48 ; p=0.03), and with calculated GFR levels (r=0.50 ; p=0.007), as previously reported In the larger diabetes group (12). Baseline LMW-F levels predicted final visit hs-CRP (r=0.57 ; p=0.002) and OxLDL/LDL ratio (r=0.69 ; p=0.001) (Figure 1). In this respect they were better predictors than HbA1c and TG levels as neither baseline level correlated with final visit hs-CRP or OxLDL/LDL ratio. Final LMW-F corre-lated with : final mean arterial pressure (also sys-tolic and diassys-tolic blood pressure) (r=0.52 ; p=0.002), systemic vascular resistance (r=0.38 ; p=0.03) se-rum creatinine (r=0.45 ; p=0.006), BUN (r=0.48 ;
p=0.004), cystatin C (r=0.62 ; p=0.002), and urinary ACR (r=0.69 ; p=0.0001), serum billirubin (an antioxi-dant) (r=-0.51 ; p=0.04) and ESR (r=0.66 ; p=0.0001). Serum BUN and ACR values at baseline correlated significantly with end-point LMW-F (r=0.38 ; p=0.03 and r=0.46 ; p=0.03 respectively). There was a sig-nificant negative correlation between initial hemo-globin levels and final LMW-F levels (r=-0.54 ; p= 0.009).
In multivariate analysis after adjustment for gen-der, age, diabetes complications, glycemic control, renal function (GFR), lipids (TG, HDL-C, non-HDL-C) and inflammation the strongest predictors of LMW-F levels at the initial visit were gender (p= 0.006), renal function (p=0.002) and TG levels (p= 0.03). In the same model applied at the final visit the only statistically significant predictor of LMW-F lev-els was renal function (p=0.002). Similarly when the model was applied to combined data from baseline and final visits the significant predictors of LMW-F levels were diabetes complication status (p=0.04) and renal function (ACR) (p=0.0002).
In control subjects significant correlations between LMW-F and albuminuria (but not ACR) (r=0.22 ; p= 0.03) and TG (r=0.21 ; p=0.03) were noted. There was no significant difference between LMW-F lev-els in males and females in the control group (3.9 !0.4 vs. 3.8!0.2 AU/ml ; p!0.05 respectively). In multivariate analysis after the adjustment for gender, age, glycemia, renal function, lipids and inflamma-tion the only significant LMW-F predictor in healthy subjects was TG level (p=0.007).
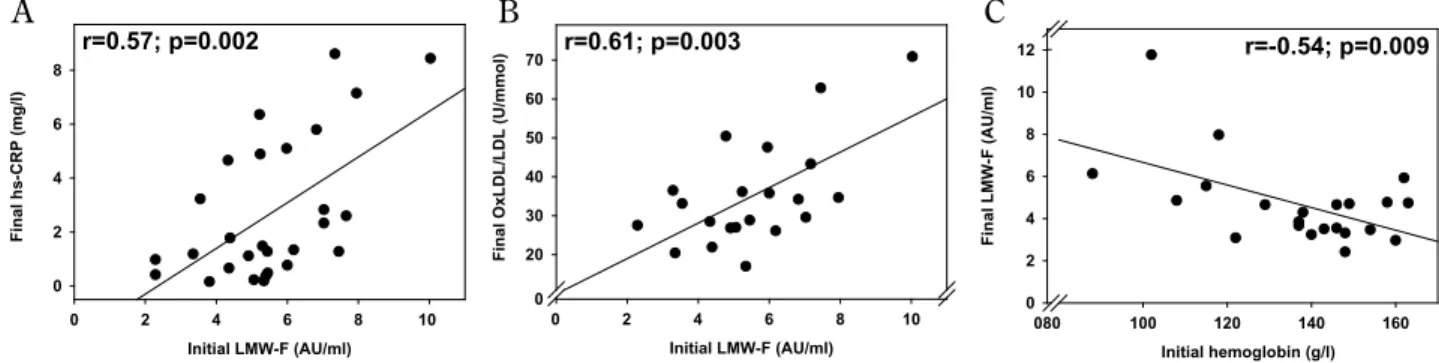
In T1DM subjects, the annual percentage change in LMW-F between visits correlated with the yearly change in BMI (r=0.43 ; p=0.02), systolic blood pres-sure (r=0.54 ; p=0.004), pulse prespres-sure (r=0.54 ; p= 0.004), systemic vascular resistance (SVR) (r=0.39 ; p=0.04), BUN (r=0.38 ; p=0.03), HbA1c (r=0.38 ; p=
A B C
Figure 1. Baseline LMW-F levels correlated significantly with inflammation (hs-CRP) (panel A) and OxLDL/LDL ratio (panel B) at the end of the study. Baseline hemoglobin level correlated significantly with LMW-F levels at the end of the study (panel C).
0.04) and hemoglobin (r=0.65 ; p=0.005) (Figure 2). Mean HbA1c levels measured during the study cor-related with SVR yearly percentage changes (r= 0.44 ; p=0.03). Similarly, mean TG levels correlated
with hs-CRP yearly percentage changes (r=0.56 ; p= 0.009). Annual percentage changes in TG levels cor-related with the yearly changes in hs-CRP levels (r= 0.51 ; p=0.02) and the OxLDL/LDL ratio (r=-0.67 ; p=0.02).
DISCUSSION
We report results of a longitudinal study of plasma LMW-F levels measured by a relatively simple tech-nique in Type 1 diabetic patients. Relative to healthy subjects LMW-F levels were increased in diabetes regardless of complication status. There was a sig-nificant decrease in LMW-F levels over the study period in the diabetic group as a whole, however not as a result of amelioration of renal function, as se-rum creatinine, BUN, GFR and ACR did not change significantly. Also, when individual changes were expressed as percentage change per annum they correlated with changes in BMI, HbA1c, vascular health, as measured by pulse-wave analysis, BUN and hemoglobin. Baseline LMW-F levels correlated with inflammation and renal function parameters and were predictive of oxidation stress and inflam-mation. In multivariate analysis LMW-F levels were determined by renal function and lipids.
In a cross-sectional analysis LMW-F were related to inflammation (hs-CRP), renal function (ACR, cal-culated GFR, serum creatinine, cystatin C), vascu-lar status (blood pressure, systemic vascuvascu-lar resis-tance). No associations between age, diabetes du-ration, body habitus, HbA1c or oxidative stress and LMW-F levels were noted. These findings are simi-lar to simi-large cross-sectional studies of subjects with Type 2 diabetes (8) and a mixed group of subjects with Type 1 and Type 2 diabetes, in which levels in T1DM (20% of the group) were not reported sepa-rately (7). In both studies levels of LMW-AGEs (as these compounds are referred to in these reports) were significantly higher in patients with diabetes than in non-diabetic subjects. Limited data are avail-able regarding LMW-F levels in T1DM. Using fluo-rescence spectroscopy Galler, et al. found increased levels of fluorescent AGEs in a pediatric group with T1DM, which were positively correlated with HbA1c
and TG levels (9). We previously reported a cross-sectional analysis of 148 T1DM patients in which LMW-F levels correlated with serum creatinine and BUN, and creatinine clearance, and these relation-ships were statistically significant even within the normal range of renal function. In addition, LMW-F A
B
C
D
Figure 2. Percentage change of LMW-F between first and last visit normalized per year correlated significantly with values of the yearly change of pulse pressure (panel A), systemic vascu-lar resistance (panel B), BUN (panel C) and HbA1c (panel D).
levels correlated with urinary ACR. There were no statistically significant relationships between LMW-F and diabetes duration, age or HbA1c in this cross-sectional study (12), as in this present study. Here in a longitudinal study we showed a correlation be-tween annual percentage changes of HbA1c and LMW-F levels. In multivariate analysis TG were the third strongest predictor (after renal function and gender) of LMW-F levels. Blood samples were fast-ing, which would reduce the potential influence of dietary AGEs (16). The finding of a significant as-sociation between LMW-F and lipids in our study supports the notion that AGEs can form within and be derived from lipoproteins - Advanced Lipoxida-tion End products (ALEs) (3, 17).
T1DM with microvascular complications was as-sociated with higher LMW-F (in our earlier larger cross-sectional study (12), and in keeping, in this current study renal function (expressed as GFR or ACR) was the strongest predictor of LMW-F levels. Our results support previous research that LMW-F levels are related to renal function (8, 12). In addi-tion, studies by others investigating low- and high-molecular weight AGEs demonstrate elevated lev-els in renal failure (10, 18) with a reduction by high-flux hemodialysis (19, 20). It is uncertain if the ele-vated level of LMW-F or other AGEs in renal dis-ease relates to impaired removal, incrdis-eased produc-tion, or both. ACE inhibitors, a common treatment for increased urinary albumin loss and for hyper-tension in diabetes can lower AGEs (21). However in this present study and in our earlier larger cross-sectional series, LMW-F levels did not differ be-tween diabetic subjects taking ACE-inhibitors or an-giotensin receptor blocking agents and those not on these medications (data not shown). We found a strong negative correlation between initial hemo-globin levels and final LMW-F. A similar observa-tion was previously reported by Thomas, et al. (8). They reported that anemic patients with T2DM had higher levels of LMW-F than non-anemic T2DM pa-tients. In our study no patients were anemic ; how-ever we did find significant correlations between hemoglobin and LMW-F levels, and also between the annual changes of both measures. This may re-flect a more subtle effect of renal dysfunction on hemoglobin levels. It may also reflect that reduced tissue oxygenation contributes to AGE formation, or it may reflect increased oxidative stress as the re-sult of disturbed protein metabolism or inflamma-tion, or both.
In this present study age and diabetes duration
were not related to LMW-F levels. In contrast Sharp, et al. found that age correlated positively with LMW-AGEs levels in both their older control and (pre-dominantly T2DM) diabetic groups (7). This may be related to age-related renal function decline. A correlation between age, diabetes duration and fluo-rescent AGEs was observed in children and adoles-cents with T1DM (9). By dividing subjects into two age subgroups (9-13 and 13-16 years) the authors showed a 15% increase in LMW-AGE levels. This may reflect a pubertal effect, and the relevance of this finding to our non-pediatric population is un-clear.
Circulating AGE levels have been correlated with endothelial dysfunction measured by flow-mediated dilatation (FMD) (22). In our studies final circulat-ing LMW-F levels were related to measures of vas-cular health (mean arterial pressure, systolic and diastolic blood pressure and SVR, but no such cor-relations were observed at the initial visit. Changes in LMW-F levels, expressed as percentage per year, correlated with similarly expressed changes in sys-tolic blood pressure, pulse pressure and SVR. In this regard LMW-F was a comparable vascular health predictor to HbA1c.
AGE formation may be promoted by inflamma-tion, and conversely AGEs can induce inflammainflamma-tion, including vascular endothelial cell adhesion mole-cule expression (23, 24). In keeping, we noted sig-nificant correlations between baseline LMW-F and ESR and CRP levels. We also noted a correlation be-tween mean and yearly percent changes of TG lev-els with percent changes per year of hs-CRP levlev-els. The strength of these correlations was comparable with that between LMW-F and hs-CRP but the sta-tistical significance in each case was lower than that between LMW-F and hs-CRP. Similarly AGE for-mation may induce and be promoted by oxidative stress (17, 25) and we identified a relationship be-tween initial LMW-F and final OxLDL/LDL ratio. The changes in the OxLDL/LDL ratio also corre-lated significantly with changes in TG levels, but the statistical strength of this correlation was lower than that between LMW-F and the OxLDL/LDL ratio.
In conclusion, our results suggest that levels of LMW-F rise early with a decline in renal function, at a time when an effective therapeutic intervention could still preserve renal, retinal, and macrovascu-lar health. Changes in LMW-F levels follow changes in glycemic control and vascular health. Addition-ally, LMW-F levels can predict levels of inflamma-tion and oxidative stress. Apart from renal funcinflamma-tion,
inflammation and lipids levels are the strongest predictors of LMW-F levels. The exact chemical moieties measured by this non-specific fluorescence-based assay, the relationship between these prod-ucts and well-defined AGEs and their biological sources in vivo are not fully elucidated, but studies are in progress (26). In addition to better biochemi-cal characterization of the LMW-fluorophores de-tected by this potentially clinically applicable assay, longitudinal studies relating these fluorophores to tissue fluorescence, vascular complications and mor-tality are warranted. Intervention studies, including evaluation of effects of AGE inhibitors, AGE break-ers, antioxidants, and various renal replacement regimens are also merited.
ACKNOWLEDGMENTS
Authors thank Prof. Peter Colman, Dr Chee Teik Lee, Mrs. Margaret Pillai, Helen Boffa and Eve An-war for assistance with subject recruitment and as-sessment. Grant support was provided by the Ameri-can Diabetes Association Lions Sight First program, the Juvenile Diabetes Research Foundation, the Ophthalmic Research Institute of Australia, the Na-tional Heart Foundation (Australia) and St Vincent’s Research Foundation. This research was presented at the 2006 ADA Conference, Washington DC (Dia-betes, 2006, 55(suppl. 1), A179.
REFERENCES
1. Thorpe SR, Baynes JW : Maillard reaction prod-ucts in tissue proteins : new prodprod-ucts and new perspectives. Amino Acids 25 : 275-281, 2003 2. Jenkins AJ, Rowley KG, Lyons TJ, Best JD,
Hill MA, Klein RL : Lipoproteins and diabetic microvascular complications. Curr Pharm Des 10 : 3395-3418, 2004
3. Jenkins AJ, Best JD, Klein RL, Lyons TJ : ’Lipoproteins, glycoxidation and diabetic an-giopathy’. Diabetes Metab Res Rev 20 : 349-368, 2004
4. Bakris GL, Bank AJ, Kass DA, Neutel JM, Preston RA, Oparil S : Advanced glycation end-product cross-link breakers : a novel approach to cardiovascular pathologies related to the ag-ing process. Am J Hypertens 17 : 23S -30S, 2004 5. Davis BJ, Forbes JM, Thomas MC, Jerums G, Burns WC, Kawachi H, Allen TJ, Cooper ME :
Superior renoprotective effects of combination therapy with ACE and AGE inhibition in the diabetic spontaneously hypertensive rat. Dia-betologia 47 : 89-97, 2004
6. Lapolla A, Fedele D, Seraglia R, Traldi P : The role of mass spectrometry in the study of non-enzymatic protein glycation in diabetes : An update. Mass Spectrom Rev, 2006
7. Sharp PS, Rainbow S, Mukherjee S : Serum lev-els of low molecular weight advanced glycation end products in diabetic subjects. Diabet Med 20 : 575-579, 2003
8. Thomas MC, Tsalamandris C, MacIsaac R, Medley T, Kingwell B, Cooper ME, Jerums G : Low-molecular-weight AGEs are associated with GFR and anemia in patients with type 2 diabetes. Kidney Int 66 : 1167-1172, 2004 9. Galler A, Muller G, Schinzel R, Kratzsch J,
Kiess W, Munch G : Impact of metabolic con-trol and serum lipids on the concentration of ad-vanced glycation end products in the serum of children and adolescents with type 1 diabetes, as determined by fluorescence spectroscopy and nepsilon-(carboxymethyl)lysine ELISA. Dia-betes Care 26 : 2609-2615, 2003
10. Makita Z, Radoff S, Rayfield EJ, Yang Z, Skolnik E, Delaney V, Friedman EA, Cerami A, Vlassara H : Advanced glycosylation end prod-ucts in patients with diabetic nephropathy. N Engl J Med 325 : 836-842, 1991
11. Stein G, Franke S, Mahiout A, Schneider S, Sperschneider H, Borst S, Vienken J : Influence of dialysis modalities on serum AGE levels in end-stage renal disease patients. Nephrol Dial Transplant 16 : 999-1008, 2001
12. Januszewski AS, Thomas MC, Chung SJ, Karschimkus CS, Rowley KG, Nelson C, O’Neal D, Wang Z, Best JD, Jenkins AJ : Plasma low-molecular weight fluorescence in type 1 diabe-tes mellitus. Ann NY Acad Sci 1043 : 655-661, 2005
13. Wilson AM, O’Neal D, Nelson CL, Prior DL, Best JD, Jenkins AJ : Comparison of arterial assessments in low and high vascular disease risk groups. Am J Hypertens 17 : 285-291, 2004 14. Cockcroft DW, Gault MH : Prediction of cre-atinine clearance from serum crecre-atinine. Neph-ron 16 : 31-41, 1976
15. Gault MH, Longerich LL, Harnett JD, Wesolowski C : Predicting glomerular function from ad-justed serum creatinine. Nephron 62 : 249-256, 1992
16. Vlassara H : Advanced glycation in health and disease : role of the modern environment. Ann NY Acad Sci 1043 : 452-460, 2005
17. Januszewski AS, Alderson NL, Metz TO, Thorpe SR, Baynes JW : Role of lipids in chemical modification of proteins and development of complications in diabetes. Biochem Soc Trans 31 : 1413-1416, 2003
18. Wrobel K, Garay-Sevilla ME, Nava LE, Malacara JM : Novel analytical approach to monitoring advanced glycosylation end products in human serum with on-line spectrophotometric and spectrofluorometric detection in a flow system. Clin Chem 43 : 1563-1569, 1997
19. Gerdemann A, Lemke HD, Nothdurft A, Heidland A, Munch G, Bahner U, Schinzel R : Low-molecular but not high-molecular advanced glycation end products (AGEs) are removed by high-flux dialysis. Clin Nephrol 54 : 276 -283, 2000
20. Makita Z, Bucala R, Rayfield EJ, Friedman EA, Kaufman AM, Korbet SM, Barth RH, Winston JA, Fuh H, Manogue KR, Cerami A, Vlassara H : Reactive glycosylation endproducts in diabetic uraemia and treatment of renal fail-ure. Lancet 343 : 1519-1522, 1994
21. Forbes JM, Cooper ME, Thallas V, Burns WC, Thomas MC, Brammar GC, Lee F, Grant SL, Burrell LA, Jerums G, Osicka TM : Reduction
of the accumulation of advanced glycation end products by ACE inhibition in experimental diabetic nephropathy. Diabetes 51 : 3274-3282, 2002
22. Tan KC, Chow WS, Ai VH, Metz C, Bucala R, Lam KS : Advanced glycation end products and endothelial dysfunction in type 2 diabetes. Dia-betes Care 25 : 1055-1059, 2002
23. Kunt T, Forst T, Harzer O, Buchert G, Pfutzner A, Lobig M, Zschabitz A, Stofft E, Engelbach M, Beyer J : The influence of advanced glyca-tion endproducts (AGE) on the expression of human endothelial adhesion molecules. Exp Clin Endocrinol Diabetes 106 : 183-188, 1998 24. Basta G, Schmidt AM, De Caterina R :
Ad-vanced glycation end products and vascular inflammation : implications for accelerated athe-rosclerosis in diabetes. Cardiovasc Res 63 : 582-592, 2004
25. Baynes JW, Thorpe SR : Glycoxidation and lipoxidation in atherogenesis. Free Radic Biol Med 28 : 1708-1716, 2000
26. Thornalley PJ, Battah S, Ahmed N, Karachalias N, Agalou S, Babaei-Jadidi R, Dawnay A : Quan-titative screening of advanced glycation end-products in cellular and extracellular proteins by tandem mass spectrometry. Biochem J 375 : 581-592, 2003