• 検索結果がありません。

Significant THz absorption in CH3NH2 molecular defect-incorporated organic-inorganic hybrid perovskite thin film

N/A
N/A
Protected

Academic year: 2021

シェア "Significant THz absorption in CH3NH2 molecular defect-incorporated organic-inorganic hybrid perovskite thin film"

Copied!
9
0
0

読み込み中.... (全文を見る)

全文

(1)

Significant THz absorption in CH3NH2 molecular defect‑incorporated organic‑inorganic hybrid perovskite thin film

Author Inhee Maeng, Young Mi Lee, Jinwoo Park, Sonia R. Raga, Chul Kang, Chul‑Sik Kee, Byung Deok Yu, Suklyun Hong, Luis K. Ono, Yabing Qi, Min‑Cherl Jung, Masakazu Nakamura

journal or

publication title

Scientific Reports

volume 9

number 1

page range 5811

year 2019‑04‑09

Publisher Nature Research

Rights (C) 2019 The Author(s).

URL http://id.nii.ac.jp/1394/00000932/

doi: info:doi/10.1038/s41598-019-42359-8

Creative Commons?

Attribution 4.0 International?

(2)

www.nature.com/scientificreports

Significant THz absorption in CH 3 NH 2 molecular defect-

incorporated organic-inorganic hybrid perovskite thin film

Inhee Maeng 1 , Young Mi Lee 2 , Jinwoo Park 3 , Sonia R. Raga 4,7 , Chul Kang 1 , Chul-Sik Kee 1 , Byung Deok Yu 3 , Suklyun Hong 5 , Luis K. Ono 4 , Yabing Qi 4 , Min-Cherl Jung 6 &

Masakazu Nakamura 6

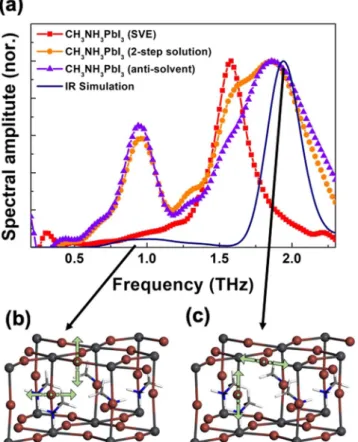
The valid strong THz absorption at 1.58 THz was probed in the organic-inorganic hybrid perovskite thin film, CH

3

NH

3

PbI

3

, fabricated by sequential vacuum evaporation method. In usual solution-based methods such as 2-step solution and antisolvent, we observed the relatively weak two main absorption peaks at 0.95 and 1.87 THz. The measured absorption spectrum is analyzed by density-functional theory calculations. The modes at 0.95 and 1.87 THz are assigned to the Pb-I vibrations of the inorganic components in the tetragonal phase. By contrast, the origin of the 1.58 THz absorption is due to the structural deformation of Pb-I bonding at the grain boundary incorporated with a CH

3

NH

2

molecular defect.

Recently, organic-inorganic hybrid perovskite (OHP), ABX

3

(A = Organic cation: CH

3

NH

3+

/NH

2

CH = NH

2+

, B = Metal cation: Pb/Sn, and X = Halide anion: Cl/Br/I) is a promising material for solar-cell, field-effect tran- sistor, and light-emitting diode applications

1–7

. Because OHP material shows several advantageous properties such as wide light absorption range, low exciton binding energy, and high carrier mobility

4,8,9

. Also, the pre- cursor materials for the fabrication of OHPs are cheap. Furthermore, OHP thin films can be fabricated using solution-based methods such as spin-casting and printing, which also corresponds to low-cost technologies

4

. Currently, the number of published works on OHPs are growing exponentially

10

. Even, nanoscience research using OHP material is just begun, and its single crystal formation with nano-scale size and physical properties such as bandgap engineering were reported

6,7,11–13

. New applications employing these OHP materials are expected to further expand due to the several unique physical properties still unexplored in these materials.

To understand the structural and fundamental properties of OHPs for a possibility of new application, THz-based measurement is a useful technique because the THz energy range (0.5~5 THz) is susceptible to the resonance of molecular vibration/rotation and lattice vibrations

4,14

. Recently, C. Quarti et al. reported the bending-stretching of the Pb–I bonds in CH

3

NH

3

PbI

3

using Raman spectroscopy corroborated by density-functional theory simulations, that are diagnostic modes of the inorganic cage with the bands at 62 (1.86 THz) and 94 (2.82 THz) cm

–115

. In this report, they conducted characterization on solution-prepared samples. An alternative method for the fabrication of OHPs reported in several works is based on vacuum-evaporation

16–18

. This might be a possibility to find a new physical property of the OHP thin films made by the different fabrication methods.

1

Advanced Photonics Research Institute, Gwangju Institute of Science and Technology, Gwangju, 61005, Republic of Korea.

2

Beamline department, Pohang Accelerator Laboratory, POSTECH, Pohang, 37673, Republic of Korea.

3

Department of Physics, University of Seoul, Seoul, 02504, Republic of Korea.

4

energy Materials and Surface Sciences Unit, Okinawa Institute of Science and Technology Graduate University, Okinawa, 904-0495, Japan.

5

Graphene Research Institute and Department of Physics, Sejong University, Seoul, 05006, Republic of Korea.

6

Division of Materials Science, Nara Institute of Science and Technology, Nara, 630-0192, Japan.

7

Present address:

ARc centre of excellence in exciton Science and Department of chemical engineering, Monash University, clayton, VIC, 3800, Australia. Inhee Maeng, Young Mi Lee and Jinwoo Park contributed equally. Correspondence and requests for materials should be addressed to M.-C.J. (email: [email protected])

Received: 8 February 2019 Accepted: 29 March 2019 Published: xx xx xxxx

opeN

(3)

www.nature.com/scientificreports www.nature.com/scientificreports/

In this study, we performed THz time-domain spectroscopy (THz-TDS) to see the THz absorption property in OHP thin films made by 1) solution-processed (2-step and antisolvent methods) and 2) vacuum-evaporated (sequential vacuum evaporation: SVE) methods with CH

3

NH

3

PbI

3

and CH

3

NH

3

SnI

316,17,19

. Interestingly, the approximately 50% transmission of THz amplitude and 11000 cm

−1

of absorption coefficient at 1.58 THz was found only from the CH

3

NH

3

PbI

3

thin film fabricated by the vacuum-evaporated method, and this absorption is assumed to originate from a structural deformation incorporated with the molecular defect of CH

3

NH

2

at the grain boundary. Finally, we suggest this can be a good possibility for THz-based applications using OHP thin film with cheap and easy-fabrication.

Results

We demonstrate the THz-TDS on the CH

3

NH

3

PbI

3

and CH

3

NH

3

SnI

3

OHP thin film formed on Al

2

O

3

substrate by solution-processed (2-step solution and antisolvent methods) and sequential vacuum-evaporated (SVE) meth- ods

16–19

. In the transmission spectra (Fig. 1a,b), we found clear resonance features and significant absorption difference in each fabrication method. It is difficult to find representative absorption spectra in the CH

3

NH

3

SnI

3

thin film which are seemed to be mixed with several absorption signals compared to the CH

3

NH

3

PbI

3

. These observations are correlated with the well-known material instability of Sn-based perovskite thin film

20

.

Two main phonon modes are observed at 0. 95 THz and 1.87 THz in the CH

3

NH

3

PbI

3

thin films fabricated by the 2-step solution method and the antisolvent method

21

. The absorbance of the film made from the anti-solvent method is two times higher than that of the 2-step solution method. This result is consistent with the previ- ous report

22

. The modes are assigned to the buckling of the Pb-I-Pb angles and Pb-I length vibrational mode

22

. On the other hand, the CH

3

NH

3

PbI

3

thin film fabricated by SVE method shows one strong and well-resolved absorptance peak around 1.58 THz, which reaches almost 50% of transmission and 11000 cm

−1

of absorption coefficient (Fig. 1c). These results show that the property and origin of the THz absorption in OHP thin films are different depending on the different fabrication methods. More importantly, the high absorption properties make OHP materials ideal for THz-based optoelectronic device applications employing versatile and low-cost fabrica- tion methods

23

. To quantify the contribution of each vibrational modes, we also performed the THz absorption fittings using the dielectric function of collection of Lorentz Oscillators with the standard thin film approxi- mation

24–26

(Fig. 1d). The fitting parameters and results are shown in Table 1 and Fig. 1d, respectively. The THz absorption of CH

3

NH

3

PbI

3

thin film fabricated by the antisolvent method clearly exhibits dominant peaks at 0.95 and 1.87 THz, whereas the THz absorption of the CH

3

NH

3

PbI

3

thin film fabricated by the SVE method exhibits the main peak at 1.58 THz. In the case of the 2-step solution method, the THz absorption consists of three oscilla- tors with resonance frequencies (oscillator strength) of 0.95 (2.5), 1.58 (2.5), and 1.87 (4.7) THz.

To understand the 0.95/1.87 THz and 1.58 THz absorptions from the solution-prepared and vacuum-evaporated methods, respectively, we performed infrared (IR) simulations using density-functional the- ory calculations of vibrational modes (Fig. 2). Firstly, we consider the tetragonal phase for the CH

3

HN

3

PbI

3

sys- tem, which is the stable phase above 162 K. The IR simulation of CH

3

NH

3

PbI

3

shows two main peaks at 0.95 and 1.87 THz in the low-frequency THz region (Fig. 2). These two modes are associated with the Pb-I vibrations of the inorganic components. At the vibration mode at 0.95 THz, the I atom between the two Pb atoms vibrates in the Figure 1. (a) Transmitted THz waveform through sapphire substrate reference (gray) with the CH

3

NH

3

PbI

3

hybrid perovskites film fabricated by vacuum evaporation method (red) in frequency domain and time domain

(inset). (b) THz transmission spectra with different fabrication methods. The transmission spectrum of the

CH

3

NH

3

SnI

3

thin film fabricated by the SVE method (green), the CH

3

NH

3

PbI

3

thin film fabricated by SVE

method (red), 2-step solution method (orange), and antisolvent method (purple). The 50% transmission at the

1.58 THz is observed in the SVE sample. (c) The absorption coefficients of the thin films fabricated by the SVE

method (red), 2-step solution method (orange), and antisolvent method (purple). (d) The THz absorbance

fittings using the three resonance frequencies with 0.95, 1.58, and 1.87 THz.

(4)

www.nature.com/scientificreports www.nature.com/scientificreports/

normal direction to the Pb-I bond (Fig. 2b). At the mode at 1.87 THz, the vibration of the I atom along the Pb-I bond is shown (Fig. 2c). This is in good agreement with our THz measurements for the CH

3

NH

3

PbI

3

samples from the solution-based method and the previous theoretical results with vibration peaks near 1.0 and 2.0 THz.

By contrast, the vibration mode at 1.58 THz obtained herein for the sample fabricated by the SVE method does not appear in the IR simulation of tetragonal CH

3

NH

3

PbI

3

. It means that the atomic structure of 1.58 THz is different from the 0.95/1.87 THz absorption. To understand this different THz absorption, we need to see more details.

The THz absorption is different depending on the fabrication method. In general, the main reports for the CH

3

NH

3

PbI

3

thin film using the solution-prepared and vacuum-evaporated methods show a same atomic struc- ture, chemical state, and optical bandgap. This means that the origin of 1.58 THz absorption is not originated from the typical CH

3

NH

3

PbI

3

structure. In our previous report, we found the neutral molecular species, CH

3

NH

2

at the grain boundary in the thin film fabricated by the 2-step solution-prepared method

18,19

. From this finding, the surface morphology and chemical state of the antisolvent and SVE samples were further investigated and compared using atomic force microscopy (AFM) and x-ray photoelectron spectroscopy (XPS) (Fig. 3). The sur- face morphologies from the antisolvent and SVE samples are observed to exhibit the different features (Fig. 4a,b).

The size (density) of grain boundary of the SVE sample is smaller (denser) than that of the antisolvent sample.

Fabrication method ε

ω

0j

/2 π [THz] Ω

j

/2 π [THz] γ

j

/2 π [THz]

SVE method (Vacuum) 3

0.95 2.70 0.50

1.58 10.50 0.16

1.87 1.00 0.50

2-step method (Solution) 3

0.95 2.49 0.26

1.58 2.45 0.31

1.87 4.68 0.54

Antisolvent method (Solution) 3

0.95 3.68 0.23

1.57 1.09 0.15

1.87 7.60 0.57

Table 1. The THz absorption fitting results using the dielectric function of collection of Lorentz Oscillators with the standard thin-film approximation

24–26

.

Figure 2. (a) The comparison with simulated IR spectra result. The theoretical vibration modes of (b) 0.95 and

(c) 1.87 THz.

(5)

www.nature.com/scientificreports www.nature.com/scientificreports/

Moreover, the surface roughness is different as well. It means that the SVE sample has the larger density of grain boundary than the antisolvent sample. In the case of chemical state analysis, we found the different intensity ratio of CH

3

NH

2

in the C 1 s core-level spectra (Fig. 3c). Consistently, the CH

3

NH

2

intensity of N 1 s core-level in the SVE sample is larger than that in the antisolvent sample (Fig. 3d). We could not observe any different chemical state and intensity in the Pb 4 f and I 5d core-level spectra

18

. Only the different intensity area of CH

3

NH

2

chemical states between the two samples are observed. In the case of contaminations such as water and oxygen, also, we could not observed

18

.

Discussion

To have the quantitative analysis, we performed the XPS curve-fitting (Fig. 4a). We fitted C 1 s core-level spectra using Doniach-Sŭnjić curves convoluted with a Gaussian distribution of 0.5 eV FWHM

27

. Background due to inelastic scattering was subtracted by the Shirley (integral) method

28

. The different intensity area ratio between the antisolvent and SVE samples is found two times. The chemical shift with 0.3 eV in the SVE sample assumes to be a massive density of grain boundary made a more cation environment

29,30

. From these results, we assume the 1.58 THz absorption of the SVE sample is originated from the structural deformation in Pb-I bonding incorpo- rated with the molecular defect, CH

3

NH

2

neutral species

18,19

. And the SVE method can increase more density of CH

3

NH

2

molecular defect than the solution-based methods. In order to find the vibration mode at 1.58 THz, we further consider the structural change of the inorganic cage associated with the incorporation of CH

3

NH

2

instead of CH

3

NH

3+

cation. In the geometry-optimized structure of CH

3

NH

2

PbI

3

, the Pb-I cage is significantly distorted (or deformed) and different from that of tetragonal CH

3

NH

3

PbI

3

in the Pb-I bond distance and the I-Pb-I angle.

Figure 3. Surface morphology of (a) the antisolvent and (b) the SVE methods with 5 × 5 μ m

2

. The surface

roughness is 8.4 and 18.8 nm in the antisolvent and SVE methods, respectively. (c) C 1 s and (d) N 1 s core-level

spectra. The CH

3

NH

2

chemical states of the SVE sample are appeared with more intensity area.

(6)

www.nature.com/scientificreports www.nature.com/scientificreports/

Very interestingly, the IR simulation result shows a vibration mode near 1.58 THz (Fig. 4b). At the vibration mode at near 1.58 THz, the I atom between the Pb atoms vibrate in a complex way as shown in Fig. 4(b). This result shows that the vibration mode at 1.58 THz observed for the sample from the SVE method can be associated with the structural change of the Pb-I cage. This suggests that the incorporation of CH

3

NH

2

instead of CH

3

NH

3+

in CH

3

NH

3

PbI

3

will be one of the possible origins for the structural deformation of the Pb-I cage associated with the appearance of the vibration peak shown in the sample prepared with the SVE method.

In summary, we have measured and unraveled the strong absorption at 1.58 THz in CH

3

NH

3

PbI

3

thin film fabricated by the SVE method. The origin of the 1.58 THz absorption is due to the strong phonon resonance originated by the structural deformation incorporated with the molecular defect, CH

3

NH

2

at the grain boundary.

These findings are expected to allow a possibility of THz-based applications using OHP thin film fabricated by the SVE method. We believe that it requires to study more to understand a different property in a defect-incorporated hybrid perovskite structure.

Figure 4. (a) The C 1 s core-level curve-fittings fabricated by the antisolvent and SVE methods. The CH

3

NH

2

intensity ratio between the antisolvent and SVE methods is approximately 1:2. (b) Simulated IR spectra and

vibrational mode of near 1.58 THz for CH

3

NH

2

PbI

3

.

(7)

www.nature.com/scientificreports www.nature.com/scientificreports/

Methods

The sample preparation. The Al

2

O

3

substrates (made by Hi-Solar Co., Ltd.) are used for all sample prepa- rations. The surface orientation is C-plane(0001) with the off-angle of 0.2° ± 0.05°. The thickness and roughness are 430 ± 25 μm and Ra ≤ 0.3 nm, respectively. 1) Solution-prepared methods – [2-step solution method]

19

We performed spin-coating at 6000 rpm for 30 s on the sapphire substrates, previously heated at 70 °C. After the spin coating, the PbI

2

layer was dried at 70 °C for 20 min. Then, a 20 mg/ml methylammonium iodide (MAI) solu- tion in 2-propanol (IPA) was prepared and kept at 70 °C. PbI

2

film was dipped in the MAI solution for 30 s with gentle shaking of the substrates. After dipping, substrates were rinsed in copious IPA and dried immediately by spinning them on a spin coater, after which they were annealed for 20 min on the hot plate at 70 °C. [Anti-solvent method]

31

The CH

3

NH

3

PbI

3

perovskite layer was deposited under ambient conditions using the anti-solvent method. The precursor solution was made by mixing 461 mg PbI

2

(99.99%, TCI) and 159 mg methylammonium iodide (MAI, Dyesol) in 530 μL of DMF plus 73 μL of dimethylsulfoxide (DMSO). The solution was spin-coated at 2800 rpm for 25 s onto the substrate, and after 12 s spinning, 300 μL of diethyl ether were dripped onto the film.

The transparent film was transferred to a N

2

-filled box and annealed at 60 °C for 10 min and then at 100 °C for 20 min. (See the SFigs 1 and 2 in the Supplementary Material). 2) Vacuum-evaporated samples - The CH

3

NH

3

PbI

3

and CH

3

NH

3

SnI

3

thin films were formed by the sequential evaporation method

16,18,20

, a 100 nm layer of Lead(II) iodide (PbI

2

, Alfa Aesar, 99.999%) and Tin(II) iodide (SnI

2

, Alfa Aesar, 99.999%) was deposited on a respective Al

2

O

3

substrate followed by deposition of a 300 nm Methylammonium iodide (CH

3

NH

3

I, Dyesol) layer. And then the sample was loaded into the main chamber. The base pressure of chamber was maintained below 1.0 × 10

−6

Torr. (To see the detailed characterization, see the reference of

18

).

THz-TDS measurement. The THz transmission spectra were measured with a standard THz time-domain spectroscopy (THz-TDS) setup based on a femtosecond laser. (SFig. 3) A femtosecond Ti:sapphire laser (Mai Tai, Spectra-physics) which has 100 fs pulse width and 80 MHz repetition rate was divided into generation and detec- tion parts. We used optical rectification generation with 1 mm ZnTe (110) crystal and electro-optical sampling detection with 2 mm ZnTe crystal. Two THz lens were mounted between the parabolic mirrors for focusing the THz beam the size of 2 mm diameter. We measure the THz time domain signal in the spectral range from 0.2 up to 2.5 THz. The transmitted THz frequency domain spectrum were acquired by the fast Fourier transforms (FFT) to each time domain THz pulse waveform.

Theoretical calculations. For calculating IR and vibrational mode, we performed using density func- tional theory (DFT) as implemented in the code of the CASTEP. We used the On-the-fly norm-conserving pseudopotential generation in CASTEP (OTFG norm conserving) and the exchange-correlation functional of the spin-polarized Perdew-Burke-Ernzerhof expression revised for solids (PBEsol) in the generalized gradient approximation (GGA) in all cases. Electronic wave functions were expanded by plane waves with an energy cut-off of 990 eV. The geometry optimization of the tetragonal phase of CH

3

NH

3

PbI

3

for bulk at room tempera- ture were carried out until Hellmann-Feynman force acting on the atoms was smaller than 0.01 eV/Å without any symmetry constraint. For calculating infrared (IR) spectra and vibrational modes, we used density-functional theory (DFT) as implemented in the code of the VASP. We employed the projector augmented-wave method

32

for the electron-ion interactions and the spin-polarized Perdew-Burke-Ernzerhof expression revised for sol- ids (PBEsol) in the generalized gradient approximation (GGA) for the exchange and correlation interactions of electrons

33

. The electronic wave functions were expanded by plane waves with an energy cutoff of 450 eV.

The geometry optimization was carried out without any symmetry constraint until the Hellmann-Feynman forces acting on the atoms were smaller than 0.01 eV/Å. For the bulk phase at room temperature, we used the tetragonal CH

3

NH

3

PbI

3

structure, where the optimization of the cell volume and the atomic positions were per- formed

34

. And the CH

3

NH

2

PbI

3

structure with the incorporation of CH

3

NH

2

instead of CH

3

NH

3+

, we performed the optimization of the cell volume, the cell shape, and the atomic positions. To obtain the simulated IR spec- tra, we employed the finite difference method of the density-functional perturbation theory in VASP

35

and the PHONOPY package

36

. The k-space integration was carried out with a 3 × 3 × 3 Monkhorst-Pack k-point mesh in the Brillouin zone of the supercell. The simulated IR spectra were broadened by convolution of a 0.1 THz Lorentzian to give the better comparison with the experimental observations.

Thin film characterizations. All formed OHP thin films were characterized by atomic force microscopy (AFM) and x-ray photoelectron spectroscopy (XPS) using SPM-9700 (Shimadzu) and PHI5000 Versa ProbeII with a monochromated AlKα (ULVAC-PHI) to obtain the surface morphologies and chemical states, respectively.

References

1. Grätzel, M. The light and shade of perovskite solar cells. Nat. Mater. 13, 838–842 (2014).

2. Green, M. A., Ho-Baillie, A. & Snaith, H. J. The emergence of perovskite solar cells. Nat. Photonics 8, 506–514 (2014).

3. Loi, M. A. & Hummelen, J. C. Hybrid solar cells: Perovskites under the Sun. Nat. Mater. 12, 1087–1089 (2013).

4. Park, N.-G., Grätzel, M. & Miyasaka T. Organic-Inorganic Halide Perovskite Photovoltaics: From Fundamentals to Device Architectures Ch3, 53–79 (Springer, 2016).

5. Yoo, E. J. et al. Resistive Switching Behavior in Organic–Inorganic Hybrid CH3NH3PbI3\textminusxClx Perovskite for Resistive Random Access Memory Devices. Adv. Mater. 27, 6170–6175 (2015).

6. Huang, J., Shao, Y. & Dong, Q. Organometal Trihalide Perovskite Single Crystals: A Next Wave of Materials for 25% Efficiency Photovoltaics and Applications Beyond? J. Phys. Chem. Lett. 6, 3218–3227 (2015).

7. Stranks, S. D. & Snaith, H. J. Metal-halide perovskites for photovoltaic and light-emitting devices. Nat. Nanotechnol. 10, 391–402 (2015).

8. Parrott, E. S. et al. Effect of Structural Phase Transition on Charge-Carrier Lifetimes and Defects in CH3NH3SnI3 Perovskite. J.

Phys. Chem. Lett. 7, 1321–1326 (2016).

9. Wehrenfennig, C., Eperon, G. E., Johnston, M. B., Snaith, H. J. & Herz, L. M. High Charge Carrier Mobilities and Lifetimes in

Organolead Trihalide Perovskites. Adv. Mater. 26, 1584–1589 (2013).

(8)

www.nature.com/scientificreports www.nature.com/scientificreports/

10. Varadwaj, P. R. Methylammonium Lead Trihalide Perovskite Solar Cell Semiconductors Are Not Organometallic: A Perspective.

Helv. Chim. Acta 100 (2017).

11. Im, J.-H., Lee, C.-R., Lee, J.-W., Park, S.-W. & Park, N.-G. 6.5% efficient perovskite quantum-dot-sensitized solar cell. Nanoscale 3, 4088–4093 (2011).

12. Fu, Y. et al. Solution Growth of Single Crystal Methylammonium Lead Halide Perovskite Nanostructures for Optoelectronic and Photovoltaic Applications. J. Am. Chem. Soc. 137, 5810–5818 (2015).

13. Han, Q. et al. Single Crystal Formamidinium Lead Iodide (FAPbI3): Insight into the Structural, Optical, and Electrical Properties.

Adv. Mater. 28, 2253–2258 (2016).

14. Tomasino, A. et al. Wideband THz Time Domain Spectroscopy based on Optical Rectification and Electro-Optic Sampling. Sci. Rep.

3, 3116 (2013).

15. Quarti, C. et al. The Raman Spectrum of the CH3NH3PbI3 Hybrid Perovskite: Interplay of Theory and Experiment. J. Phys. Chem.

Lett. 5, 279–284 (2014).

16. Jung, M.-C., Raga, S. R. & Qi, Y. Properties and solar cell applications of Pb-free perovskite films formed by vapor deposition. RSC Adv. 6, 2819–2825 (2016).

17. Leyden, M. R. et al. High performance perovskite solar cells by hybrid chemical vapor deposition. J. Mater. Chem. A 2, 18742–18745 (2014).

18. Jung, M.-C. et al. Formation of CH 3 NH 2 -incorporated intermediate state in CH 3 NH 3 PbI 3 hybrid perovskite thin film formed by sequential vacuum evaporation. Appl. Phys. Express 12, 015501 (2019).

19. JUNG, M.-C. et al. The presence of CH 3NH 2neutral species in organometal halide perovskite films. Appl. Phys. Lett. 108, 073901 (2016).

20. Lee, Y. M. et al. Surface Instability of Sn-Based Hybrid Perovskite Thin Film, CH3NH3SnI3: The Origin of Its Material Instability. J.

Phys. Chem. Lett. 9, 2293–2297 (2018).

21. La-o-vorakiat, C. et al. Phonon Mode Transformation Across the Orthohombic–Tetragonal Phase Transition in a Lead Iodide Perovskite CH3NH3PbI3: A Terahertz Time-Domain Spectroscopy Approach. J. Phys. Chem. Lett. 7, 1–6 (2016).

22. Brivio, F. et al. Lattice dynamics and vibrational spectra of the orthorhombic, tetragonal, and cubic phases of methylammonium lead iodide. Phys. Rev. B 92, 144308 (2015).

23. Guzelturk, B. et al. Terahertz Emission from Hybrid Perovskites Driven by Ultrafast Charge Separation and Strong Electron–Phonon Coupling. Adv. Mater. 30, 1704737

24. D’Angelo, F., Mics, Z., Bonn, M. & Turchinovich, D. Ultra-broadband THz time-domain spectroscopy of common polymers using THz air photonics. Opt. Express 22, 12475–12485 (2014).

25. Tinkham, M. Energy Gap Interpretation of Experiments on Infrared Transmission through Superconducting Films. Phys. Rev. 104, 845–846 (1956).

26. Walther, M. et al. Terahertz conductivity of thin gold films at the metal-insulator percolation transition. Phys. Rev. B 76, 125408 (2007).

27. Doniach, S. & Sunjic, M. Many-electron singularity in X-ray photoemission and X-ray line spectra from metals. J. Phys. C Solid State Phys. 3, 285–291 (1970).

28. Shirley, D. A. High-Resolution X-Ray Photoemission Spectrum of the Valence Bands of Gold. Phys. Rev. B 5, 4709–4714 (1972).

29. Dietrich, P. M. et al. Amine species on self-assembled monolayers of ω-aminothiolates on gold as identified by XPS and NEXAFS spectroscopy. Surf. Interface Anal. 42, 1184–1187 (2010).

30. Song, X. et al. Effects of Protonation, Hydrogen Bonding, and Photodamaging on X-ray Spectroscopy of the Amine Terminal Group in Aminothiolate Monolayers. J. Phys. Chem. C 116, 12649–12654 (2012).

31. Ahn, N. et al. Highly Reproducible Perovskite Solar Cells with Average Efficiency of 18.3% and Best Efficiency of 19.7% Fabricated via Lewis Base Adduct of Lead(II) Iodide. J. Am. Chem. Soc. 137, 8696–8699 (2015).

32. Blöchl, P. E. Projector augmented-wave method. Phys. Rev. B 50, 17953–17979 (1994).

33. Perdew, J. P. et al. Restoring the Density-Gradient Expansion for Exchange in Solids and Surfaces. Phys. Rev. Lett. 100, 136406 (2008).

34. Stoffel, R. P., Wessel, C., Lumey, M.-W. & Dronskowski, R. Ab Initio Thermochemistry of Solid-State Materials. Angew. Chem. Int.

Ed. 49, 5242–5266

35. Kresse, G. & Furthmüller, J. Efficient iterative schemes for ab initio total-energy calculations using a plane-wave basis set. Phys. Rev.

B 54, 11169–11186 (1996).

36. Togo, A. & Tanaka, I. First principles phonon calculations in materials science. Scr. Mater. 108, 1–5 (2015).

Acknowledgements

This work was supported by funding from JSPS KAKENHI Grant No. 17K05033 (Japan) and Murata Science Foundation 2017 (Japan). Also, this work was supported by Basic Science Research Program (NRF- 2015R1C1A2A01054543, NRF- 2018R1D1A1B07042814, and NRF-2018R1D1A1B07047762) and Priority Research Center Program (2010-0020207) through the National Research Foundation of Korea (NRF) funded by the Ministry of Education and Global Research and Development Center Program (2018K1A4A3A01064272) through the NRF funded by the Ministry of Science and ICT in the Republic of Korea. This work was also supported by the 2018 sabbatical year research grant of the University of Seoul (B.D.Y.). The authors would like to acknowledge Mr. Anjar Taufik Hidayat who is a Ph.D. candidate in Lab. for Organic Electronics (NAIST) for the AFM measurement of SVE samples and Associate Professor Leigh McDowell (NAIST) for valuable suggestions in revising the manuscript.

Author Contributions

M.-C.J. conceived the idea, designed the experiments and supervised the project. I.M., Y.M.L. performed a major portion of sample preparation and characterization. C.K. and C.-S.K. supported the THz-TDS measurement. J.P., B.D.Y. and S.H. performed all of theoretical calculation works. S.R.R., L.K.O., Y.Q. supported and characterized all of solution-prepared samples. All authors discussed the results, performed data analysis and explanation, wrote the manuscript and revised it.

Additional Information

Supplementary information accompanies this paper at https://doi.org/10.1038/s41598-019-42359-8.

Competing Interests: The authors declare no competing interests.

Publisher’s note: Springer Nature remains neutral with regard to jurisdictional claims in published maps and

institutional affiliations.

(9)

www.nature.com/scientificreports www.nature.com/scientificreports/

Open Access This article is licensed under a Creative Commons Attribution 4.0 International License, which permits use, sharing, adaptation, distribution and reproduction in any medium or format, as long as you give appropriate credit to the original author(s) and the source, provide a link to the Cre- ative Commons license, and indicate if changes were made. The images or other third party material in this article are included in the article’s Creative Commons license, unless indicated otherwise in a credit line to the material. If material is not included in the article’s Creative Commons license and your intended use is not per- mitted by statutory regulation or exceeds the permitted use, you will need to obtain permission directly from the copyright holder. To view a copy of this license, visit http://creativecommons.org/licenses/by/4.0/.

© The Author(s) 2019

Figure 2. (a) The comparison with simulated IR spectra result. The theoretical vibration modes of (b) 0.95 and  (c) 1.87 THz.
Figure 3.  Surface morphology of (a) the antisolvent and (b) the SVE methods with 5 × 5  μ m 2
Figure 4. (a) The C 1 s core-level curve-fittings fabricated by the antisolvent and SVE methods

参照

関連したドキュメント

Octn1 gene knockout mice (octn1 −/− ) have been constructed and exhibit a marked reduction in small- intestinal absorption, tissue distribution in various organs, and

Immunohisto- chemical analysis of the LSECs using an anti-SE-1 antibody confirmed that marked staining was found along the sinusoids in zone 3 surrounding the central vein in both

peak height of Pt in flameless atomic absorption spectrophotometry... Influence height

Comparing the Gauss-Jordan-based algorithm and the algorithm presented in [5], which is based on the LU factorization of the Laplacian matrix, we note that despite the fact that

Using general ideas from Theorem 4 of [3] and the Schwarz symmetrization, we obtain the following theorem on radial symmetry in the case of p > 1..

Then it follows immediately from a suitable version of “Hensel’s Lemma” [cf., e.g., the argument of [4], Lemma 2.1] that S may be obtained, as the notation suggests, as the m A

II Midisuperspace models in loop quantum gravity 29 5 Hybrid quantization of the polarized Gowdy T 3 model 31 5.1 Classical description of the Gowdy T 3

Thus, for an mp-small knot K , thin position must equal bridge position.. an embedding of K 1 that is not in bridge position.) It follows that this embedding of K 1 cannot be in