: Evidence from Japanese Firms
journal or
publication title
International review of business
number
17
page range
1-26
year
2017-03
1. Introduction
An increasing body of research on corporate governance has been paying considerable attention to controlling shareholders with large stakes (such as family owners, governments, and corporations) that hold power over corporate management and could therefore gain private benefits through, for example, self-dealing or receiving managerial compensation. These findings lead to the argument that potential private benefits could shift controlling shareholders’ interests away from minority shareholder value and thereby generate a conflict of interest between shareholders (McConnell and Servaes, 1990; Shleifer and Vishny, 1997; La Porta et al., 1999).
In this study, we use evidence from Japanese acquisitions of publicly traded firms to address the question of whether controlling shareholders exert power to pursue their own interests at the expense of minority shareholders in the deal pricing process. The common parent-subsidiary structure in close business groups in Japan provides a good opportunity to
Evidence from Japanese Firms
Hiroyuki AMAN*
Abstract
This paper investigates the determinants of takeover premiums to help clarify the conflict of interests between controlling and minority shareholders. We employ a unique Japanese dataset of deals, known as stock-for-stock exchanges (kabushiki koukan), in which parent companies often transform partly owned subsidiaries into fully owned subsidiaries. First, we find that takeover premiums decrease non-linearly with the acquiring firms’ ownership stake. This finding indicates that the presence of controlling shareholders with large holdings, such as parent firms, harms minority shareholders. Second, blockholders are likely to reduce the takeover price, though only at a marginally significant level. This is consistent with the collusion hypothesis, where blockholders form a coalition with the acquirer decrease minority shareholders benefits. Finally, our findings weakly and partly support the notion that preexisting personnel relationships negatively affect minority shareholders.
Keywords: corporate governance, takeover premiums, controlling shareholders
assess the conflict of interest between parent firms with large controlling interests and minority shareholders.1 Parent firms in Japan frequently have a multifaceted relationship with their subsidiaries and perform diverse functions such as providing raw materials, selling final goods, and dispatching directors to the subsidiary’s board. There is thus the potential for an opportunistic parent firm to pursue its own interests by exploiting its dominant status as a controlling shareholder, a large customer, and/or top management.
The mergers and acquisitions (M&A) deals in our sample use stock-for-stock exchanges (kabushiki koukan in Japanese), in which parent firms purchase shares in the subsidiary from minority shareholders to freeze them out and create a wholly owned subsidiary. Including many cases of parent-subsidiary M&A allows us to investigate the potential effect of the presence of controlling shareholders on corporate governance because the takeover price is a direct measure of the distribution of pecuniary interests among shareholders. Accordingly, if acquirers with a high level of ownership were highly motivated to pursue their own interests at the expense of minority shareholders, the takeover price would be lower, thereby reflecting the influence of the parent company.
Our study yielded several main findings. First, our empirical evidence clearly indicates that the takeover premium tends to be smaller when the acquiring firm holds a relatively large ownership of the target firm. This finding is consistent with the hypothesis of conflict of interests between controlling and minority shareholders, and important because the well-established parent-subsidiary structure in Japan can induce friction between the parent company’s interests and those of minority shareholders in the subsidiary. Furthermore, blockholders are likely to express friendliness to the acquirer by agreeing to sell their shares at a lower price, albeit with marginal statistical significance, partly consistent with their collusion with acquirers. Finally, the results partly support the presence of the hazardous effects of preexisting personnel relationships on premiums. The implication of this finding is that the close ties found within Japanese corporate groups may be less favorable for outside shareholders.
The main contribution of our analysis is its additional evidence for the conflict of interests between controlling and minority shareholders using a unique dataset consisting of Japanese takeover deals with a large number of parent-subsidiary cases. To our best knowledge, while a sizeable literature on M&A deals exists, very few studies have specifically investigated parent firms’ acquisition of subsidiary firms (Slovin and Sushka, 1998). As mentioned earlier, the vertical structure of parent-subsidiaries in Japanese 1 According to “Japanese Corporate Groups in 2003” published by Toyo Keizai, the Hitachi Group had
33 publicly held subsidiaries, Mitsubishi Electric and NEC each have 12, Toshiba has nine, Matsushita Electric Industrial has six, and Sony Electronics has two.
corporate groups is an ideal setting for shedding light on potential frictions in ownership structure. Because the takeover price is a direct measure of wealth transfers from an acquirer to the target shareholders, it should reflect the influence of the parent firm in the bargaining process. While past studies of the M&A market, including in Japan, focus on the wealth effects of acquisitions and consistently find positive abnormal returns around M&A announcements, we know little about how wealth is divided among the various shareholders (Pettway and Yamada, 1986; Kang et al., 2000; Lin et al., 2008; Inoue, 2010).
As an alternative, researchers can examine the price responses of acquiring and target firms around takeover announcements (Slovin and Sushka, 1998). The method may be suitable to assess whether a deal is economically efficient in the total valuation generated for both parties. However, our research focuses more heavily on the distribution of wealth among parties involved in deals, and we thus rely on analysis of the premium and leave price response analyses for future research. As a reference for the economic efficiency of takeover deals in Japan, Inoue (2010) demonstrates that both acquirers and target firms experience positive excess returns around the deal announcements.
Further, the Japanese corporate group is a valuable context for examining how the wider scope of business relationships between parties affects deals. Several existing studies on the parent-subsidiary structure exclusively examined the effect of ownership by parents (see Slovin and Sushka (1998) for mergers and Slovin and Sushka (1997) and Vijh (2006) for equity financing). Specifically, our study extends the literature on controlling shareholders by examining the impact of blockholder ownership and the multifaceted relationships between parent and subsidiary firms, including personnel and transactional relationships within corporate groups.
The remainder of this paper proceeds as follows. Section 2 presents the main empirical hypotheses concerning the potential conflict of interests between shareholders. Section 3 describes the sample. Section 4 presents the results of the empirical analysis and Section 5 presents our conclusions.
2. Hypothesis development
2.1 Conflict of interest between controlling and minority shareholders
Recent research on corporate governance increasingly focuses on a specific type of block shareholder, “controlling shareholders,” and their significant influence on major management decisions. In particular, researchers explore the potential for controlling shareholders to exercise their power to pursue their own interests at the expense of minority shareholders, taking advantage of the discrepancy in cash flow rights and ownership. This situation arises because some relationships could serve as instruments for transferring corporate resources to controlling groups. Executive appointments from the controlling group and business trade
with corporations affiliated with the controlling shareholders are typical (Shleifer and Vishny, 1997; La Porta et al., 1999).
The seminal cross-country work by La Porta et al. (1999) offers a deep examination of ownership structures—including cross-shareholdings, multiple classes of voting rights, and pyramidal organizations in major developed countries—and presents evidence of the presence of controlling shareholders, including families and governments. Subsequently, a growing body of research has conducted similar cross-country analyses (La Porta et al., 2000; Faccio and Lang, 2002; Claessens et al., 2000; Claessens et al., 2002). Some studies focus on the effects of a specific type of controlling shareholder on firm value, for example, family ownership in Anderson and Reeb (2003), state ownership in Wei et al. (2005), and dual-class shareholders in Gompers et al. (2010). However, despite this large body of literature on governance-performance relationships obtained by disentangling complex ownership structures, the impact of controlling shareholders on how wealth is distributed between controlling and other shareholders is relatively unexplored.
2.2 Takeover deals in Japan (kabushiki koukan)
The 1999 amendment of the commercial law in Japan enabled firms to create wholly owned subsidiaries by paying with shares (stock-for-stock exchange, or kabushiki koukan in Japanese). In Japanese corporate groups, parent firms commonly hold part of the shares of a subsidiary. Therefore, one purpose of the new legal framework was to effectively restructure group management strategy, including returning a subsidiary from public to private ownership. Before the introduction of the new framework, parent firms had little choice besides accumulating shares in a subsidiary from the market through cash payments to create a wholly owned subsidiary. As expected, an increasing number of firms have conducted takeovers employing the new legal framework. As a notable example, Matsushita Electric Industrial (now Panasonic Corporation) states in its disclosure documentation that its aim in acquiring two subsidiaries, Matsushita Electronic Components and Matsushita Battery Industrial, was to maximize firm value by constructing and pursuing the strategy of operating divisions. Likewise, Sony Corporation, which converted its subsidiary, Aiwa, to a wholly owned subsidiary, stated in its disclosure document that its aims were to accelerate the restructuring of its electronics business divisions in the Sony group and pursue group synergy.
In the revised takeover procedure framework, an acquiring firm first proposes a takeover plan to the target firm. The board of directors of each firm must then approve any plan that includes a share exchange ratio as a major term. The share exchange ratio is determined based on calculations by third parties such as audit firms, security houses, and accounting offices. Finally, two-thirds of shareholders with voting rights in both the target and
acquiring firms must then endorse the agreement.2 As such, the deals entail negotiations between both firms to reach an agreement, which differs from competitive shareholder biddings such as tender offers.
In this paper, our approach to measuring the severity of the conflict of interests differs from that in prior studies on controlling shareholders that exclusively examine the effect on firm valuation and operating performance. The primary motivation of the acquisitions we focus on is potential enhancements to operational efficiency the corporate organization. However, another important aspect is that the process of bargaining over the takeover price, where shareholders’ interests could vary, directly depends on the outcome of the agreement. Thus, a conflict between shareholders could emerge in the pricing process. More specifically, if a large shareholder holds management control and tends to use its power to appropriate the value created by the M&A, the controlling shareholder will most likely pay a lower price.
Our major research interest is in how the controlling shareholder, like a parent company, influences the distribution of wealth. In the stock-for-stock exchange deals we employ here, a parent company can directly intervene in the target’s decision-making process in the board and shareholders meetings through ownership, personnel relationships, and transactional relationships. On the other hand, there is little room for shareholders to participate in the formal negotiation or approval process in the case of tender offers. Further, the M&A literature offers extensive documentation that various other factors like the competitiveness of potential bidders, interdependency of target shareholders’ decision making, managerial hostility, ownership structure, and thereby, the probability of success or failure due to the competitive bidding structure in which numerous investors are involved inevitably affect tender offers.3 This situation can affect the premium value the acquirer pays. In sum, our focus on takeovers with negotiations is suitable context to glean insights on controlling shareholder influence.
2.3 Parent-subsidiary structure in Japan
In the new form of takeovers of Japanese firms in our sample, the acquirer is frequently the target’s parent firm. In this regard, corporate groups, known as keiretsu, are a common form of corporate organization in Japan. Member firms enjoy close ties through block ownership, cross-shareholdings, and business relationships. Further, a main bank in the group commonly provides a variety of corporate-financing services such as meeting large 2 When the size of the target firm is very small relative to the acquiring firm, approval from the acquirer
is not necessarily required.
3 See, for example, Walking (1985), Cotter and Zenner (1994), Betton and Eckbo (2000), and Henry
lending requirements. This main bank also helps monitor the member firms.
These intimate connections between group members have a significant role in corporate governance and finance. For instance, several studies examine the positive aspects of a corporate group on firm performance in terms of alleviating information asymmetry. In this regard, Aoki (1995) conceptually describes the wider range of main banks’ monitoring roles. Past empirical studies also examine the influence of governance structure on corporate behavior and firm valuations in Japan. Hoshi et al. (1990) find that main banks and corporate groups financially tied to them help sustain the investments of distressed firms. Fukuda and Hirota (1996) find that main banks alleviate the agency costs of debt financing. Lichtenberg and Pushner (1994) show the positive impact of financial institutions and the negative impact of non-financial corporate ownership on production efficiency. In contrast, Morck et al. (2000) and Hiraki et al. (2003) find a negative effect of main bank relationships on firm value. More closely related to our study is that by Kang et al. (2000), which reports that bank relationships are positively associated with the wealth effects of bidder firms in Japanese takeovers.
One aspect of Japanese corporate groups that we consider is the parent-subsidiary relationship, such as that between a carmaker and assemblers. In fact, in our total sample, and according to the formal criteria of the Japanese Commercial Code (ownership of 50% or more of the shareholdings), approximately 60% of the takeovers are related to parent-subsidiary cases. The parent firm manifests its control in several ways, such as equity ownership, personnel relationships, and business transactions. First, the parent firm’s substantial ownership of the subsidiary enables it to exert influence. For voting matters, Japanese commercial law mandates that normal resolutions submitted to shareholders’ meetings require passage by a majority vote. Special resolutions require the approval of a two-thirds majority or more.4
For arm’s length deals in which an acquirer has no ex ante connection to the target, the takeover price should not be associated with any conflict of interest with the target’s shareholders and should thus be determined purely by the valuation of the target. However, in our Japanese takeover setting, acquirers can exert power to reduce the takeover price depending on the extent of ownership control. In the U.S. context, Slovin and Sushka (1998) find that M&A transactions generate positive abnormal returns for both the parent and the subsidiary, suggesting that the conflict of interest is less severe in these cases. In contrast, Moeller (2005) shows that large management ownership has a negative impact on 4 Normal resolutions include activities such as nominating directors and auditors, determining remuneration,
and approving accounting statements. Special resolutions include amendments to the company’s articles, removal of directors and auditors, and merger approval.
takeover price, which suggests that the target shareholders bear the burden of the cost of managerial ownership. This leads to our key hypothesis in examining the conflict of interest in these firms.
Hypothesis 1 (Ownership effect of controlling shareholders): Takeover premiums decrease with ownership by the acquiring firm.
The second means of control relates to personnel connections. Here, a person previously employed by the parent firm is often appointed as a board director in the subsidiary. Thus, it is possible that directors dispatched by the parent firm act in the interests of the parent firm rather than that of the subsidiary, because their future career prospects may depend on the parent firm’s evaluations.
In this regard, Kaplan and Minton (1994) find that CEO turnover is likely to occur following the appointment of outside directors from banks or corporations, while Kang and Shivdasani (1995) suggest that for firms more closely tied to the corporate group, CEO turnover is a more common response to poor performance. Likewise, Morck and Nakamura (1999) find that the probability of a bank-appointed director is significantly associated with firm performance. These studies all imply that the corporate group’s influence could discipline the firm to enhance corporate value. However, these existing arguments do not distinguish among the differing interests of shareholder groups. We hypothesize that personnel relationships influence the takeover price negatively, thereby favoring controlling shareholders, in order to test the negative influence of the relationships on general investors outside corporate groups. Support for the hypothesis would suggest that the corporate group’s influence from the presence of a personnel relationship acts against the interests of minority shareholders.
Hypothesis 2 (Personnel connection effect): Takeover premiums decrease when personnel relationships exist between the acquiring and target firms prior to deals.
The third means of control is through trade relationships between the parent firm and the subsidiary, typically in product purchases or sales. If the parent firm is a monopolistic provider of materials essential for the subsidiary’s products or if it is a monopsonistic purchaser of goods provided by the subsidiary, the parent firm could place the subsidiary under some degree of control by threatening to discontinue providing or purchasing commodities. Hence, the dominant business bargaining position may lead to the exploitation of minority interests in any takeover deal.
Hypothesis 3 (Trade relationship effect): Takeover premiums decrease when business trade relationships exist between the acquiring and target firms prior to deals.
2.4 Influence of blockholders
This study also considers the influence of blockholders besides the acquiring firms in the target firm’s ownership structure because blockholders’ cooperation should be essential in reaching an agreement. Some prior theoretical research examines two side effects of the relationship between controlling shareholders and other blockholders (see, for example, Shleifer and Vishny, 1986; Zwiebel, 1995; Bennedsen and Wolfenzon, 2000).
The first of these effects is the monitoring hypothesis, which argues that blockholders have the capacity to monitor controlling shareholders’ extraction of private benefit. A shareholder composition that includes blockholders should ameliorate the free-rider problem of monitoring among shareholders compared to more diversified ownership structures. If blockholders’ monitoring incentives work, then blockholders should restrain the controlling shareholder from pursuing private interests. Thus, the presence of a controlling shareholder is not necessarily linked with the sacrifice of minority shareholders’ interests. In our takeover case, the positive association of a larger blockholding with a higher takeover premium would support the monitoring hypothesis.
The alternative effect is the collusion hypothesis. In a concentrated ownership structure with a small number of blockholders, it may be easier for the acquiring firm to collude with blockholders and increase its control and lowering the takeover price. It would then share the benefits from the lower price among the participants in the collusion. However, since the blockholders involved in the collusion will bear the loss directly through a lower takeover price, there must be some indirect compensation. In the Japanese keiretsu system, member firms commonly have multifaceted relationships with each other, which satisfies the necessary condition for collusion. To share profits, acquiring firms with existing business connections with the colluding member could provide benefits by selling or purchasing products (or services) in deals that favor the colluding member. A friendly shareholder relationship is also a potential source of profit sharing. If cross-shareholding exists, the acquiring firm could also compensate the colluding member firm through favorable shareholder voting (see Kester, 1991, Ch. 3).
In a related study, Faccio et al. (2001) find that in Western Europe, dividend payout ratios are higher in firms with multiple large shareholders. This finding supports the monitoring hypothesis, although the result is reversed in East Asia. Maury and Pajuste (2005) use several shareholder contestability measures to examine Finnish firms and report that firms tended to be highly valued when they displayed a more equally distributed ownership structure among blockholders. In our analysis, we test the following hypotheses
to reflect these competing blockholding effects.
Hypothesis 4A (Collusion effect): Blockholder ownership has a negative impact on takeover premiums.
Hypothesis 4B (Monitoring effect): Blockholder ownership has a positive impact on takeover premiums.
3. Data and variables
3.1 Data sources
We obtained detailed data on takeover deals from the Timely Disclosure Network (TDnet) database provided by the Tokyo Stock Exchange (TSE). TDnet records all official disclosure documents for investors. We manually collected the corporate data from acquiring firms’ official disclosure documents released on the TSE. These documents usually contain very important information such as exchange rates and business relationships between acquirers and targets. To identify recent deals, we collected additional capital acquisition records from the Nomura Research Institute database. The total sample covers the acquisitions of publicly traded targets from January 1999 to December 2010. We collected financial statement data from the Corporate Financial Databank provided by the Japan Economic Research Institute and the Nikkei Financial Quest. To complement the recent data on ownership for the sample period from April 2004 to April 2010, we used the large shareholder database of the Nikkei Economic Electronic Database System (NEEDS). We obtained stock price data from Nikkei Media Marketing. We removed deals involving unquoted acquiring firms from the sample, along with those involving commercial banks, security houses, and insurance companies. Our final sample consists of 255 deals for publicly traded targets.
3.2 Takeover premiums
We define the takeover premium as the ratio of the takeover price to target firm value (PREMIUM). The takeover price is computed by multiplying the stock price of the acquiring firm over 20 trading days before takeover announcement (about four weeks), by the exchange ratio. We measure the value of the target per share by the 20-day pre-announcement average market stock price.
3.3 Acquirer ownership
In the baseline model, we use acquirer’s ownership prior to the takeover (OWN), which presupposes a proportional increase in the acquirer’s control with ownership. As for the level of control in the capital relationship, Japanese commercial law defines a company that
holds a majority of voting rights as the parent firm. Of the entire sample of 255, 137 cases (58%) are in an ex ante parent-subsidiary structure. We construct this variable from the disclosure documents for the acquisition announcement officially released on the TSE.
3.4 Blockholder ownership
We construct three variables to capture the potential influence of blockholders besides the acquiring firm and banks: BLOCK1 is the ratio of the largest shareholder’s ownership to the remaining ownership after deducting the acquirer’s ownership percentage, and BLOCK2 and BLOCK3 are the cumulative ownership ratios of the second and third largest shareholders, respectively. For example, we assume a target firm with shareholders A (ownership = 40%), B (30%), C (20%), and D (10%) (total ownership = 100%). Now, when A is the acquirer and B, C, and D are the other blockholders, BLOCK1 is 30% / (100% − 40%) * 100 = 50%, BLOCK2 is (30% + 20%) / (100% − 40%) * 100 = 83.3%, and BLOCK3 is (30% + 20% + 10%) / (100% − 40%) * 100 = 100%. We obtain the ownership data from the Corporate Financial Databank and Nikkei NEEDS. Because there are different acquirer ownership values reported in the disclosure documents and the large shareholders databases for several deals, likely due to the difference in accounting periods or measurement timings, we use the values from the latter dataset to compute block ownership.
To consider the bank-firm relationships common in Japanese corporate governance, we include Bank Ownership as a separate variable from the other blockholders defined above and define it as the ownership of the three largest bank shareholders. As we noted earlier, a main bank is usually both the largest creditor to and shareholder of the members of a corporate group. According to prior studies, its monitoring activity has a positive effect on firm valuation or corporate behaviors (Hoshi et al., 1990; Fukuda and Hirota, 1996, Kang et
al., 2000). Consequently, if a bank has a monitoring in line with the overall shareholders’ interests, the takeover premium increases with bank ownership. However, if a bank behaves in the acquirer’s interests, we expect a reverse relationship.
3.5 Personnel and trade relationships
The personnel relationships variable (PERSON) takes a value of 1 if we find any personnel relationship, such as a director dispatched from the acquiring firm to the target firm, in the disclosure documents, and 0 otherwise. We expect that this indicator variable will negatively correlate with the takeover premium if the acquiring firm’s reinforced influence through the personnel relationship leads to a more detrimental effect on the bargaining position of the target firm.
The trade relationship variable (TRADE) takes a value of 1 if any business dealing appears in the disclosure documents, and 0 otherwise. A typical description of a trade
relationship is the supply and/or purchase of products (or services) between the acquirer and target firms. When the acquirer has a dominant position over the target firm through business dealings, the acquirer may take advantage of this position and influence the takeover price for its own benefit. Therefore, we expect a negative correlation between the trade relationship variable and the takeover premium.5
3.6 Other control variables
The purpose of other measures is to control for the increased liquidity and publicity of a stock following a deal. As in Ang and Kohers (2001), we first construct a stock exchange conversion indicator using the stock exchange listing as follows. We categorize the shares listed on major markets, namely, the TSE First (large companies) and Second (mid-sized companies) Sections, as high liquidity and publicity stocks. This is justified by the fact that both the Tokyo Price Index (TOPIX) and Nikkei 225, the most widely used stock indexes in the Japanese market, only include stocks listed on the TSE. We then categorize the remaining stocks listed on regional- and emerging firm-oriented exchanges as low liquidity and publicity stocks. The liquidity variable (Stock Exchange) takes a value of 1 if a non-TSE listed stock is exchanged for a TSE stock, -1 if a TSE listed stock is exchanged for a non-TSE listed stock, and 0 otherwise. Further, to assess the impact of liquidity at the firm-level, we calculate the turnover rate (Turnover) by the average ratio of the daily trading volume to the number of all shares.
For operational synergy effects where the target and acquirer operate in a similar industry, we construct an indicator taking a value of 1 if an acquirer is categorized in the same industry as the target using the Nikkei medium-level industry code (Industry Matching). The conventional literature on takeovers predicts that potentially greater synergistic gains increase takeover prices, although the empirical evidence is not consistent (e.g., Morck et
al., 1990; Sawyer and Shrieves, 1994; Singh and Montgomery, 1987; Slusky and Caves, 1991). Following numerous previous studies, we focus on the relatedness of business operations between the acquirer and target firms as a key factor in synergies and specifically utilize the industry-matching indicator as a control variable.
We also include measures of profits, sales growth, and leverage as several target’s financial variables in the regression. We define the target firm’s profitability (Target Profits) as the current net profits normalized by asset size. For growth prospects, we use target’s sales growth (Sales Growth) defined as the change in sales relative to the previous year and log-transform the value to adjust for any extremely high values. We expect that a higher 5 Because some of the firms in our sample do not disclose information on personnel and trade
takeover premium when the target firm has better financial performance. Likewise, to capture the risks of financial distress, we define target’s leverage (Leverage) as total debt over total assets. When a firm in financial distress is the target of a rescue, the target firm has reduced bargaining power, which should lead to a lower agreed takeover price. We also include the acquirer’s profitability to control for financial performance (Acquirer Profits). We measure the relative scale variable (Relative Scale) by the natural log of the ratio of total assets in the target firm to that in the acquiring firm. In general, we expect that a higher relative scale enhances scale economies and thus increases the takeover premium. We also add the volatility of stock returns to capture the risk of the target share (Volatility) defined as the log of the standard deviation of daily returns over the 250 trading days before the deal’s announcement. Finally, we include year dummies.
4. Results and discussion
4.1 Descriptive statistics
Table 1 provides the descriptive statistics for the sample. The mean value of PREMIUM is 112% and the median is 108%. Accordingly, on average, the takeover premium adds about 10% to the market price of the target firm. Acquirer ownership prior to takeovers, OWN, ranges widely from 0% to 97% with an average of 45% and a median of 50%. These results mean that acquirers hold nearly half of the shares in the target firms. Some
Table 1. Summary statistics
VARIABLE No. of Obs. Mean Median Minimum Maximum S.D.
PREMIUM (%) 255 112.066 108.378 55.133 311.010 24.705 OWN (%) 255 45.134 50.150 0.000 97.790 24.752 BLOCK1 (%) 255 16.789 10.375 1.293 76.160 15.270 BLOCK2 (%) 255 23.413 16.850 2.221 78.950 17.010 BLOCK3 (%) 255 27.395 22.071 2.221 80.380 17.462 Bank Ownership (%) 255 6.387 5.810 0.000 26.461 5.632 Industry Matching 255 0.576 1.000 0.000 1.000 0.495 Stock Exchange 255 0.427 0.000 -1.000 1.000 0.504 Turnover 255 0.004 0.003 0.000 0.029 0.004 Relative Scale 255 0.186 0.085 0.001 7.274 0.503 Acquirer Profits 255 0.005 0.013 -0.691 0.137 0.069 Targets Profits 255 -0.017 0.010 -1.880 0.406 0.149 Leverage 255 0.574 0.576 0.061 2.203 0.272 Sales Growth 255 0.145 -0.005 -0.761 17.338 1.479 Volatility 255 3.250 2.974 0.038 9.706 1.524 PERSON 204 0.877 1.000 0.000 1.000 0.329 TRADE 204 0.868 1.000 0.000 1.000 0.340
Table 2. Correlation matrix [1] [2] [3] [4] [5] [6] [7] [1] Premium (%) 1.000 [2] OWN (%) 0.074 1.000 [3] BLOCK1 (%) 0.000 -0.327 1.000 [4] BLOCK2 (%) 0.005 -0.322 0.966 1.000 [5] BLOCK3 (%) 0.017 -0.313 0.941 0.991 1.000 [6] Bank Ownership -0.030 -0.028 -0.259 -0.290 -0.308 1.000 [7] PERSON -0.008 0.462 -0.114 -0.148 -0.156 0.141 1.000 [8] TRADE -0.078 0.235 -0.043 -0.080 -0.088 0.091 0.472 observations with extremely high acquirer ownership are probably due to open market purchases and/or tender offers prior to stock-for-stock exchanges. There are 28 observations with 0% shareholding by acquiring firms. This finding indicates that the acquiring firm sometimes takes over a target without an ex ante capital relationship, rather than freezing out minority shareholders through the takeover deal itself. Using 50% ownership as the cutoff point, of the 225 targets, approximately 137 have a parent-subsidiary relationship. In terms of blockholder ownership, the results for BLOCK1, BLOCK2, and BLOCK3 in Table 1 indicate that the largest blockholder besides the acquirer has an average of 16% ownership (the median is 10%); including the three largest shareholders, this percentage increases to 27% of blockholdings (the median is 22%).
4.2 Univariate comparisons 4.2.1 Correlation matrix
Next, we provide an overview of the univariate comparisons. Table 2 presents the correlation coefficient matrix. Here, we briefly describe the premiums and key variables of our main interests. We can see only weak positive correlations between acquirer ownership (OWN) and the premium variables (PREMIUM) (coeff. = 0.074), which, without considering control variables, does not support the hypothesis that an increase in acquirers’ control leads to the exploitation of minority interests. There is a negative correlation between PERSON (or TRADE) and the premium, but on a small scale, which likewise does not support the hypothesis that these acquirers use these business relationships to exploit minority shareholders. Each blockholding measure, BLOCK1, BLOCK2, and BLOCK3 show only very small correlations with PREMIUM, providing no conclusive evidence for collusion between the acquirer and the other large shareholders. Lastly, the correlation between bank ownership (Bank Ownership) and PREMIUM is unclear due to the marginal size of the correlation coefficient.
Table 3. Takeover premium by acquiring firm ownership
Acquirer
Ownership Takeover Premium
No. of Obs. Mean S.E.
OWN=0% 28 112.231 2.768 OWN>0% 227 112.046 1.706 Difference 0.185 t-value=0.0373 OWN<50% 118 110.970 1.584 OWN>=50% 137 113.011 2.539 Difference -2.042 t-value=-0.6573 OWN<66% 210 111.415 1.553 OWN>=66% 45 115.108 4.957 Difference -3.694 t-value=-0.9099
OWN indicates the percentage of acquirer ownership for target firm. 4.2.2 Univariate comparisons by acquirer ownership
Table 3 presents the univariate test results for the takeover premium categorized according to the acquirer’s ownership level. The cutoff points are 0%, 50% (absolute majority), and 66% (two-thirds majority). An interesting pattern in the results is that the magnitude of the difference in premiums among ownership categories tends to change depending on the cutoff point. For instance, at the 0% threshold, the average takeover premium for the subsample with 0% ownership is slightly larger than for the subsample with ownership above 0% (112.23% and 112.04%, respectively). The smaller premium for greater acquirer ownership is consistent with the conflict of interest hypothesis, although the t-statistics suggest that the difference is not statistically significant. The subsample at the 50% threshold shows a reverse in the magnitude of the difference, and the average premium for lower acquirer ownership is smaller than that for larger acquirer ownership, although the difference is not statistically significant. At the 66% threshold, the same pattern emerges, but we still cannot reject the null hypothesis of zero difference statistically. Overall, the results do not indicate statistically clear conclusions, but they demonstrate the possibility that the ownership-premium relationship is not simply linear. Therefore, we fit several nonlinear forms of regression with several control variables.
4.3 Regression results
We now consider a multivariate regression in order to control for a variety of factors. Table 4 presents the cross-sectional regression results for the determinants of the takeover premium. We employ a weighted least squares (WLS) regression, in which the weight is the mean squared error of residuals from the market model using the daily stock returns of the acquiring firms and TOPIX returns to avoid potential heteroscedasticity.6 The dependent variable in the regressions is the takeover premium (PREMIUM) and the independent variables are acquirer ownership (OWN) as our principal focus, blockholder ownership (BLOCK1, BLOCK2, and BLOCK3), and other control variables. Overall, the adjusted R-squared values are more than around 20% and the F-values are sufficiently large enough to reject the null hypothesis that all slope coefficients are jointly zero. These statistics suggest that our fitted specification is valid. As a simple function form, when fitting the linearity of acquirer ownership (OWN) on premium in Models 1, 2, and 3, the estimated coefficients of OWN are all negative and statistically significant at the 10% level. The estimated coefficients are around -0.1.
The weak statistical significance suggests somewhat inconclusive effects of the ownership variable; therefore, we run regressions with alternative functional forms displayed in Table 5. When we transformed acquirer ownership to the logarithm form, ln (OWN), the estimated coefficients had negative signs in Models 4, 5, and 6.7This is consistent with the conflict of interest hypothesis and suggests that the negative effect of ownership is smaller when ownership is higher. For the quadratic curve models in Models 1, 2 and 3, the coefficients of the first-order term (OWN) are all negative, and those of the second-order term (OWN2) are all significantly positive. This finding supports the hypothesis of conflict of interest between controlling and minority shareholders (Hypothesis 1: Ownership effect of controlling shareholders), particularly for the relatively lower ownership region. It is then likely that acquirers with high levels of ownership, such as parent firms, exert control in the subsidiary’s decision-making and thus act against the interests of minority shareholders. In the region with higher OWN, an incremental ownership by the acquirer has a smaller influence on the premium.
The estimation results for blockholdings show that BLOCK1, BLOCK2, and BLOCK3 have a negative impact on premiums, although with marginal statistical significance. This negative correlation is not consistent with the monitoring hypothesis (Hypothesis 4B: Monitoring effect) such as in Maury and Pajuste (2005), who found that contestability 6 Specifically, we use daily returns over 250 trading days from t = -5 to -254, with t = 0 as the
announcement date.
7 More precisely, we specify ln(OWN) as the natural logarithm of OWN plus one to account for the
Table 4. Regression results of the relationship between ownership and takeover premiums Model 1 2 3 OWN -0.1137* -0.1111* -0.1066* [-1.84] [-1.80] [-1.73] BLOCK1 -0.0943 [-0.99] BLOCK2 -0.0738 [-0.88] BLOCK3 -0.0573 [-0.70] Bank Ownership 0.0482 0.0419 0.0536 [0.19] [0.16] [0.20] Industry Matching 0.1221 0.1158 0.1385 [0.05] [0.04] [0.05] Stock Exchange 1.2675 1.3224 1.294 [0.46] [0.48] [0.47] Turnover 0.0882 0.0795 0.0813 (x 103) [0.18] [0.16] [0.16] ln(Relative Scale) -1.586 -1.605 -1.6366 [-1.48] [-1.50] [-1.53] Acquirer Profits -34.0261 -33.7359 -34.0809 [-1.07] [-1.06] [-1.07] Target Profits -8.7999 -8.866 -8.9603 [-0.97] [-0.97] [-0.98] Leverage -25.6840*** -25.7629*** -25.8068*** [-4.59] [-4.60] [-4.60] ln(Sales Growth) 3.4112 3.4337 3.4653 [0.80] [0.80] [0.81] ln(Volatility) -1.325 -1.26 -1.2786 [-0.72] [-0.68] [-0.69] Constant 127.4261*** 127.3357*** 126.8792*** [12.17] [12.04] [11.90] adj. R2 0.232 0.231 0.230 F-value 4.488*** 4.475*** 4.457*** No. of obs. 255 255 255
The dependent variable is the takeover premium (PREMIUM). We estimate the weighted least square regressions where the weight is the mean squared error of residuals from the market model using the daily stock returns of the acquiring firms and TOPIX returns. Year dummies are included but not shown. The t-values are in square brackets. The symbols, ***, **, *, indicate statistical significance at 1%, 5%, and 10%, respectively.
Table 5. Regression results with quadratic and log-transformed ownership Model 1 2 3 4 5 6 OWN -0.6168*** -0.6246*** -0.6182*** [-3.36] [-3.36] [-3.30] OWN2 60.6531*** 61.6492*** 61.3497*** (× 10-4) [2.90] [2.92] [2.89] ln(OWN) -2.6610** -2.6397** -2.5494** [-2.31] [-2.28] [-2.20] BLOCK1 -0.1723* -0.1267 [-1.77] [-1.30] BLOCK2 -0.1511* -0.1053 [-1.74] [-1.21] BLOCK3 -0.1359 -0.0881 [-1.60] [-1.04] Bank Ownership 0.223 0.2009 0.2066 0.1013 0.0873 0.0958 [0.86] [0.76] [0.78] [0.39] [0.33] [0.37] Industry Matching -0.2155 -0.2785 -0.2968 -0.1048 -0.1364 -0.125 [-0.08] [-0.11] [-0.12] [-0.04] [-0.05] [-0.05] Stock Exchange 1.244 1.4024 1.428 1.1091 1.2097 1.2068 [0.46] [0.52] [0.53] [0.41] [0.44] [0.44] Turnover 0.0262 0.0052 0.0035 0.068 0.0551 0.0564 (x 103) [0.05] [0.01] [0.01] [0.14] [0.11] [0.11] ln(Relative Scale) -2.5034** -2.5328** -2.5703** -1.9901* -2.0062* -2.0301* [-2.27] [-2.30] [-2.33] [-1.82] [-1.83] [-1.85] Acquirer Profits -45.3381 -44.791 -45.2353 -39.4953 -39.005 -39.2491 [-1.44] [-1.42] [-1.44] [-1.24] [-1.23] [-1.23] Target Profits -4.8206 -4.8574 -5.0692 -8.0336 -8.1131 -8.2672 [-0.53] [-0.53] [-0.56] [-0.88] [-0.89] [-0.91] Leverage -24.6637*** -24.8287*** -24.9963*** -25.5968*** -25.7135*** -25.8021*** [-4.47] [-4.50] [-4.52] [-4.59] [-4.61] [-4.62] ln(Sales Growth) 3.7584 3.8036 3.8736 3.4065 3.4373 3.4855 [0.89] [0.90] [0.92] [0.80] [0.80] [0.82] ln(Volatility) -0.3399 -0.1729 -0.1717 -1.0232 -0.9294 -0.9524 [-0.18] [-0.09] [-0.09] [-0.56] [-0.51] [-0.52] Constant 130.3298*** 130.8528*** 130.7884*** 130.2732*** 130.4304*** 130.0404*** [12.59] [12.49] [12.35] [12.28] [12.14] [11.97] adj. R2 0.256 0.256 0.254 0.238 0.238 0.236 F-value 4.796*** 4.790*** 4.760*** 4.614*** 4.601*** 4.575*** No. of obs. 255 255 255 255 255 255
The dependent variable is the takeover premium (PREMIUM). We estimate the weighted least square regressions where the weight is the mean squared error of residuals from the market model using the daily stock returns of the acquiring firms and TOPIX returns. Year dummies are included but not shown. The t-values are in square brackets. The symbols, ***, **, *, indicate statistical significance at 1%, 5%, and 10%, respectively.
among multiple large shareholders leads to higher valuations. Rather, the finding weakly indicates the potential for collusion between the acquirer and blockholders (Hypothesis 4A: Collusion effect). One possible reason for this collusive behavior is that blockholders may benefit from business transactions with the acquirer to compensate for the higher discount on the takeover price and/or in order to gain favorable support from the acquirer as a large shareholder. Such arrangements are more likely in a corporate group with close member firm connections via cross-shareholdings and business transactions. The estimated coefficient for Bank Ownership shows insignificant signs, and we thus confirm neither monitoring effects nor collusive effects for general shareholders’ interests. Unlike the effect of blockholdings by nonfinancial corporate shareholders, banks might be more independent of acquirers than other types of blockholders.
We briefly summarize the other results from the control variables here. The synergy variable Industry Matching has insignificant signs, suggesting an ambiguous effect of operational relatedness between parties on premiums. Regarding the liquidity effect, all coefficients for stock exchange conversion (Stock Exchange) have positive but insignificant signs. Trading turnover rate (Turnover) also shows ambiguous results. Collectively, these findings do not support the notion that the target firm’s shareholders are willing to accept a lower takeover price when the exchange of stock delivers other types of benefits from the increase in liquidity and/or publicity. The relative scale variable (Relative Scale) has negative and significant coefficients in several models. This finding is inconsistent with the notion of economic gains from scale economies, suggesting that the acquirer might be more willing to pay, probably because the total payment to target shareholders is negligible when large firms acquire small targets. The earnings performance of the acquirer and target (Acquirer Profits and Target Profits) has only an insignificant impact on the takeover premium. The target firms’ debt ratio (Leverage) has a negative impact, which is consistent with our predictions about the financial risk effect. The coefficients of Sales Growth and
Volatility exhibit only insignificant effects.
4.4 Further analysis
4.4.1 Personnel and trade relationships
Table 6 shows the estimation results of the regression model including the personnel and trade relationship variables. The coefficients of personnel relationship (PERSON) are positive but very insignificant. Therefore, the straightforward inclusion of PERSON yields unclear outcomes in Models 1, 2, and 3. However, once we add the cross-effects of PERSON with acquirer ownership to consider the interactive effects between capital and personnel relationships, somewhat different outcomes emerge in Models 4, 5, and 6. The coefficients of PERSON have positive and significant signs in Models 5 and 6. The
Table 6. Regression results for the takeover premium, including the person and trade variables Model 1 2 3 4 5 6 OWN -0.0744 -0.6794*** 0.1281 -0.5019* [-0.95] [-2.76] [0.65] [-1.79] OWN2 67.4707** 82.0794*** (× 10-4) [2.58] [3.10] ln(OWN) -2.429 0.1478 [-1.54] [0.05] BLOCK1 -0.1037 -0.2093* -0.145 -0.0932 -0.2243* -0.1457 [-0.96] [-1.84] [-1.29] [-0.84] [-1.93] [-1.25] PERSON -0.0521 4.3817 2.1707 8.7574 17.0987** 17.6862* [-0.01] [0.73] [0.36] [1.16] [2.19] [1.96] TRADE -6.576 -4.1872 -6.3432 -11.3432 -8.7471 -14.7646 [-1.26] [-0.80] [-1.22] [-1.37] [-1.08] [-1.49] OWN -0.3330* -0.4592** -6.9042** × PERSON [-1.83] [-2.52] [-2.26] OWN 0.0934 0.0914 2.9589 × TRADE [0.59] [0.60] [0.99] adj. R2 0.213 0.238 0.22 0.22 0.256 0.234 F-value 3.295*** 3.531*** 3.382*** 3.200*** 3.588*** 3.386*** No. of obs. 204 204 204 204 204 204
The dependent variable is the takeover premium (PREMIUM). We estimate the weighted least square regressions where the weight is the mean squared error of residuals from the market model using the daily stock returns of the acquiring firms and TOPIX returns. Year dummies are included but not shown. The t-values are in square brackets. The symbols, ***, **, *, indicate statistical significance at 1%, 5%, and 10%, respectively. In Model 6, OWN × PERSON and OWN × TRADE mean lnOWN × PERSON and lnOWN × TRADE, respectively. Only the results of key variables are reported and the others are not shown for brevity.
cross-term (OWN × PERSON) shows negative and significant signs in Models 4, 5 and 6. Collectively, these findings suggest that personnel relationships may enhance premiums, possibly due to the expected large synergetic gains; however, when acquirers have larger ownership, these relationships likely decrease premiums. These outcomes partially support prior arguments that appointments of directors from affiliated corporations are related to corporate governance in Japan (Kaplan and Minton, 1994; Morck and Nakamura, 1999). Further, our finding suggests that the influence of affiliated managers (e.g., a director dispatched from a parent company) can harm general shareholders’ interests when affiliated companies hold large ownership. In conclusion, the results only partly or conditionally support Hypothesis 2 (Personnel connection effect), which predicts a negative influence from personnel connections on the premium.
The trade relationship variable (TRADE) shows a negative but weak coefficients overall. Even after including the interaction between TRADE and ownership, the coefficients of TRADE are insignificant, and the coefficients of the cross-term of TRADE and ownership are positive but insignificant. Hence, overall, the results are inconclusive for Hypothesis 3 (Trade relationship effect), which predicts that the dominant position in trade relationships drives the negotiation process in an unfavorable direction from the minority shareholders perspective.8
4.4.2 Alternative specifications of acquirer ownership
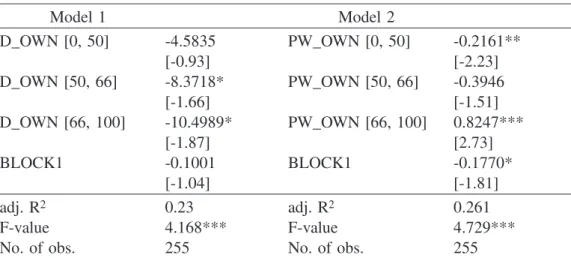
We conducted several additional analyses to examine the possibility of a nonlinear relationship between acquirer ownership and takeover premium. For this purpose, we employed several transformed ownership variables as alternatives, including binary variables with threshold points, and a piecewise model to distinguish the differential marginal impacts of ownership more precisely. We construct three dummy variables taking the threshold points of 0%, 50%, and 66% to look closely at the change of premium level by ownership categories. D_OWN [0, 50] takes a value of 1 if OWN > 0% and OWN < 50%, and 0 otherwise. Note that in this specification, when OWN equals 0, it takes a value of 0. Therefore, this indicator captures the difference between closely tied and arm’s length deals, where the acquirer has no capital relationship with the target prior to the deal. D_OWN [50, 66] takes a value of 1 if 50% <_ OWN < 66%, and 0 otherwise, and D_OWN [66, 100] takes a value of 1 if OWN >_ 66%, and 0 otherwise. In Table 7, Model 1 shows that D_ OWN [0, 50] has a negative but insignificant coefficient and D_OWN [50, 66] has a negative and significant coefficient. This finding suggests that the presence of a parent firm is detrimental for minority shareholders in that parent firms can exert their influence to extract benefits by setting a low takeover price. The coefficient of D_OWN [66, 100] shows negative coefficients that are slightly lower than those of D_OWN [50, 66], which suggests that an acquirer with ownership of 66% or more tends to pay less to target shareholders.
To check the change in the slope coefficient of the premium by ownership category, we estimate a piecewise regression model by setting 50% and 60% as the threshold points to allow for different slopes over the three regions of OWN. More specifically, the specification of the piecewise transformed ownership, PW_OWN [#, #], is as follows:
8 To consider possible multicollinearity between PERSON and TRADE, we repeated the regressions after
including one and removing the other. The results were similar to those using both variables simultaneously.
PW_OWN[0, 50] = OWN if OWN < 50%
= 50% if OWN >_ 50%
PW_OWN[50, 66] = 0% if OWN < 50%
= OWN − 50% if OWN >_ 50% and OWN < 66% = 66% − 50% if OWN >_ 66%
PW_OWN[66, 100] = 0% if OWN < 66%
= OWN − 66% if OWN >_ 66%
In Model 2, PW_OWN [0, 50] has negative and significant signs, which suggest that the region with less than half of the majority voting rights leads to an overall negative impact of OWN on takeover premiums. However, the relationship for the middle region PW_OWN [50, 66] is ambiguous, and that for the upper region PW_OWN [66, 100] contradicts the conflict of interest hypothesis, suggesting that acquirer ownership benefits minority interests. Taken together, the statistically marginal estimates of OWN reported in our baseline model with the simple linear specification could be a result of the inconsistent slope coefficients
Table 7. Regression results with alternative forms of acquirer ownership
Model 1 Model 2 D_OWN [0, 50] -4.5835 PW_OWN [0, 50] -0.2161** [-0.93] [-2.23] D_OWN [50, 66] -8.3718* PW_OWN [50, 66] -0.3946 [-1.66] [-1.51] D_OWN [66, 100] -10.4989* PW_OWN [66, 100] 0.8247*** [-1.87] [2.73] BLOCK1 -0.1001 BLOCK1 -0.1770* [-1.04] [-1.81] adj. R2 0.23 adj. R2 0.261 F-value 4.168*** F-value 4.729***
No. of obs. 255 No. of obs. 255
The dependent variable is the takeover premium (PREMIUM). We estimate the weighted least square regressions where the weight is the mean squared error of residuals from the market model using the daily stock returns of the acquiring firms and TOPIX returns. Year dummies are included but not shown. The t-values are in square brackets. The symbols, ***, **, *, indicate statistical significance at 1%, 5%, and 10%, respectively. For Model 1, the dummy variables of acquirer ownership are used. For Model 2, the piece-wise regressions are used. Only the results of key variables are reported and the others are not shown for brevity.
across different ownership domains. For the region with less than 50% voting rights, the actual influence on managerial decision-making substantially increases with ownership, and this may lead to a high cost reflected in the premium. Meanwhile, for the region with more than 50% of voting rights, the influence may increase only slowly because incremental ownership is superfluous given the one-half majority rule in shareholders’ meetings.
4.4.3 Robustness check
To lend greater credence to the key results presented so far, we perform several additional estimations.9 To begin, we discuss an alternative explanation for the observed negative impacts of acquirer ownership on premiums by looking at synergetic gains as seemingly the most influential explanation. Suppose that investors expect more incremental gains in synergy in a deal with an arm’s length relationship (lower OWN) compared to a deal with a parent-subsidiary structure (higher OWN), because the stock price in the latter may already fully incorporate the benefits of corporate group relationships prior to takeovers. We predict that if the operational synergy effects drive the observed negative ownership-premium relationship, ownership should have a greater effect on premiums when the expected synergetic gains are larger. Fully quantifying synergies can be difficult to test empirically; nevertheless, we proxy a relatedness metric using the industry matching variable (Industry Matching), to minimize the potential influence of the alternative view. We can test this prediction by adding the cross-term for OWN and Industry Matching to the baseline regressions. The result indicate that the cross-term has positive but insignificant coefficients and that OWN still has negative and significant coefficients in the quadratic OWN models. Hence, we find support for our primary hypothesis, even after controlling for the synergy-related effect to some extent.
We alternatively specify the dependent variables by modifying the premium measurement interval from 20 trading days to five and 60 trading days. Next, as an alternative to direct ownership (OWN), we change the indirect ownership effect via other affiliated group firms, although it is impossible to fully disentangle the complicated ownership network because of limited data availability. Only some sample firms (26) reveal an indirect ownership percentage in the documents disclosed to the TSE. Finally, as an alternative means to control for heteroscedasticity in WLS, we compute the White-adjusted robust standard errors using ordinary least squares (OLS). Regardless of these efforts, our overall results remain qualitatively unchanged. This confirms that our core conclusion is reasonably robust.
For blockholder variables, we repeat the regressions using another broadly defined blockholding covering both non-bank and bank ownership because we observed that the 9 The details of results are not tabulated here to save space.
coefficients of bank ownership are overall insignificant in the baseline results. The results indicate that the statistical significance of blockholders increases compared with that in the baseline results, particularly suggesting again that large blockholders tend to adopt a friendly attitude to acquirers, irrespective of the shareholders’ identity (financial or non-financial company).
5. Conclusion
Studies in the recent literature on corporate governance have increasingly focused on the presence of controlling shareholders in the ownership structure, with the presumption that they may use their influence to pursue their own interests at the expense of minority shareholders. This study investigates the determinants of takeover premiums to shed light on the potential for conflict of interests between controlling and minority shareholders.
In 1999, Japan amended its commercial law to facilitate corporate group restructuring. Since then, an increasing number of firms conducted acquisitions using the new takeover framework. In M&A deals in Japan, it is common for a parent firm with a dominant status in the corporate group to take over a subsidiary to freeze out any minority shareholders. Therefore, this situation provides the opportunity to examine the impact of controlling shareholders on minority interests because we can consider the takeover price as a direct transfer of wealth from the acquirer with a controlling block to the minority shareholders on the target side. We conduct an empirical analysis of publicly held targets and report results from several viewpoints related to the conflict of interest hypothesis.
First, the acquiring firm’s ownership of equity in the target firm before the takeover deal reduces the takeover premiums, and the influence seems to be nonlinear. This finding supports the argument that a conflict of interests exists between the parent company and minority shareholders. It is then likely that parent firms exert their influence as controlling shareholders to transfer wealth from minority shareholders to themselves in the bargaining process. Personnel relationships tend to decrease premiums interactively with acquirers’ ownership level. These findings are partly consistent with the hypothesis that controlling shareholders are capable of benefitting from their multifaceted connections with the firm. We also found that blockholder ownership has a negative relationship with the takeover premium, although with low statistical significance. Hence, this finding weakly supports the collusion hypothesis that blockholders have an incentive to form a coalition with the acquiring firm at the expense of minority shareholders and share the profits extracted with the acquiring firm.
Acknowledgement
Earlier versions of this paper were presented at The Japan Society of Monetary Economics, Japan Association for Applied Economics, the 5th National Taiwan University International Conference on Economics, Finance and Accounting, and Monetary Economics Workshop (MEW). I would like to thank participants in the conferences and seminars for the useful comments. This work was partly supported by JSPS KAKENHI Grant Numbers JP16730129, JP26380415.
References
Anderson, Ronald C., and David M. Reeb, 2003, Founding-family ownership and firm performance: Evidence from the S&P 500, Journal of Finance 58, 1301-1328.
Ang, James, and Ninon Kohers, 2001, The take-over market for privately held companies: The us experience, Cambridge Journal of Economics 25, 723-748.
Aoki, Masahiko, 1995, Monitoring characterisitcs of the main bank system: An analytical and developmental view, in Masahiko Aoki, and Hugh Patrick, eds.: The Japanese main bank system: Its relevance for developing and transforming economies (Oxford University Press).
Bennedsen, Morten, and Daniel Wolfenzon, 2000, The balance of power in closely held corporations, Journal of Financial Economics 58, 113-139.
Betton, Sandra, and B. Espen Eckbo, 2000, Toeholds, bid jumps, and expected payoffs in takeovers, The Review of Financial Studies 13, 841-882.
Claessens, Stijn, Simeon Djankov, Joseph P. H. Fan, and Larry H. P. Lang, 2002, Disentangling the incentive and entrenchment effects of large shareholdings, Journal of Finance 57, 2741-2771.
Claessens, Stijn, Simeon Djankov, and Larry H. P. Lang, 2000, The separation of ownership and control in East Asian corporations, Journal of Financial Economics 58, 81-112.
Cotter, James F., and Marc Zenner, 1994, How managerial wealth affects the tender offer process, Journal of Financial Economics 35, 63-97.
Faccio, Mara, and Larry H. P. Lang, 2002, The ultimate ownership of western European corporations, Journal of Financial Economics 65, 365-395.
Faccio, Mara, Larry H. P. Lang, and Leslie Young, 2001, Dividends and expropriation, American Economic Review 91, 54-78.
Fukuda, Atsuo, and Shin’ichi Hirota, 1996, Main bank relationships and capital structure in japan, Journal
of the Japanese and International Economies10, 250-261.
Gompers, Paul A., Joy Ishii, and Andrew Metrick, 2010, Extreme governance: An analysis of dual-class firms in the United States, Review of Financial Studies 23, 1051-1088.
Henry, Darren, 2004, Corporate governance and ownership structure of target companies and the outcome of takeovers, Pacific-Basin Finance Journal 12, 419-444.
Hiraki, Takato, Hideaki Inoue, Akitoshi Ito, Fumiaki Kuroki, and Hiroyuki Masuda, 2003, Corporate governance and firm value in japan: Evidence from 1985 to 1998, Pacific-Basin Finance Journal 11, 239-265.
Hoshi, Takeo, Anil Kashyap, and David Scharfstein, 1990, The role of banks in reducing the costs of financial distress in japan, Journal of Financial Economics 27, 67-88.
Inoue, Kotaro, 2010, Do M&As in japan increase shareholder value?, in Yasuyoshi Kurokawa, ed.: M&A for value creation in japan (World Scientific).
Kang, Jun-Koo, and Anil Shivdasani, 1995, Firm performance, corporate governance, and top executive turnover in japan, Journal of Financial Economics 38, 29-58.
Kang, Jun-Koo, Anil Shivdasani, and Takeshi Yamada, 2000, The effect of bank relations on investment decisions: An investigation of Japanese takeover bids, Journal of Finance 55, 2197-2218.
Kaplan, Steven N., and Bernadette A. Minton, 1994, Appointments of outsiders to Japanese boards: Determinants and implications for managers, Journal of Financial Economics 36, 225-258.
Kester, Carl, 1991. Japanese takeovers: The global contest for corporate control (Harvard Business School Press).
La Porta, Rafael, Florencio Lopez-de-Silanes, and Andrei Shleifer, 1999, Corporate ownership around the world, Journal of Finance 54, 471-517.
La Porta, Rafael, Florencio Lopez-de-Silanes, Andrei Shleifer, and Robert Vishny, 2000, Investor protection and corporate governance, Journal of Financial Economics 58, 3-27.
Lichtenberg, Frank R., and George M. Pushner, 1994, Ownership structure and corporate performance in japan, Japan and the World Economy 6, 239-261.
Lin, Bing-Xuan, David Michayluk, Henry R. Oppenheimer, and Sean F. Reid, 2008, Hubris amongst japanese bidders, Pacific-Basin Finance Journal 16, 121-159.
Maury, Benjamin, and Anete Pajuste, 2005, Multiple large shareholders and firm value, Journal of Banking and Finance 29, 1813-1834.
McConnell, John J., and Henri Servaes, 1990, Additional evidence on equity ownership and corporate value, Journal of Financial Economics 27, 595-612.
Moeller, Thomas, 2005, Let’s make a deal! How shareholder control impacts merger payoffs, Journal of Financial Economics 76, 167-190.
Morck, Randall, and Masao Nakamura, 1999, Banks and corporate control in japan, The Journal of Finance 54, 319.
Morck, Randall, Masao Nakamura, and Anil Shivdasani, 2000, Banks, ownership structure, and firm value in japan, The Journal of Business 73, 539-567.
Morck, Randall, Andrei Shleifer, and Robert W. Vishny, 1990, Do managerial objectives drive bad acquisitions?, The Journal of Finance 45, 31-48.
Pettway, Richard H., and Takeshi Yamada, 1986, Mergers in japan and their impacts upon stockholder’s wealth, Financial Management 15, 43-52.
Sawyer, Granville M., Jr., and Ronald E. Shrieves, 1994, Stockholder returns among homogeneous groups of mergers, Journal of Financial Research 17, 45-63.
Shleifer, Andrei, and Robert W. Vishny, 1997, A survey of corporate governance, The Journal of Finance 52, 737-783.
Shleifer, Andrei, and Robert W. Vishny, 1986, Large shareholders and corporate control, The Journal of Political Economy 94, 461-488.
Singh, Harbir, and Cynthia A. Montgomery, 1987, Corporate acquisition strategies and economic performance, Strategic Management Journal 8, 377-386.
Slovin, Myron B., and Marie E. Sushka, 1997, The implications of equity issuance decisions within a parent-subsidiary governance structure, Journal of Finance 52, 841-857.
Slovin, Myron B., and Marie E. Sushka, 1998, The economics of parent-subsidiary mergers: An empirical analysis, Journal of Financial Economics 49, 255-279.
Slusky, Alexander R., and Richard E. Caves, 1991, Synergy, agency, and the determinants of premia paid in mergers, Journal of Industrial Economics 39, 277-296.
Vijh, Anand M., 2006, Does a parent-subsidiary structure enhance financing flexibility?, Journal of Finance 61, 1337-1360.
Walkling, Ralph A., 1985, Predicting tender offer success: A logistic analysis, The Journal of Financial and Quantitative Analysis 20, 461-478.
Wei, Zuobao, Feixue Xie, and Shaorong Zhang, 2005, Ownership structure and firm value in china’s privatized firms: 1991-2001, Journal of Financial and Quantitative Analysis 40, 87-108.
Zwiebel, Jeffrey, 1995, Block investment and partial benefits of corporate control, Review of Economic Studies 62, 161-185.

![Table 2. Correlation matrix [1] [2] [3] [4] [5] [6] [7] [1] Premium (%) 1.000 [2] OWN (%) 0.074 1.000 [3] BLOCK1 (%) 0.000 -0.327 1.000 [4] BLOCK2 (%) 0.005 -0.322 0.966 1.000 [5] BLOCK3 (%) 0.017 -0.313 0.941 0.991 1.000 [6] Bank Ownership -0.030 -0.028 -](https://thumb-ap.123doks.com/thumbv2/123deta/8171589.1273688/14.773.83.704.773.969/table-correlation-matrix-premium-block-block-block-ownership.webp)

![Table 4. Regression results of the relationship between ownership and takeover premiums Model 1 2 3 OWN -0.1137* -0.1111* -0.1066* [-1.84] [-1.80] [-1.73] BLOCK1 -0.0943 [-0.99] BLOCK2 -0.0738 [-0.88] BLOCK3 -0.0573 [-0.70] Bank Ownership 0.0482 0.0419 0.0](https://thumb-ap.123doks.com/thumbv2/123deta/8171589.1273688/17.773.73.696.166.872/table-regression-results-relationship-ownership-takeover-premiums-ownership.webp)
![Table 5. Regression results with quadratic and log-transformed ownership Model 1 2 3 4 5 6 OWN -0.6168*** -0.6246*** -0.6182*** [-3.36] [-3.36] [-3.30] OWN 2 60.6531*** 61.6492*** 61.3497*** (× 10 -4 ) [2.90] [2.92] [2.89] ln(OWN) -2.6610** -2.6397** -2.54](https://thumb-ap.123doks.com/thumbv2/123deta/8171589.1273688/18.773.89.707.163.874/table-regression-results-quadratic-log-transformed-ownership-model.webp)
![Table 6. Regression results for the takeover premium, including the person and trade variables Model 1 2 3 4 5 6 OWN -0.0744 -0.6794*** 0.1281 -0.5019* [-0.95] [-2.76] [0.65] [-1.79] OWN 2 67.4707** 82.0794*** (× 10 -4 ) [2.58] [3.10] ln(OWN) -2.429 0.1478](https://thumb-ap.123doks.com/thumbv2/123deta/8171589.1273688/20.773.80.705.461.844/table-regression-results-takeover-premium-including-person-variables.webp)