Shuji Akagi a and Sayaka Kihara b
Background
Inadequate sleep is known to be related to obesity-related diseases and also considered to be associated with dietary nutrition intake. Tracked dietary patterns have been reported which show that lifestyle during adolescence may be a determinant of overweight status and sleep behavior in adulthood. Thus, it is important to confirm the relationship between sleep behavior and dietary nutrition intake in younger individuals.
Objective
The aim of this study was to clarify the influence of ingested nutrients on poor sleep behavior. Participants
We examined 177 university students from a sample of 187 (43 males, 144 females), with ages ranging from 18︲24 years.
Measurable outcome
The Pittsburgh Sleep Quality Index (PSQI) was used to assess sleep behavior. Dietary intake was evaluated using a self-administered diet history questionnaire. Based on the PSQI results, the participants were divided into the favorable and unfavorable groups, and the amounts of nutrient intake were compared between them. Results
Although none of the specific nutrients surveyed showed a relationship with poor sleep quality or long sleep latency, students with short sleep duration consumed a significantly lower amount of soluble fiber, as shown by multivariate analysis.
Conclusion
Our findings suggest that ingestion of soluble dietary fiber may be desirable for obtaining an adequate sleep time and prevention of obesity-related diseases. Nevertheless, additional studies including a longitudinal investigation are required to confirm our findings.
Keywords : Pittsburgh Sleep Quality Index, Self-administered diet history questionnaire, Short sleep dura-tion, Soluble fiber
Introduction
Sleep inadequacy is an emerging public health problem and has been shown to be associated with weight gain, as well as obesity-related diseases such as diabetes, hypertension, dyslipidemia, and cardio-vascular disease ﹇1︲3﹈. Since energy intake is a
a ︲
b ︲ ︲ ︲
Association between Subjective Sleep and Dietary Intake in
University Students
Copyright© 2018 by Chugokugakuen
http://www.cjc.ac.jp/
Corresponding author : Shuji Akagi
Department of Human Nutrition, Faculty of Contemporary Life Science, Chugokugakuen University, Niwase 83, Kitaku, Okayama, 701︲0197, Japan TEL : + 81 86 293 0247 Fax : + 81 86 293 2798
several studies have examined the association between sleep duration and total energy intake, and generally found an association between short sleep duration and higher total calorie intake ﹇4﹈. As for nutrients, a Japanese study of middle-aged women indicated that poor sleep quality was significantly associated with high carbohydrate intake ﹇5﹈. More recently, a meta- analysis that included up to 14,906 participants from Europe and the United States ﹇6﹈ showed a signifi-cant association between shorter sleep duration and higher saturated fatty acid intake in younger men and women between 20 and 64 years of age, as well as with higher levels of carbohydrates, lower total fat, and lower polyunsaturated fatty acid levels in older women aged 65︲80. However, results from studies that assessed the relationship between nutrient intake and sleep duration are inconsistent.
Previous findings have revealed that both body weight and body composition during adolescence are important determinants of overweight status in adult-hood ﹇7, 8﹈. Moreover, a large population longitudinal study performed in Great Britain indicated that an energy-dense, high fat, and low fiber dietary pattern during adolescence was prospectively associated with increased and excess adiposity in adulthood ﹇9﹈. Accordingly, for dealing with public health problems, it is crucial to confirm the influence of dietary nutri-ents on sleep behavior in younger individuals such as university students, and for preparing countermeasure strategies for preventing overweight conditions and obesity-related diseases such as diabetes, hypertension, and cardiovascular disease, as well as other medical conditions.
In the present study, to clarify which nutrients contribute to the deterioration of sleep behavior, we examined the association between dietary nutrient in-take and sleep behavior, including sleep quality, onset latency, and duration, using a subjective evaluation method.
Materials and methods
Participants
A total of 187 students (43 males, 144 females; age range 18 to 24 years) enrolled in a department for registered dietitians at a university in Hiroshima prefecture, Japan, participated in this cross-sectional
cluded from analysis; use of medication with known effects on sleep or daytime alertness (n=8), self- reported extremely low calorie intake (<600 kcal) (n=1), and incomplete answers to the questionnaires (n=1). The final cohort included in the subsequent analysis comprised 177 students. This study was con-ducted in July 2015.
Evaluation of dietary nutrients
A self-administered diet history questionnaire (DHQ) was used to assess quantities of dietary nutri-ents ingested by the participants during the previous month. Details of the DHQ and its validity have been previously reported ﹇10, 11﹈. Briefly, the DHQ is a 16︲page structured questionnaire with items relating to the consumption frequency of a total of 150 foods and beverages commonly consumed by the general Japanese population. Dietary intake in terms of energy and selected nutrients was estimated by applying an ad hoc computer algorithm to the 150 foods and beverag-es of the DHQ and the Standard Tablbeverag-es of Food Com-position in Japan ﹇12﹈. It has been well established that habitual alcohol consumption and smoking influ-ence sleep behavior, but those were not evaluated be-cause none of the participants had a history of either. Assessment of subjective sleep
Subjective sleep was assessed using the Japanese version of the Pittsburgh Sleep Quality Index (PSQI)
﹇13﹈, which is a self-administrated questionnaire that
examines sleep difficulty retrospectively for a one-month period, with a global score (PSQIS) ranging from 0 to 21, with a higher PSQIS value indicating a lower quality of sleep ﹇13, 14﹈. By use of the ques-tionnaire, the participants reported bedtime, sleep onset latency (SOL), and rise times, from which we also calculated total sleeping time (TST) by subtract-ing sleep onset time from rise time. Accordsubtract-ing to the PSQI findings, the 177 participants were divided into the good PSQIS group, including those with a score 6, or the poor PSQIS group, which included participants with a score 5. Participants were also classified into the short SOL group ( 30 minutes) or prolonged SOL group ( 31 minutes), and into the good TST group (>7 hours) or the short TST group (<7 hours), using the above-mentioned calculation methods.
Anthropometric assessment
Height and body weight were measured to the nearest 0.1 cm and 0.1 kg respectively, with the par-ticipants wearing light clothes and no shoes. Data regarding age and gender were simultaneously obtained. Their BMI was then calculated by dividing weight by squared height (kg/m2).
Statistical analysis
For energy adjustment, we used the percentage of total energy intake ( energy) from macronutri-ents and intake per 1,000 kcal (/1,000 kcal) for other nutrients based on obtained DHQ data. In this man-ner, we evaluated the intake of energy (kcal/day), protein ( energy), total fat ( energy), carbohydrate ( energy), total dietary fiber (g/1,000 kcal), insol-uble dietary fiber (g/1,000 kcal), solinsol-uble dietary fiber (g/1,000 kcal), total fatty acid (g/1,000 kcal), saturated fatty acid (g/1,000 kcal), monounsaturated fatty acid (g/1,000 kcal), polyunsaturated fatty acid (g/1,000 kcal), n3︲polyunsaturated fatty acid (g/1,000 kcal), n︲6 polyunsaturated fatty acid (g/1,000 kcal), cholesterol (mg/1,000 kcal), vitamin A (μg/1,000 kcal), vitamin B1 (mg/1,000 kcal), vita-min B2 (mg/1,000 kcal), vitavita-min C (mg/1,000 kcal), niacin (mg/1,000 kcal), vitamin D (μg/1,000 kcal), vitamin E (mg/1,000 kcal), vitamin K (μg/1,000 kcal), pantothenic acid (mg/1,000 kcal), vitamin B6 (mg/1,000 kcal), vitamin B12 (μg/1,000 kcal), folic acid (μg/1,000 kcal), calcium (mg/1,000 kcal), iron (mg/1,000 kcal), sodium (mg/1,000 kcal), potassium (μ g/1,000 kcal), phosphorus (mg/1,000 kcal), magnesium (mg/1,000 kcal), zinc (mg/1,000 kcal), and copper (mg/1,000 kcal).
Continuous variables are shown as the mean±
standard error (SE) and categorical variables are expressed as frequency. Mann Whitneyʼs U test was used to compare continuous variables and a chi-square test for categorical variables to detect differences between two groups in regard to PSQIS, SOL, and TST, as noted above. Binomial logistic regression analysis was conducted to confirm the association between subjective sleep and the amount of dietary nutrient intake. The dependent variable was classifi-cation in the poor group, while independent variables were items that showed a p value less than 0.15 in Mann Whitneyʼs U test for each category of PSQIS, SOL, and TST.
Statistical Product and Service Solution (SPSS) version 23.0 (IBM, Armonk, New York, USA) was utilized for statistical analysis. A p value of <0.05 was considered to indicate statistical significance.
Ethical approval
This study was approved by the ethics committee of Fukuyama University, and written informed consent was obtained from all participants.
Results
Assessment of measured parameters related to subjective sleep
Results of the PSQI are presented in Figure 1. The mean PSQI value was 5.9±2.8, with 82 (46.3 ) of the participants experiencing poor sleep quality, 43 (24.3 ) with prolonged SOL, and 98 (55.4 ) with short TST. 0 5 10 0 5 20 40 35 30 25 15 10 PSQIS Number of subjects
Figure 1 Histogram of participantsʼ global scores on the
Pitts-burgh Sleep Quality Index (PSQIS)
Relationship between PSQIS and dietary nutrient intake
The differences of intake of dietary nutrients between the poor and good groupsʼ PSQIS are shown in Table 1. Among participants with a score greater than 5 who experienced poor subjective sleep quality, the amount of ingested protein was significantly higher as compared to those with good sleep quality.
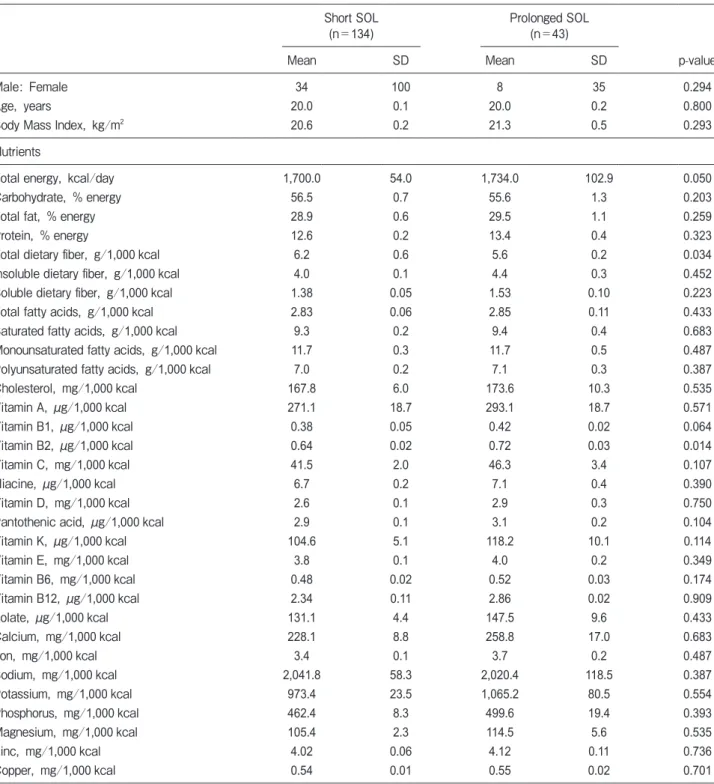
Relationship between SOL and dietary nutrientsʼ intake
There were significantly greater amounts of
dietary energy and vitamin B2 intake, and a signifi-cantly lower total amount of dietary fiber noted in the students with prolonged SOL (Table 2).
Good PSQIS
(n=95) Poor PSQIS(n=82)
Mean SD Mean SD p-value
Male: Female 22 73 20 62 0.981⁂
Age, years 19.9 0.1 20.0 0.2 0.977
Body Mass Index, kg/m2 20.9 0.4 20.9 0.3 0.914
Nutrients
Total energy, kcal/day 1,719.0 69.7 1,687.0 65.3 0.715
Carbohydrate, % energy 56.3 0.84 56.2 0.9 0.473
Total fat, % energy 29.3 0.7 28.7 0.7 0.557
Protein, % energy 12.5 0.2 13.1 0.3 0.048
Total dietary fiber, g/1,000 kcal 5.6 0.2 5.8 0.3 0.508
Insoluble dietary fiber, g/1,000 kcal 6.7 0.3 6.8 0.4 0.595
Soluble dietary fiber, g/1,000 kcal 1.41 0.05 1.43 0.07 0.959
Total fatty acids, g/1,000 kcal 2.86 0.07 2.80 0.07 0.290
Saturated fatty acids, g/1,000 kcal 9.4 0.3 9.4 0.3 0.685
Monounsaturated fatty acids, g/1,000 kcal 11.8 0.4 11.5 0.3 0.260
Polyunsaturated fatty acids, g/1,000 kcal 7.1 0.2 6.9 0.2 0.250
Cholesterol, mg/1,000 kcal 166.7 7.0 173.3 7.9 0.488 Vitamin A, μg/1,000 kcal 285.9 22.6 262.6 24.2 0.451 Vitamin B1, μg/1,000 kcal 0.38 0.01 0.40 0.01 0.117 Vitamin B2, μg/1,000 kcal 0.63 0.02 0.68 0.02 0.156 Vitamin C, mg/1,000 kcal 40.1 1.8 45.2 2.9 0.383 Niacine, μg/1,000 kcal 6.6 0.2 7.0 0.3 0.159 Vitamin D, mg/1,000 kcal 2.6 0.2 2.8 0.2 0.806
Pantothenic acid, μg/1,000 kcal 2.83 0.06 2.98 0.08 0.134
Vitamin K, μg/1,000 kcal 104.9 10.0 108.6 6.8 0.698 Vitamin E, mg/1,000 kcal 3.9 0.1 3.8 0.1 0.443 Vitamin B6, mg/1,000 kcal 0.47 0.02 0.49 0.02 0.257 Vitamin B12, μg/1,000 kcal 2.4 0.1 2.6 0.2 0.313 Folate, μg/1,000 kcal 131.1 4.7 137.8 6.8 0.149 Calcium, mg/1,000 kcal 227.5 11.1 242.0 11.2 0.318 Iron, mg/1,000 kcal 3.3 0.1 3.5 0.1 0.519 Sodium, mg/1,000 kcal 2,068.4 73.3 2,034.5 78.6 0.691 Potassium, mg/1,000 kcal 966.1 27.5 1,024.2 46.0 0.422 Phosphorus, mg/1,000 kcal 455.9 9.7 484.7 12.4 0.066 Magnesium, mg/1,000 kcal 104.3 2.3 110.4 3.9 0.622 Zinc, mg/1,000 kcal 3.95 0.06 4.08 0.08 0.092 Copper, mg/1,000 kcal 0.53 0.01 0.56 0.02 0.938
Relationship between TST and dietary nutrientsʼ intake
Participants with short sleep duration had signifi-cantly greater amounts of total dietary fiber, soluble
dietary fiber, and insoluble dietary fiber. No differ-ences for sex or age, or in regard to either PSQIS or SOL were observed (Table 3).
Table 2 Comparison of basic characteristics and nutrients intake between short and prolonged SOL groups
Short SOL
(n=134) Prolonged SOL(n=43)
Mean SD Mean SD p-value
Male: Female 34 100 8 35 0.294
Age, years 20.0 0.1 20.0 0.2 0.800
Body Mass Index, kg/m2 20.6 0.2 21.3 0.5 0.293
Nutrients
Total energy, kcal/day 1,700.0 54.0 1,734.0 102.9 0.050
Carbohydrate, % energy 56.5 0.7 55.6 1.3 0.203
Total fat, % energy 28.9 0.6 29.5 1.1 0.259
Protein, % energy 12.6 0.2 13.4 0.4 0.323
Total dietary fiber, g/1,000 kcal 6.2 0.6 5.6 0.2 0.034
Insoluble dietary fiber, g/1,000 kcal 4.0 0.1 4.4 0.3 0.452
Soluble dietary fiber, g/1,000 kcal 1.38 0.05 1.53 0.10 0.223
Total fatty acids, g/1,000 kcal 2.83 0.06 2.85 0.11 0.433
Saturated fatty acids, g/1,000 kcal 9.3 0.2 9.4 0.4 0.683
Monounsaturated fatty acids, g/1,000 kcal 11.7 0.3 11.7 0.5 0.487
Polyunsaturated fatty acids, g/1,000 kcal 7.0 0.2 7.1 0.3 0.387
Cholesterol, mg/1,000 kcal 167.8 6.0 173.6 10.3 0.535 Vitamin A, μg/1,000 kcal 271.1 18.7 293.1 18.7 0.571 Vitamin B1, μg/1,000 kcal 0.38 0.05 0.42 0.02 0.064 Vitamin B2, μg/1,000 kcal 0.64 0.02 0.72 0.03 0.014 Vitamin C, mg/1,000 kcal 41.5 2.0 46.3 3.4 0.107 Niacine, μg/1,000 kcal 6.7 0.2 7.1 0.4 0.390 Vitamin D, mg/1,000 kcal 2.6 0.1 2.9 0.3 0.750
Pantothenic acid, μg/1,000 kcal 2.9 0.1 3.1 0.2 0.104
Vitamin K, μg/1,000 kcal 104.6 5.1 118.2 10.1 0.114 Vitamin E, mg/1,000 kcal 3.8 0.1 4.0 0.2 0.349 Vitamin B6, mg/1,000 kcal 0.48 0.02 0.52 0.03 0.174 Vitamin B12, μg/1,000 kcal 2.34 0.11 2.86 0.02 0.909 Folate, μg/1,000 kcal 131.1 4.4 147.5 9.6 0.433 Calcium, mg/1,000 kcal 228.1 8.8 258.8 17.0 0.683 Iron, mg/1,000 kcal 3.4 0.1 3.7 0.2 0.487 Sodium, mg/1,000 kcal 2,041.8 58.3 2,020.4 118.5 0.387 Potassium, mg/1,000 kcal 973.4 23.5 1,065.2 80.5 0.554 Phosphorus, mg/1,000 kcal 462.4 8.3 499.6 19.4 0.393 Magnesium, mg/1,000 kcal 105.4 2.3 114.5 5.6 0.535 Zinc, mg/1,000 kcal 4.02 0.06 4.12 0.11 0.736 Copper, mg/1,000 kcal 0.54 0.01 0.55 0.02 0.701
Good TST
(n=79) Short TST(n=98)
Mean SD Mean SD p-value
Male: Female 23 56 19 79 0.136
Age, years 19.9 0.2 20.0 0.2 0.857
Body Mass Index, kg/m2 21.0 0.0 20.6 0.3 0.349
Nutrients
Total energy, kcal/day 1,706.9 68.7 1,664.2 62.4 0.505
Carbohydrate, % energy 12.6 0.2 13.0 0.2 0.269
Total fat, % energy 28.6 0.7 29.4 0.7 0.226
Protein, % energy 56.7 0.8 55.9 0.9 0.165
Total dietary fiber, g/1,000 kcal 1.5 0.1 1.3 0.1 0.006
Insoluble dietary fiber, g/1,000 kcal 4.2 0.1 3.9 0.2 0.015
Soluble dietary fiber, g/1,000 kcal 5.9 0.2 5.5 0.3 0.010
Total fatty acids, g/1,000 kcal 2.81 0.07 2.85 0.07 0.341
Saturated fatty acids, g/1,000 kcal 9.2 0.3 9.5 0.3 0.806
Monounsaturated fatty acids, g/1,000 kcal 11.6 0.4 11.8 0.3 0.340
Polyunsaturated fatty acids, g/1,000 kcal 7.0 0.2 7.1 0.2 0.366
Cholesterol, mg/1,000 kcal 174.9 8.2 164.4 6.8 0.523 Vitamin A, μg/1,000 kcal 269.2 19.2 279.3 25.4 0.730 Vitamin B1, μg/1,000 kcal 0.39 0.01 0.39 0.01 0.627 Vitamin B2, μg/1,000 kcal 0.63 0.02 0.67 0.01 0.151 Vitamin C, mg/1,000 kcal 41.1 2.1 49.1 2.5 0.599 Niacine, μg/1,000 kcal 6.6 0.2 6.8 0.2 0.874 Vitamin D, mg/1,000 kcal 2.7 0.2 2.7 0.2 0.848
Pantothenic acid, μg/1,000 kcal 2.82 0.06 2.96 0.08 0.340
Vitamin K, μg/1,000 kcal 108.7 7.1 106.1 5.8 0.340 Vitamin E, mg/1,000 kcal 4.0 0.1 3.8 0.1 0.161 Vitamin B6, mg/1,000 kcal 0.48 0.02 0.49 0.02 0.174 Vitamin B12, μg/1,000 kcal 2.6 0.2 2.4 0.1 0.597 Folate, μg/1,000 kcal 130.6 5.0 137.3 6.1 0.895 Calcium, mg/1,000 kcal 230.0 13.0 237.3 9.8 0.252 Iron, mg/1,000 kcal 3.3 0.6 352.0 0.1 0.305 Sodium, mg/1,000 kcal 2,049.6 82.1 2,032.2 68.5 0.909 Potassium, mg/1,000 kcal 966.3 28.8 1,014.1 41.0 0.705 Phosphorus, mg/1,000 kcal 462.4 10.7 471.0 11.4 0.433 Magnesium, mg/1,000 kcal 105.2 2.6 109.1 3.4 0.946 Zinc, mg/1,000 kcal 4.02 0.07 4.04 0.08 0.413 Copper, mg/1,000 kcal 0.53 0.01 0.56 0.02 0.544
SD: standard deviation, ⁂: chi-square test
Multivariate analysis
Regarding PSQIS and SOL, no specific nutrients showed an influence on poor sleep quality or prolonged
SOL in results of binomial logistic regression analy-sis. However, multivariate analysis revealed that short sleep duration was significantly associated with a
low-er amount of soluble dietary fiblow-er intake (OR: 95 , CI 0.111︲0.765, p=0.038) (Table 4).
Table 4 Influenced nutrients for short sleep duration
Nutrients Odds Ratio(95%C.I. ) p value
Total dietary fiber 1.90 (0.77︲4.68) 0.165
Soluble dietary fiber 0.21 (0.05︲0.91) 0.037
Insoluble dietary fiber 0.55 (0.17︲1.85) 0.377
Discussion
We conducted the present cross-sectional study of 177 university students to examine the relationships between dietary nutrients and sleep behavior, namely PSQIS, SOL, and TST. It is well-established that poor sleep quality, long sleep latency ﹇15﹈, and short sleep duration are associated with adverse health outcomes, including overall mortality ﹇16﹈, weight gain, and obesity-related diseases, such as type 2 diabetes ﹇1﹈, hypertension ﹇2﹈, and cardiovascular disease ﹇3﹈. However, in the present study we found no specific nutrient that had a relationship with poor sleep quality or long sleep latency. On the other hand, participants with a short sleep duration (<7 hours) consumed significantly lower amounts of soluble fiber, which was shown in the findings of multivariate analy-sis. Epidemiological studies concerning habitual sleep duration and dietary intake have revealed an associa-tion between short sleep and higher total calories ﹇4﹈. Moreover, cross-sectional studies have found a signif-icant association between short sleep duration and a higher prevalence of weight gain or obesity in both children and adults ﹇1﹈. It is generally assumed that the impact of short sleep on dietary intake is likely multi-factorial, with numerous mechanisms proposed and examined. Short sleep time results in extended hours of wakefulness, which is considered to provide additional opportunities to increase food intake, while it has also been observed that a changed dinner time to later than usual is a significant predictor of higher BMI, independent of age and sleep timing ﹇17﹈. Further-more, laboratory results revealed that the level of leptin, a satiety signal, is reduced after sleep restric-tion, while the level of ghrelin, an appetite stimulant, is increased ﹇18﹈. Accordingly, short sleep duration is
associated with body weight gain and obesity-related diseases.
There have been several reports regarding the association between nutrient intake and short sleep duration, and collectively they have suggested that short sleepers likely consume diets with higher fat and lower protein levels ﹇6, 17﹈. However, results regarding carbohydrate composition remain contro-versial. As for food intake, an investigation of Jap-anese factory workers revealed that short sleepers (<6 hours) consumed fewer vegetables as compared to normal sleepers (6︲9 hours) ﹇5﹈. Recently, a large, nationally representative study conducted in the Unit-ed States reportUnit-ed that short sleepers (5︲6 hours) had a lower intake of dietary fiber than normal sleep-ers (7︲8 hours) ﹇4﹈. St-Onge . (2016) ﹇19﹈ also revealed that a lower consumption of dietary fiber was associated with lighter and restorable sleep with more arousals. In the present study, a significantly lower soluble dietary fiber intake was observed in participants with a short sleep duration. It has been reported that oligofructose, a prebiotic, contributes to weight loss and improved metabolic parameters such as insulin resistance in overweight or obese indi-viduals ﹇20﹈. Moreover, satiety, reduced energy and food intake, and increased levels of satiety peptides were also shown to result from consumption of prebiotic supplements that contained dexstrin in healthy human participants ﹇21﹈. Consequently, it is suggested that an adequate ingested soluble dietary fiber intake may prevent overweight and obesity-related diseases, such as type 2 diabetes, hypertension, and cardiovascular disease, and may contribute to adequate sleep dura-tion, thus leading to decreased rates of mortality and morbidity indirectly via improvement of metabolic disorders.
Several studies have been conducted regarding nutrients and foods that have an adverse influence on subjective sleep quality and/or sleep onset latency
﹇5, 22, 23﹈. Katagiri . (2014) ﹇5﹈ showed that poor subjective sleep quality was associated with a low intake of vegetables and fish, and high intake of confectionary and noodles. It was also reported that a six-month diet intervention including energy restric-tion shortened sleep onset latency ﹇23﹈. However, it remains unclear whether specific nutrients are harm-ful to both subjective sleep quality and sleep onset latency in healthy participants. In the present study
to significantly worsen sleep quality or sleep latency. Additional investigations are needed to further examine these issues.
It is well understood that inadequate sleep is associated with being overweight and obesity-related diseases. Being overweight in adolescence is known to be related to increased morbidity and mortality rates in adulthood, because both body weight and body composition in adolescent individuals are important determinants of an overweight condition in adulthood
﹇7, 8﹈. On the other hand, a large British longitudinal
study indicated that an energy-dense, high fat, and low fiber dietary pattern in adolescence was prospec-tively associated with increased and excess adiposity in adulthood ﹇9﹈. Here, we examined the relationship between subjective sleep and dietary nutrient intake in university students between 18 and 24 years of age, and the results revealed that an adequate amount of soluble dietary fiber intake is beneficial for maintain-ing adequate sleep duration. Accordmaintain-ingly, better diet quality including increased soluble dietary fiber intake may improve not only sleep condition but also body composition, leading to reductions in the future risks of morbidity and mortality.
The present study has several limitations. We utilized a cross-sectional design, thus the results do not necessarily imply causal relationships. In the context of this study, a short sleeping time in univer-sity students may be caused by a low level of soluble dietary fiber intake, or alternatively, students with a short sleep duration may consume less soluble dietary fiber. A longitudinal design would be desir-able to address such issues. Furthermore, our studyʼs participants were not randomly selected. Rather, convenience sampling was used, thus generalization of the results should be made with caution. Also, we measured sleep duration using a subjective rather than objective method. Finally, sleep condition is affected by a number of factors in daily life, such as physical activity, commuting time, and current relationships with family members or friends. The impact of the association with sleep duration might have been modi-fied by unknown confounders that were not assessed in this study. These methodological limitations should be addressed in a future study.
In conclusion, the present results suggest that ingestion of soluble dietary fiber may be useful for
of obesity-related diseases. However, an association shown in a cross-sectional study does not indicate cau-sality, thus an additional longitudinal investigation is required to confirm our findings.
Acknowledgments: This study was partially supported by the Satake Foundation for Food Engineering. We wish to express our gratitude to Chise Ito, Kanako Inoue, Eri Matsuno, Hikari Yamasaki, and Yuka Yamamitsu for their generous help and support with this study.
References
1. Cappuccio FP, Taggart FM, Kandala NB, Currie A, Peile E, Strang-es S, Miller MA. Meta-analysis of short sleep duration and obStrang-esity in children and adults. Sleep. 2008;31(5):619-26.
2. Stranges S, Dorn JM, Cappuccio FP, Donahue RP, Rafalson LB, Hovey KM, Freudenheim JL, Kandala NB, Miller MA, Trevisan M. A population-based study of reduced sleep duration and hyperten-sion: the strongest association may be in premenopausal women. J Hypertens. 2010;28(5):896-902. Available from: doi: 10.1097/ HJH.0b013e328335d076
3. Knutson KL. Sleep duration and cardiometabolic risk: a review of the epidemiologic evidence. Best Pract Res Clin Endocrinol Metab. 2010;24(5):731-43. Available from: doi: 10.1016/j.beem. 2010.07.001
4. Grandner MA, Jackson N, Gerstner JR, Knutson KL. Dietary nutrients associated with short and long sleep duration: data from a nationally representative sample. Appetite. 2013;64:71-80. Available from: doi: 10.1016/j.appet.2013.01.004
5. Katagiri R, Asakura K, Kobayashi S, Suga H, Sasaki S. Low intake of vegetables, high intake of confectionary, and unhealthy eating habits are associated with poor sleep quality among middle-aged female Japanese workers. J Occup Health. 2014;56(5):359-68. 6. Dashti HS, Follis JL, Smith CE, Tanaka T, Cade BE, Gottlieb DJ,
Hruby A, Jacques PF, Lamon-Fava S, Richardson K, Saxena R, Scheer FA, Kovanen L, Bartz TM, Perälä MM, Jonsson A, Frazier-Wood AC, Kalafati IP, Mikkilä V, Partonen T, Lemaitre RN, Lahti J, Hernandez DG, Toft U, Johnson WC, Kanoni S, Raitakari OT, Perola M, Psaty BM, Ferrucci L, Grarup N, Highland HM, Rallidis L, Kähönen M, Havulinna AS, Siscovick DS, Räikkönen K, Jørgensen T, Rotter JI, Deloukas P, Viikari JS, Mozaffarian D, Linneberg A, Seppälä I, Hansen T, Salomaa V, Gharib SA, Eriksson JG, Bandinelli S, Pedersen O, Rich SS, Dedoussis G, Lehtimäki T, Ordovás JM. Habitual sleep duration is associated with BMI and macronutrient intake and may be modified by CLOCK genetic variants. Am J Clin Nutr. 2015;101(1):135-43. Available from: doi: 10.3945/ajcn.114.095026
7. Ambrosini GL, Emmett PM, Northstone K, Jebb SA. Tracking a dietary pattern associated with increased adiposity in childhood and adolescence. Obesity. 2014;22(2):458-65. Available from: doi: 10.1002/oby.20542
8. Ge S, Kubota M, Nagai A, Mamemoto K, Kojima C. Retrospective in-dividual tracking of body mass index in obese and thin adolescents back to childhood. Asia Pac J Clin Nutr. 2011;20(3):432-37. 9. Ambrosini GL, Emmett PM, Northstone K, Howe LD, Tilling K, Jebb
with increased adiposity during childhood and adolescence. Int J Obesity. 2012;36(10):1299-1305. Available from: doi: 10.1038/ijo. 2012.127
10. Sasaki S, Yanagibori R, Amano K. Self-administered diet history questionnaire developed for health education: a relative validation of the test-version by comparison with 3-day diet record in women. J Epidemiol. 1998;8(4):203-15.
11. Murakami K, Sasaki S, Takahashi Y, Okubo H, Hirota N, Notsu A, Fukui M, Date C. Reproducibility and relative validity of dietary gly-cemic index and load assessed with a self-administered diet-history questionnaire in Japanese adults. Br J Nutr. 2008;99(3):639-48. 12. The Council for Science and Technology, Ministry of
Educa-tion, Culture, Sports, Science, and Technology, Japan. Standard tables of food composition in Japan. 5th ed. Tokyo: Printing Bureau of the Ministry of Finance. 2005. Available from
http://journals.sagepub.com/doi/full/10.1177/1099800413501539 Japanese, English.
13. Doi Y, Minowa M, Uchiyama M, Okawa M, Kim K, Shibui K, Kamei Y. Psychometric assessment of subjective sleep quality using the Japanese version of the Pittsburgh Sleep Quality Index (PSQI-J) in psychiatric disordered and control subjects. Psychiatric Res. 2000;97(2-3):165-72.
14. Buysee DJ, Reynolds CF 3rd, Monk TH, Berman SR, Kupfer DJ. The Pittsburgh Sleep Quality Index: a new instrument for psychiatric practice and research. Psychiatric Res. 1989;28(2):193-213. 15. Afaghi A, O Connor H, Chow CM. High-glycemic-index carbohydrate
meals shorten sleep onset. Am J Clin Nutr. 2007;85(2):426-30. 16. Cappuccio FP, D Elia L, Strazullo P, Miller MA. Sleep duration and
all-cause mortality: a systematic review and meta-analysis of pro-spective studies. Sleep. 2010;33(5):585︲92.
17. Dashti HS, Scheer FAJL, Jacques PF, Lamon-Fava S, Ordovas JM. Short sleep duration and dietary intake: epidemiologic evidence,
mechanisms, and health implications. Adv Nutr. 2015;6(6):648-59. Available from: doi: /10.3945/an.115.008623
18. Spiegel K, Tasali E, Penev P, Van Cauter E. Sleep curtailment in healthy young men is associated with decreased leptin levels, ele-vated ghrelin levels, and increased hunger and appetite. Ann Intern Med. 2004;141(11):846-50.
19. St-Onge MP, Roberts A, Shechter A, Choudhury AR. Fiber and sat-urated fat are associated with sleep arousals and slow wave sleep. J Clin Sleep Med. 2016;12(1):19-24. Available from: doi: 10.5664/ jcsm.5384
20. Parwell JA, Reimer RA. Weight loss during oligofructose supple-mentation is associated with decreased ghrelin and increased peptide YY in overweight and obese adults. Am J Clin Nutr. 2009;89(6):1751-9. Available from: doi: 10.3945/ajcn.2009.27465 21. Olli K, Salli K, Alhoniemi E, Saarinen M, Ibarra A, Vasankari T,
Rautonen N, Tiihonen K. Postprandial effects of polydextrose on satiety hormone responses and subjective feelings of appetite in obese participants. Nutr J. 2015;14:2. Available from: doi: 10.1186/1475-2891-14-2
22. Okubo N, Matsuzaka M, Takahashi I, Sawada K, Sato S, Akimoto N, Umeda T, Nakaji S, Hirosaki University Graduate School of Medi-cine. Relationship between self-reported sleep quality and metabolic syndrome in general population. BMC Public Health 2014;14:562. Available from: doi: 10.1186/1471-2458-14-562
23. Xiao Tan, Markku Alén, Kun Wang, Jarkko Tenhuen, Petri Wiklund, Markku Partinen, Sulin Cheng. Effect of six-month diet intervention on sleep among overweight and obese men with chronic insomnia symptoms; a randomized controlled trial. Nutrients. 2016;8(11):751. Available from: doi: 10.3390/nu8110751