病原細菌と共生細菌のIII型分泌装置のエフェクタータンパク質を区別する特徴は何か?
8
0
0
全文
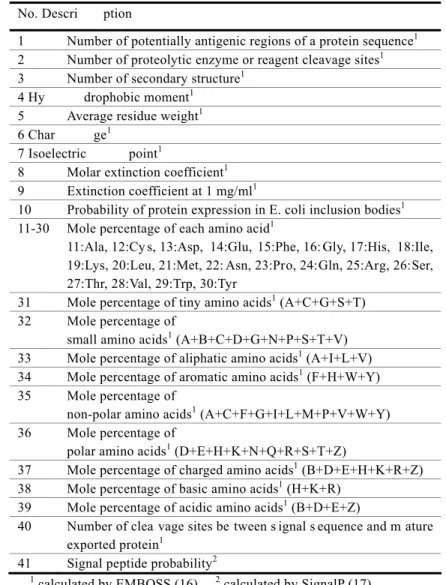
(2) Vol.2010-BIO-21 No.16 2010/6/19. 情報処理学会研究報告 IPSJ SIG Technical Report. finding t he phy sicochemical di fferences betwe en pathogenic and sy mbiotic T3SS ef fector proteins that might be responsible for these functional differences. In this work, we com bined com putational st atistical and mac hine-learning approache s to address this issue. From a dataset of physicochemical features prepared from pathogenic and symbiotic T3SS effector proteins, the most discriminating set of feature s was determined using generalized Baysian information criteria and kernel logi stic regression. Classification performance using the i dentified di scriminating feature s was examined u sing su pport vect or machine (SVM ). The res ults clearly s howed differences in am ino acid compos ition. The most discriminating set of seven features were identified and successfully used to classify the effectors, with a sensitivity and specificity of over 80%. In addition, interdependence among the most discri minating seven features wa s re vealed by graphical modeli ng. The most discriminating r egion for the most di scriminating seven featur es was deter mined by sliding window analysis.. Table 1. Biochemical features used as attributes of effector proteins No. Descri. ption. 1 Number of potentially antigenic regions of a protein sequence1 2 Number of proteolytic enzyme or reagent cleavage sites1 3 Number of secondary structure1 4 Hy drophobic moment1 5 Average residue weight1 6 Char ge1 7 Isoelectric point1 8 Molar extinction coefficient1 9 Extinction coefficient at 1 mg/ml1 10 Probability of protein expression in E. coli inclusion bodies1 11-30 Mole percentage of each amino acid1 11:Ala, 12:Cy s, 13:Asp, 14:Glu, 15:Phe, 16: Gly, 17:His, 18:Ile, 19:Lys, 20:Leu, 21:Met, 22: Asn, 23:Pro, 24:Gln, 25:Arg, 26:Ser, 27:Thr, 28:Val, 29:Trp, 30:Tyr 31 Mole percentage of tiny amino acids1 (A+C+G+S+T) 32 Mole percentage of small amino acids1 (A+B+C+D+G+N+P+S+T+V) 33 Mole percentage of aliphatic amino acids1 (A+I+L+V) 34 Mole percentage of aromatic amino acids1 (F+H+W+Y) 35 Mole percentage of non-polar amino acids1 (A+C+F+G+I+L+M+P+V+W+Y) 36 Mole percentage of polar amino acids1 (D+E+H+K+N+Q+R+S+T+Z) 37 Mole percentage of charged amino acids1 (B+D+E+H+K+R+Z) 38 Mole percentage of basic amino acids1 (H+K+R) 39 Mole percentage of acidic amino acids1 (B+D+E+Z) 40 Number of clea vage sites be tween s ignal s equence and m ature exported protein1 41 Signal peptide probability2. 2. Materials and Methods 2.1 Dataset. We collected the 57 currentl y available am ino acid s equences of s ymbiotic T3S S effector proteins from the literature (9, 15), and the same number of amino acid sequences for pathogenic T3SS effector proteins (9). For each e ffector protei n am ino acid s equence, we calculated the phy sicochemical features, 41 in total, of cha rge, isoetectric p oint, num ber of proteolytic enzy me or reagent cleavage s ites, mole percenta ge of each a mino acid and a mino acid groups defined i n EMBOSS (16), and signal pepti de probability. The list of 41 physicochemical features used in this st udy is i n Table 1. Signal peptide pr obability was calculated b y SignalP 3.0 (17), a nd others feature s were calculated by EM BOSS (16). These were used as att ributes in o ur classification analysis. 2.2 Feature selection. We first used t he Lepage test for the lo cation-dispersion di fference between the two groups (18). The top 10 discriminating features were chosen by the order of their p-values in the test statistics. The p-values of all of these candidate features were less than 0.001. For t hese candidate features , we exa mined a ll combinations, 2 10-1, a s explanatory variables in the kernel logistic regression (KLR), which is one of the kernel-learning methods suitable for binary-pattern recognition problems (19, 20). Let yi be a binary observed. 1. 2. calculated by EMBOSS (16).. 2. calculated by SignalP (17).. ⓒ 2010 Information Processing Society of Japan.
(3) Vol.2010-BIO-21 No.16 2010/6/19. 情報処理学会研究報告 IPSJ SIG Technical Report. variable and p(xi) be its co nditional distribution given xi , the n the likelihood function was given by n. L = ∏ p (xi ) yi (1 − p (xi ))1− yi. equation (1) and the multivari ate norm al prior density. π (α | λ ) = (2π ) − r /2 (nλ )r / 2 | R |1/2 + exp(−. and log-likelihood function became. i =1. p (xi ) was. GBIC = −2 log ∫ L(α )π (α | λ )dα. (2). p ( xi ) + log(1 − p (xi )) 1 − p (xi ). in whic h the unknown quantity. modeled using the ra dial basi s ker nel fu nction. r nonzer o eigenvalues of. | R |+ was the product of. R. O nce. αˆ. was o btained, GBI C was calculated through th e. Laplace approximation n p ( xi ) f (xi ) = log = ∑ α j K ( x j , xi ) 1 − p (xi ) j =0. (3). K i j = K (xi , x j ) = exp(−σ || xi − x j ||2 ). (4). −2 log ∫ exp(nlλ (α ))dα = −2 log{. where. σ. (6). (7). and R was the same as that of equation (5), r was the rank of R, and. K (x j , xi ) as. and. nλ T α Rα ) 2. GBIC was defined as. log L n. ctor. α defined by. (1). i =1. = ∑ yi log. π (α | λ ) for th e parameter ve. αˆ. was calculated. 1 n λ {∑ yi f (xi ) − log[1 + exp( f (xi ))]} − αT Rα n i =1 2. (5). is the kernel param eter.. The soluti on of the para meter vector. (8). where. 1 1 log L(α ) + log π (α | λ ) n n 2 ∂ l (α ) J λ (αˆ ) = − λ T ∂α∂α ,. lλ (α) =. using the following penalized log-likelihood function. GBIC was computed for each com bination of 10 features , and the com bination with the minimum GBI C wa s deter mined as ex planatory variable of KLR. During the feature. where. ⎛ 1 1nT ⎞ R=⎜ ⎟ ⎝ 1n K ⎠. selection, values of kernel parameter. σ. and hyper parameter. λ. were given in the range of. 1E-3 to 1E+3 ( σ ) or to 1E+4 ( λ ) for each set of explanatory features.. by Fisher’s scoring methods. To s elect the b est combination of the 10 candidate features , Bayesian infor mation crite rion (GB IC) ( 21). Using the. (2π / n)( n +1)/ 2 exp(nlλ (αˆ ))}{1 + O(n −1 )} | J λ (αˆ ) |1/2. we us ed a generalized. likelihood f unction. L(α ) in 3. ⓒ 2010 Information Processing Society of Japan.
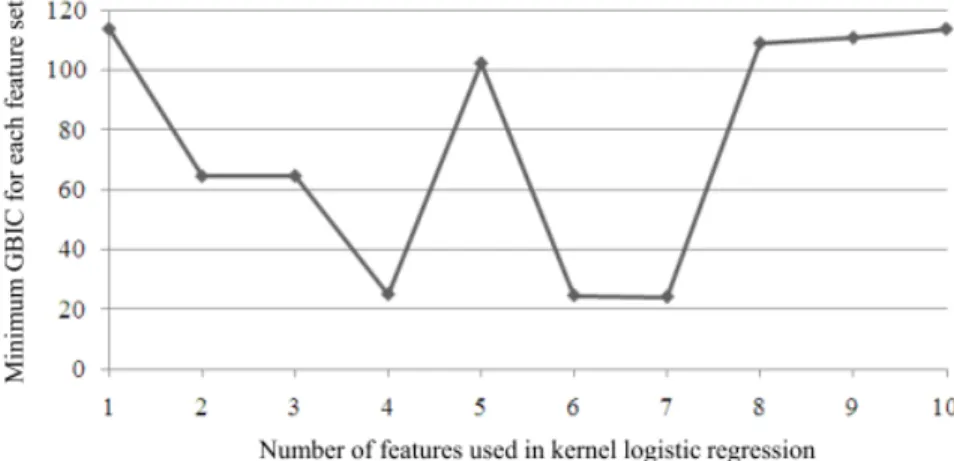
(4) Vol.2010-BIO-21 No.16 2010/6/19. 情報処理学会研究報告 IPSJ SIG Technical Report. minimum GBIC tends to decrease as the numbe r of features inc rease, take the sm allest value when the number of features is seven, and incr ease at greater than seven features. The seven features that att ained the sm allest minimum GBIC we re as follows: average res idual weight, mole percentage of Ala, Asp, Ile, tiny amino acids, small amino acids, and acidic amino acids.. 2.3 Classification performance. Classification performance u sing di scriminating feature s ide ntified by GBI C of KRL was analyzed using SVM based on the approx imate relationship between KRL and the SVM (19). To determ ine t he adva ntage of t he most di scriminating feature s, a misclassification rate was eval uated by leave-one-out cr oss-validation fo r each combi nation of k-features t hat attained the minimum GBIC in 10 Ck combinations (k=1,…,10).. The results are summarized. Figure 2, which illustrates the misclassification rates, with the num ber of features on the horizontal axis. We u sed sv m functio n of e1071 package (E. Dimitriad ou, K. Hornik, F . Leisch, D. Meyer, and A. Weingessel) in R. 2.4 Graphical modeling. To explore interdependence among the mo st discriminating features identified by GBIC of KLR, we u sed graphical modeling develo ped b y Imoto et al. (22, 23) which combine s non-linear n onparametric regr ession with ra dial basis and Bay esian networ k, and was originally developed for esti mating genetic ne tworks and fu nctional relatio nships bet ween genes. Non-l inear nonparametric regression enabled u s to capture directed dependencie s among the featu res without advance knowledge about their rela tionships. Bayesian network is a powe rful, graph-theoretic approach f or expressing i nterdependence amon g variables a s networks. Calculations were conducted by MA TLAB R2008b (The Mathwork s Inc. ) based on NETLAB (24), the Ba yes net toolbox (BNT) for Matlab (25), and BNT structure learning package (26).. Figure 1.. Plot of minimum GBIC against number of features used in kernel logistic regression.. 2.5 Sliding window analysis. N-terminal re gions from the 1 st to 97 th re sidue were analy zed, with the window size varying from 8-50, and the s tarting pos ition varying from 1 to 50. For each window , a dataset of the most di scriminating feature s wa s created, and clas sification wa s conducted by SVM.. 3.2 Classification performance using the most discriminating features. Misclassification rates using the discriminating features identified by GBIC of KLR are plotted in Fi gure 2, taking the nu mber of featu res on h orizontal axis. The plot of mi nimum GBICs (Figure 1) and misclassification rat es showed parallel tendencies. The be st classification perfor mance (84. 2%) wa s obtain ed using a combination of the seven feature s that gave the sm allest m inimum GBIC (Figure 2A). T he best per formance with se ven features was ne arly identical t o the res ults obtained when all 41 features were us ed. The seven di scriminating features had a specificity of 85.5% an d a sensiti vity of 83.1% ( Figure 2B).. 3. Results 3.1 Identification of discriminating features. A plot of mini mum GBIC for 10Ck co mbination of feature s u sed in KL R wa s gi ven in Figure 1 taking the numbe r of features, k, on the horizontal axis . The figure s hows that the 4. ⓒ 2010 Information Processing Society of Japan.
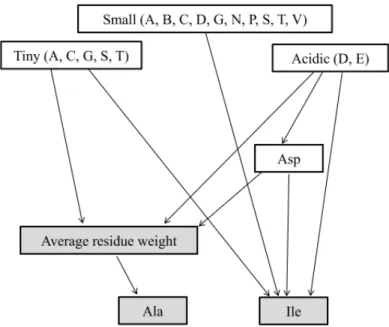
(5) Vol.2010-BIO-21 No.16 2010/6/19. 情報処理学会研究報告 IPSJ SIG Technical Report. 3.3 Interdependence among the most discriminating features as a graph structure. The interdependence among the seven most discriminating features was represented in a directed-graph structure ( Figure 3), in whic h the mole percentage of isol eucine, and a combination of alanine and average res idue weight were po sitioned at the bottom end. The three feature s a re repre sentative of the directed-graph structure and ha ve be en selected by KLR at one or two features. Figure 2 shows that classification accuracy was about 70% for the mole percentag e of isoleucine, and nearly 80% for a com bination of alanine and average residue weight. Figure 3. Graph structure showing interdependence among the most-discriminating features. Directed dependencies detected b y nonparametric regressi on are depicted b y arrows whos e heads indicate res ponse variable s and tails indicate explanatory variables. Colours are t he discri minating features ide ntified by GBIC, when the nu mber of feature s i s one or two.. Figure 2. Classification performance using the discriminating features identified by GBIC of KLR. Misclassification rate for each com bination of k-features that attained the minimum G BIC i n 10Ck co mbinations (k= 1,…,10). Classification using all 41 feature s wa s also conducted, and the misclassification ra te is at “All (41)” of the x-axis. (A) Misclassification rate. (B) Specificity and sensitivity. 5. ⓒ 2010 Information Processing Society of Japan.
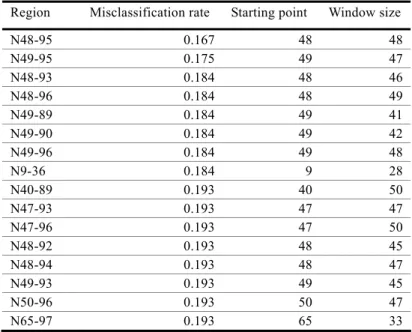
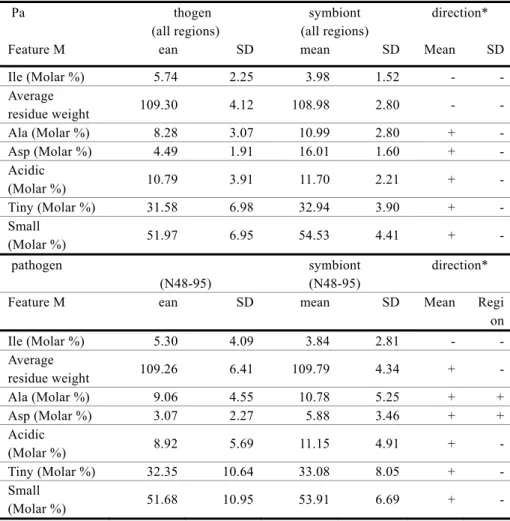
(6) Vol.2010-BIO-21 No.16 2010/6/19. 情報処理学会研究報告 IPSJ SIG Technical Report 3.4 Identification of the most discriminating region. Sliding wi ndow analy sis with variable win dow sizes and starting poi nts is i n Table 2. The region that gave the highest discrimination among the seven most-discriminating features was 48-95 res idues from the N-term inus (N48 -95), which gave a clas sification accurac y of 83.3% ( Figure 4). Al most all of the s econd and thi rd mo st-discriminating regio ns overlapped thi s region, supp orting the h ypothesis that the disc riminating signature between pathogenic and symbiotic T3SS effector proteins was in this region.. Table 2. Results of sliding window analysis Region N48-95 N49-95 N48-93 N48-96 N49-89 N49-90 N49-96 N9-36 N40-89 N47-93 N47-96 N48-92 N48-94 N49-93 N50-96 N65-97. Misclassification rate 0.167 0.175 0.184 0.184 0.184 0.184 0.184 0.184 0.193 0.193 0.193 0.193 0.193 0.193 0.193 0.193. Starting point 48 49 48 48 49 49 49 9 40 47 47 48 48 49 50 65. Window size 48 47 46 49 41 42 48 28 50 47 50 45 47 45 47 33. Figure 4. Plot of misclassification rate by sliding window analysis with window size 48. As shown in Table 2, misclassification rate is lowest when the analysis start position is 48 (i.e. for regio n N48 -95), and when the windo w si ze is 48, whic h gives the best classificatio n performance.. 3.5 Directions of differences of the discriminating features. The dif ferences of the seven most di scriminating feature s between path ogenic an d symbiotic T3SS ef fector prot eins are in T able 3, with "+ " meani ng " more common i n symbiotic prote ins". Results are given fo r all regions, an d for the most discri minating region, N48-95. The patterns of differences were almost equivalent between all regions an d the most-discriminating region, supporting the hypothesis that N48-95 was the representative region that dist inguished bet ween pathogenic and sy mbiotic T3SS ef fector proteins. By mole percenta ge of amino acid s, isoleuci ne de creased in sy mbiotic pr oteins, while the other amino acid s (al anine, aspartic acid, acidic amino acids , tiny a mino aci d, sma ll amino acid) increased in symbiotic proteins. The tendency was found both in all regions, and in the most discriminating N48-95 region.. 6. ⓒ 2010 Information Processing Society of Japan.
(7) Vol.2010-BIO-21 No.16 2010/6/19. 情報処理学会研究報告 IPSJ SIG Technical Report. Table 3. Directions of the differences of the most discriminating features Pa. thogen (all regions) ean. Feature M Ile (Molar %) Average residue weight Ala (Molar %) Asp (Molar %) Acidic (Molar %) Tiny (Molar %) Small (Molar %). SD. SD. Mean. SD. 2.25. 3.98. 1.52. -. -. 109.30. 4.12. 108.98. 2.80. -. -. 8.28 4.49. 3.07 1.91. 10.99 16.01. 2.80 1.60. + +. -. 10.79. 3.91. 11.70. 2.21. +. -. 31.58. 6.98. 32.94. 3.90. +. -. 51.97. 6.95. 54.53. 4.41. +. -. (N48-95) ean. Ile (Molar %) Average residue weight Ala (Molar %) Asp (Molar %) Acidic (Molar %) Tiny (Molar %) Small (Molar %). 4. Discussion. direction*. 5.74. pathogen Feature M. symbiont (all regions) mean. SD. symbiont (N48-95) mean. In this wor k, we identified the seven most -discriminating featu res between pat hogenic and symbiotic T3SS effector proteins, using a large combination of phy sicochemical features, analyzed b y GBIC of KLR. The identified features were successfully us ed to class ify the proteins by SVM, with sensitivities and specificities of over 80%. The seven mo st-discriminating features were those related to a mino acid compositi on. No ot her hi gher-order inf ormation wa s f ound to be as di scriminating by GBIC o f KL R. Interestingly, recently reported common features of T3SS ef fectors we re als o found to be amino acid com position or shared s equence m otif. E mbedded features i n the am ino aci d sequence or composition may be a characteristic of T3SS effector proteins. The most discriminating region between pathogenic and symbiotic effector proteins was 48-95 resi dues fro m the N-ter minus. The classic signal peptide secretion signal is 15-40 residues f rom t he N-ter minus (27). Common feature s of T3SS ef fectors protein s were recently found t o be em bedded in 30 (1 0) or u p to 50 resi dues (9) at the N-ter minus. These findings are co mplementary with our s becau se the dif ferences between p athogenic an d symbiotic ef fector protein s are thought to ha ve arisen after the co mmon f eatures in the N-terminus. Although co mmon feature s ar e conserve d, dif ferences in amin o aci d composition occur, presumably because of di fferent environments of pat hogens, or sy mbiotic relationships with their hosts. The identified discriminating fe atures were used for cla ssification, and f or elu cidating their interdepe ndence usin g graphical mode ling that comb ined non-linear nonpara metric regression and Bayesian network. Although these techniques are usually used for estimating gene network s from microarray expression data, the combination of them, with featur e selection, wa s a powerf ul metho d for a deeper under standing o f the meaning of t he discriminating features. This is the fir st study to ex plore discri minating features between pathog enic and symbiotic T3SS ef fector prot eins, usin g a combination of computational stati stical and machine-learning approaches. The most-discriminating features, their interde pendence, and the most-discriminating region were determined by these methods. This study will provide a methodological basis for futu re research, and provides important insight about t he functional differences between pathogenic and symbiotic T3SS effectors.. direction* SD. Mean. Regi on. 5.30. 4.09. 3.84. 2.81. -. -. 109.26. 6.41. 109.79. 4.34. +. -. 9.06 3.07. 4.55 2.27. 10.78 5.88. 5.25 3.46. + +. + +. 8.92. 5.69. 11.15. 4.91. +. -. 32.35. 10.64. 33.08. 8.05. +. -. 51.68. 10.95. 53.91. 6.69. +. -. * from pathogenic to symbiotic (“+” means “more in symbiotic proteins”). 7. ⓒ 2010 Information Processing Society of Japan.
(8) Vol.2010-BIO-21 No.16 2010/6/19. 情報処理学会研究報告 IPSJ SIG Technical Report. 23.. Acknowledgement The computational calculations we re carried out at the Hum an Genome Center at the Institute of Medical Science, the University of Tokyo. This work was supported by a grant from the Science and Technology Foundation of Japan to Koji Yahara.. 24. 25. 26. 27.. Referecnes Cornelis, G. R. (2006) Nat Rev Microbiol 4, 811-25. Coburn, B., Sekirov, I. & Finlay, B. B. (2007) Clin Microbiol Rev 20, 535-49. Hernandez, L. D., P ypaert, M ., F lavell, R. A. & Galan, J. E. (2003) J Cell Biol 163, 1123-31. 4. Boyle, E. C., Brown, N. F. & Finlay, B. B. (2006) Cell Microbiol 8, 1946-57. 5. Yoshida, S., Katayama, E., Kuwae, A., Mimuro, H., Suzuki, T. & Sasakawa, C. (2002) Embo J 21, 2923-35. 6. Beeckman, D. S. & Vanrompay, D. C. (2009) Curr Issues Mol Biol 12, 17-42. 7. Coombes, B. K. (2009) Trends Microbiol 17, 89-94. 8. Horn, M ., Collingro, A ., S chmitz-Esser, S ., Beier, C. L., Purk hold, U., Fart mann, B., Brandt, P., Nyakatura, G. J., Droege, M., Frishman, D., Rattei, T., Mewes, H. W. & Wagner, M. (2004) Science 304, 728-30. 9. Arnold, R., Brandm aier, S., Kleine, F., Tischler, P., Heinz, E., Behrens, S., Niinikoski, A., Mewes, H. W., Horn, M. & Rattei, T. (2009) PLoS Pathog 5, e1000376. 10. Samudrala, R., Heffron, F. & McDermott, J. E. (2009) PLoS Pathog 5, e1000375. 11. Grynberg, M. & Godzik, A. (2009) PLoS Pathog 5, e1000398. 12. Kambara, K., Ardissone, S., Kobayashi, H., Saad, M. M., Schumpp, O., Broughton, W. J. & Deakin, W. J. (2009) Mol Microbiol 71, 92-106. 13. Masson-Boivin, C., Girau d, E., Perret, X. & Batut, J. (2009) Trends Micr obiol 17, 458-66. 14. Dale, C. & Moran, N. A. (2006) Cell 126, 453-465. 15. Lower, M. & Schneider, G. (2009) PLoS One 4, e5917. 16. Rice, P., Longden, I. & Bleasby, A. (2000) Trends Genet 16, 276-7. 17. Bendtsen, J. D. , Nielsen, H., von Heijne, G. & Brunak, S. (2004) J Mol Biol 340, 783-95. 18. Lepage, Y. (1971) Biometrika 58, 213-217. 19. Zhu, J. & Hastie, T. (2001) Journal of Computation al and Graphical S tatistics 14, 1081-1088. 20. Cawley, G. C. & Talbot, N. L. (2008) Machine Learning 71, 243 - 264. 21. Konishi, S., Ando, T. & Imoto, S. (2004) Biometrika 91, 27-43. 22. Imoto, S., Goto, T. & Miyano, S. (2002) Pac Symp Biocomput, 175-86.. 1. 2. 3.. 8. Imoto, S., Suny ong, K., Goto, T ., Aburatani, S., Tashiro, K., Kuhara, S. & Miy ano, S. (2002) Proc IEEE Comput Soc Bioinform Conf 1, 219-27. Nabney, I. (2001) NETLAB: algorithms for pattern recognition (Springer, London). Murphy, K. P. (2001) Computing Science and Statistics. 33, 331-350. Leray, P. & Francois, O. (2006) (Laboratoire PSI, Universitè et INSA de Rouen. von Heijne, G. (1985) J Mol Biol 184, 99-105.. ⓒ 2010 Information Processing Society of Japan.
(9)
図
+2
関連したドキュメント
題護の象徴でありながら︑その人物に関する詳細はことごとく省か
の点を 明 らか にす るに は処 理 後の 細菌 内DNA合... に存 在す る
孕試 細菌薮 試瞼同敷 細菌数 試立干敷 細菌数 試瞼同轍 細菌撒 試強弓敷 細菌敷 試瞼同敷 細菌藪 試瞼同数 細菌数 試瞼回数 細菌撒 試立台数 細菌数 試験同数
6.「クロールカルクJハ良質ノモノ詠出ノタメ工業
たらした。ただ、PPI に比較して P-CAB はより強 い腸内細菌叢の構成の変化を誘導した。両薬剤とも Bacteroidetes 門と Streptococcus 属の有意な増加(PPI
(G1、G2 及び G3)のものを扱い、NENs のうち低分化型神経内分泌腫瘍(神経内分泌癌 ; neuroendocrine carcinoma; NEC(G3)
がんの原因には、放射線以外に喫煙、野菜不足などの食事、ウイルス、細菌、肥満
3F西 回復期リハビリ病棟 パソコンの周囲に擦式用アルコー ル製剤の設置がありませんでした。
