Determinants of Changes and Levels in Discount
Rates for Defined-Benefit Pension Plans
journal or
publication title
International review of business
number
11
page range
65-94
year
2011-03
Determinants of Changes and Levels in Discount Rates
for Defined-Benefit Pension Plans
Eriko KASAOKA*
Abstract
This paper examines the effects of firms’ financial factors on discount rate choices for pension accounting. Pension obligations are calculated based on firms’ future prospects; therefore, firms have to use assumptions to estimate obligations. Several prior papers show that managers change their actuarial assumptions to reduce their pension obligations and manage their earnings. Japanese accounting standard for employee benefits had required firms until 2008 to determine their discount rates with consideration of an average discount rate of past five-year market yields, whereas IFRS and US-GAAP require firms to review their discount rates annually. In this paper, five factors were included in order — profitability, leverage, pension funding status, cash flows from operating activities, and tax-paying status — to determine whether Japanese firms also use discount rates for earnings management. The results suggest that profitability, leverage, pension funding status, and cash flows from operating activities can be factors for firm managers to determine or change firms’ discount rates. Therefore, firms’ other financial factors affect the setting of discount rates. The conclusion is that Japanese firms also manage earnings through pension accounting.
Keywords: actuarial assumptions, discount rate, earnings management
1. Introduction
International Accounting Standard No.37: Provisions, Contingent Liabilities and
Contingent Assets (IAS37) states that a provision should be recognized when an entity has a
present obligation as a result of a past event, it is probable that an outflow of resources embodying economic benefits will be required to settle the obligation, and a reliable estimate can be made of the amount of the obligation (IAS37, par.IN2). Pension is defined as future payment of employees’ salary. The future payment has to be discounted and recognized as “present obligations”. Firms use some actuarial assumptions to estimate the present obligations. The accounting method makes pension accounting difficult to understand for financial statement users.
Changes in actuarial assumptions have a significant effect on the calculation of pension obligations. However, only a few actuarial assumptions are disclosed in footnotes. Several * Ph.D Student, Graduate School of Business Administration, Kwansei Gakuin University, Japan
papers show that managers change their actuarial assumptions to reduce their pension obligations and manage their earnings. In Japan, discount rates were determined with consideration of an average discount rate of past five-year market yields until 2008, whereas International Financial Reporting Standards (IFRS) and Statements of Financial Accounting Standards (SFAS) require firms to review their discount rates annually. Under this condition, it seems to be more difficult for Japanese firms to use actuarial assumptions to control pension obligation amounts and manipulate their earnings than firms that adopt IFRS or SFAS.
Therefore, this paper examines whether other financial factors affect the change or level of discount rates, and firms use actuarial assumptions for their earnings management.
2. Categories of Actuarial Assumptions
There are some assumptions made, including discount rate, expected rate of return on plan assets, and future salary and benefit levels, to determine the entity’s pension cost. International Accounting Standard No.19: Employee Benefits (IAS19) states that these assumptions must be unbiased and mutually compatible (IAS19, par.72). IAS19 classifies them according to their characteristics as follows (IAS19, par.73):
(a) Demographic assumptions
(i) mortality, both during and after employment
(ii) rates of employee turnover, disability and early retirement
(iii) the proportion of plan members with dependants who will be eligible for benefits (iv) claim rates under medical plans
(b) Financial assumptions (i) the discount rate
(ii) future salary and benefit levels
(iii) in the case of medical benefits, future medical costs, including, where material, the cost of administering claims and benefit payments
(iv) the expected rate of return on plan assets
In pension financing, actuarial assumptions including mortality, rates of employee turnover, the discount rate, future salary increase, and the expected rate of return on plan assets are mainly used to estimate pension obligations1. There are some differences in these assumptions between the Japanese accounting standard on employee benefits and other international accounting standards. Therefore, the details of these five assumptions are discussed below.
1 Kobayashi, Nobuyuki and Fujiwara, Satoru, Accounting Practice on Employee Benefits, Tokyo: Toyo
2.1 Mortality
A mortality rate is a death rate at each age during employees’ tenure of office and after their retirement. It is calculated based on the population mortality table of each country a firm operates. Mortality rates in each country are different, but it is not well-known that this has a significant effect on the amount of pension liability within pension funding valuations. Only a quarter of the firms provide mortality assumptions in their financial statements2.
Verrall, Sithole, and Habeman (2005) examine current practice on mortality assumptions in the EU. Their paper consists of two analyses, in-country analysis and cross-country analysis. In in-country analysis, they focus on the probability of death; the expected future lifetime for an individual aged x years; probabilities of survival conditional on reaching ages 50, 60, 65 and 70; and the expected present value of annuities at a reference rate of interest. Regarding cross-country analysis, they show observed and assumed future life expectancy for a male or female aged 65, the ratio of typically assumed probability of death for a male or female member aged 65, the annuity value for a male or female aged 65, and so on. They compare these data in each country, and conclude that current practice varies considerably across the EU, and the mortality assumption can have a significant effect on the liabilities in firm balance sheets. Collins (2001) also examines how firms across the EU use different actuarial methods and assumptions. He mentions how some countries, such as Denmark and Portugal, use a single mortality rate at each age while most countries including Ireland, United Kingdom, and Luxembourg apply different mortality rates to actives, pensioners, and
2 Ernst&Young, IFRS -Observations on the Implementation of IFRS-, September 2006, p.68.
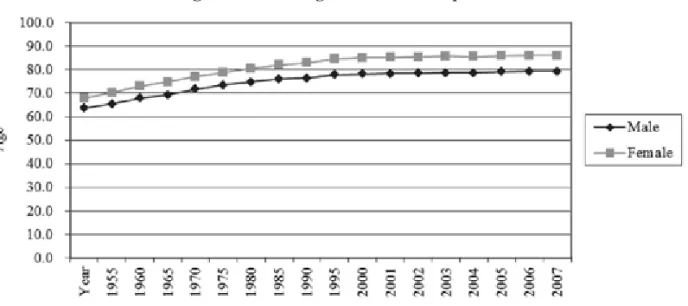
Figure 2.1 Average Lifetime in Japan
Source: Ministry of Health, Labour and Welfare, “Abridged Life Table in 2008,”
disability pensioners.
There are three pension funds in Japan based on defined benefit plans, employees’ pension fund, defined benefit corporate pension, and tax-qualified pension plan. Tax-qualified pension plans will be abolished in March 2012. Therefore, employees’ pension fund and defined benefit corporate pension will be discussed below. Firms that have employees’ pension fund rely partly on the mortality rates indicated in a notification provided by the Ministry of Health, Labour and Welfare. Firms having defined benefit corporate pension use the mortality rates regulated by the enforcement ordinance of defined benefit corporate pension3. They both provide that assumptions including mortality rate shall be the same rate as the one used in the last funding valuations when there is no significant effect on pension funding valuations. However, when the rate is revised, the change has to be reflected in the valuations.
3 Pension Fund Association, “Glossary,” http://www.pfa.or.jp/yogoshu/yo/yo06.html.
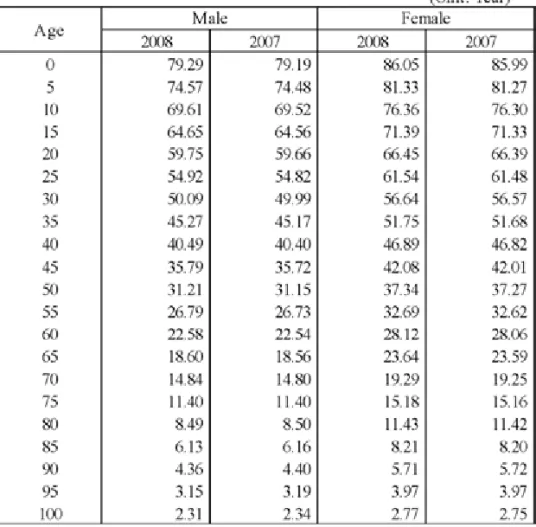
Source: Ministry of Health, Labour and Welfare, “Abridged Life Table in 2008,”
http://www.mhlw.go.jp/toukei/saikin/hw/life/life08/dl/gaikyou01.pdf, p.2. Table 2.1 The Expected Future Lifetime at Age x in Years
In general, when people live longer, the mortality rate becomes lower, and as a result, the estimated amount of pension obligation increases. With the improvement of medical care quality and hygiene, mortality rates all over the world are getting lower. As shown in Figure 2.1, average lifetime is increasing every year in Japan. Table 2.1 also indicates that the expected future lifetime at age x in 2008 was longer than in 2007. It can be predicted that the mortality rate used in pension funding valuations must be getting lower.
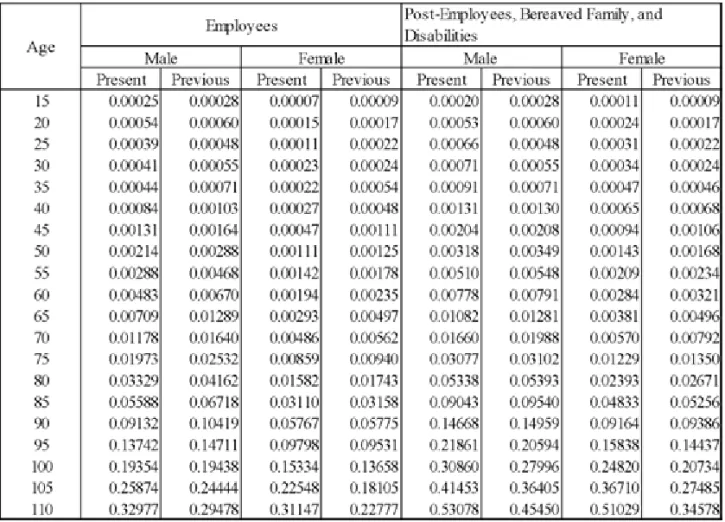
Because of the increase in the average lifetime, the Ministry of Health, Labour and Welfare revised the mortality rate tables for employees’ pension fund in 2009. In Table 2.2, most of the rates under age 90 in the current tables are lower than the previous one, except in the case of female post-employees, bereaved family, and disabilities. Because of the longer average lifetime for females, all rates for women are lower than those for males.
Table 2.3 shows comparisons of the average lifetime in each country. Japan has the second
Table 2.2 Tables of Mortality Rates on Employees’ Pension Fund
Source: Ministry of Health, Labour and Welfare, Amendments of Financial Administration Policy on Employees’ Pension Fund, Tokyo: MHLW, September 30th, 2009.
Table 2.3 Average Lifetime in Each Country
Note : The population is a mid-year estimate. For Japan, it is estimated as of October 1st, 2008. Source : Ministry of Health, Labour and Welfare, “Abridged Life Table in 2008,”
http://www.mhlw.go.jp/toukei/saikin/hw/life/life08/dl/gaikyou01.pdf, p.4.
Year Population
Country Calculated Male Female (millions)
Japan 2008 79.3 86.1 126.0 AFRICA Algeria 2000 72.5 74.2 33.5 Egypt 2006 69.2 73.6 72.0 Nigeria 2000-2005 52.0 52.2 140.0 South Africa 2004 49.9 52.9 47.4 Tunisia 2007 72.3 76.2 10.1
NORTH AMERICA Canada 2005 78.0 82.7 32.7
Mexico 2008 72.7 77.5 104.9
United States 2006 75.1 80.2 299.4
SOUTH AMERICA Argentina 2000-2001 70.0 77.5 39.0
Brazil 2007 68.8 76.4 186.8 Chile 2005 75.5 81.5 16.4 Peru 1995-2000 65.9 70.9 27.4 ASIA China 2000 69.6 73.3 1311.0 India 2001-2005 62.3 63.9 1117.7 Indonesia 2002 64.2 68.1 222.1 Israel 2007 78.8 82.5 7.1 Korea, Republic of 2007 76.1 82.7 48.3 Malaysia 2007 71.7 76.5 26.6 Singapore 2007 78.2 82.9 4.5 Thailand 2002 69.9 74.9 65.3 EUROPE Austria 2008 77.6 83.0 8.3 Belgium 2004 76.5 82.4 10.5 Czech Republic 2008 74.0 80.1 10.3 Denmark 2007-2008 76.3 80.7 5.4 Finland 2008 76.3 83.0 5.3 France 2008 77.5 84.3 61.4 Germany 2005-2007 76.9 82.3 82.4 Iceland 2008 79.6 83.0 0.3 Italy 2006 78.4 84.0 58.9 Netherlands 2008 78.4 82.4 16.4 Norway 2008 78.3 83.0 4.7 Poland 2008 71.3 80.0 38.1 Russian Federation 2006 60.4 73.2 142.5 Spain 2005 77.0 83.5 44.1 Sweden 2008 79.1 83.2 9.1 Switzerland 2007 79.4 84.2 7.5 United Kingdom 2005-2007 77.2 81.5 60.6 OCEANIA Australia 2005-2007 79.0 83.7 20.7 New Zealand 2005-2007 78.0 82.2 4.2 (Unit : Years)
highest lifetime for men and the highest for women. This means that the mortality used in pension funding valuations for Japan must be lower than other countries. This will not be a big problem if investors compare firms within Japan. However, the method of setting the rate and the rate itself must be different in each country, and the rate has a significant effect on pension funding valuations. Therefore, the rate should be required to be disclosed on financial statements.
2.2 Rates of Employee Turnover
The rate of employee turnover is an estimated rate of the number of employees who retire at each age in relation to the average number of employees. Generally speaking, it is calculated based on the past record, excluding abnormal values on mass layoffs or retirement in each firm. The rate varies for industry segments and individual firms. In general, the ratio is high around 20’s, it becomes stable after 30 years of age, and it gets very high around retirement age. When the rate of employee turnover is high, the estimated amount of pension obligations becomes smaller4.
The formula to calculate pension obligations is as follows. The first three factors calculate the estimated total amount of employee benefits at the retirement. A rate of employee turnover is a factor to indicate the probability that employees receive their employee benefits5.
From a different point of view, Ippolito (1997) studies the relation between pensions and quit rates. The study proves that wage increase and pensions are important factors for employees to decide to stay at their firms. Therefore, if firms provide good salaries and pensions to employees, it affects three factors in the formula above — employee’s current salary, future salary increase, and rate of employee turnover — and as a result, increases pension obligations.
2.3 Discount Rate
The International Accounting Standards Board (IASB) required an entity to use the
4 Chuo Audit Corp. & NLI Research Institute, Accounting and Tax Practice on Corporate Pension,
Tokyo: Nikkei Inc., 1999, p.62.
5 Emura, Hiroshi, and Inoue, Masahiko, The New Retirement Benefit Scheme and the Practical
Accounting, Tokyo: Nikkei Inc., 2002, p.27.
Employee’s current salary × Future salary increase Remaining years of continuous employment Rate of pay at retirement Rate of employee turnover × × × ×
Years of continuous employment at fiscal year end Years of continuous employent at retirement 1 1 + Discount ratediscount rate determined by reference to market yields on high quality corporate bonds at the end of the reporting period, and if there is no deep market for these bonds, the entity had to use the market yields on government bonds (IAS19, par.78). As a result of the recent global financial crisis, the difference between yields on corporate bonds and yields on government bonds has a significant effect on the amount of pension obligations. Therefore, IASB has decided not to use the market yields on government bonds. If there is no deep market for such bonds, it requires an entity to apply the principles and approach in International Accounting Standard No.39: Financial Instruments: Recognition and Measurement. IASB believes that this accounting change will improve comparability in financial statements across entities and through time for the same entity (Exposure Draft, pars.78, BC4).
Japanese accounting standard provides that an entity shall determine the discount rate based on yields on safe and secure long bonds. The safe and secure long bonds include government bonds, government agency securities, and high-grade corporate bonds (Accounting Standard for Employee Benefits, Appendix 6). High-grade corporate bonds means bonds with better than AA grades assigned by several credit-rating agencies— Standard & Poor’s, Rating and Investment Information Inc., or Japan Credit Rating Agency, Ltd. (Practical Guidelines on Accounting Standard for Employee Benefits (Progress Report), 11). Basically, yields of these corporate bonds are set higher than government bonds because of their lower credit capability.
The discount rate was determined with consideration of an average discount rate of past five-year market yields in each firm. With the ongoing convergence project with IASB, Japanese accounting standard eliminated the requirement to use the average rate of past five-year market yields, because there is no adequate reason that can explain why this discount rate is more reliable than the one calculated by a market yield at the balance sheet date (Amendments to Accounting Standard for Employee Benefits No.3, Appendix 11). Therefore, now Japanese accounting standard requires firms to review the discount rate annually.
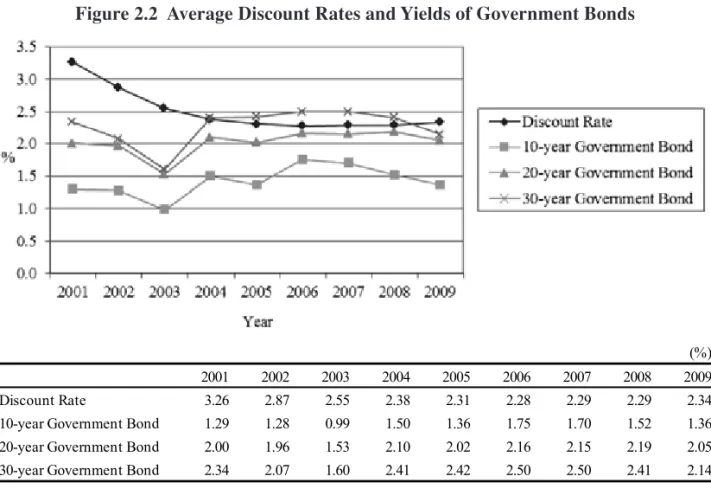
Figure 2.2 compares average discount rates with government bond rates from 2001 to 2009. The data were collected from Nikkei Economic Electronic Databank System (2009), which is provided by the Nikkei Digital Media, Inc.. Firms were selected which set both discount rates and expected return rates for accounting standard on employee benefits, because it is possible that firms do not have pension plans if they do not set these rates6.
For the first three years, there is a significant difference between average discount rates and yields on government bonds. The current Japanese accounting standard on employee benefits was introduced in 2001. Firms were not required to recognize pension obligations
6 Suda, Kazuyuki, Empirical Analysis of Accounting Reform, Tokyo: Dobunkan Shuppan, Co. Ltd., 2004,
Figure 2.2 Average Discount Rates and Yields of Government Bonds
Sources : Nikkei Economic Electronic Databank System (2009)
Ministry of Finance Japan, “Auction Announcement and Result,” http://www.mof.go.jp/jouhou/ kokusai/1c010.html.
and plan assets on their financial statements before the accounting change. Therefore, they might have some difficulties in estimating the best discount rates for them according to the new accounting standard. From 2004 to 2009, the movement of average discount rates was similar to the movement on yields of 20 and 30-year government bonds. Firms tend to choose their discount rates between 20-year government bonds and 30-year government bonds.
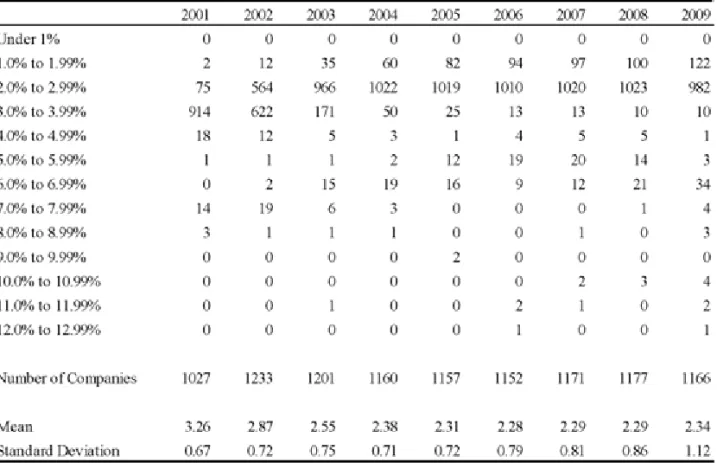
Table 2.4 shows the range of discount rates firms adopt. The chart indicates that firms tended to adopt rates around 3.0 to 3.99% in 2001 and 2002, and 2.0 to 2.99% from 2003 to 2009. Firms adopting SFAS, such as Toyota, Honda, Sony, or Nissan, tended to set higher discount rates. For 2009, the standard deviation was higher than those from 2001 to 2008 because, while most firms chose discount rates between 1.0 and 2.99%, there were 48 firms that assumed rates over 6.0%. The discount rates firms adopted varied more widely than those from 2001 to 2008.
Table 2.5 reports the frequency and level of changes in the discount rate. For the first three years, the frequency of changes on discount rates is high. After 2004, over 80% of firms didn’t change their discount rates. Figure 2.2 also indicates that discount rates and yields of
(%)
2001 2002 2003 2004 2005 2006 2007 2008 2009
Discount Rate 3.26 2.87 2.55 2.38 2.31 2.28 2.29 2.29 2.34
10-year Government Bond 1.29 1.28 0.99 1.50 1.36 1.75 1.70 1.52 1.36
20-year Government Bond 2.00 1.96 1.53 2.10 2.02 2.16 2.15 2.19 2.05
20 and 30-year government bonds became stable after 2004. As mentioned above, a prior Japanese accounting standard prescribed that the discount rate was to be determined with consideration of an average discount rate of past five-year market yields in each firm. However, Table 2.5 shows that over 35% of firms changed their discount rates from 2001 to
Table 2.4 Range of Discount Rates Firms Adopt
Source : Nikkei Economic Electronic Databank System (2009)
Table 2.5 Frequency and Level of Changes in Discount Rates
2004. Over 90% of firms had no change on discount rates, even though there was a big economic slump starting from the bankruptcy of Lehman Brothers in 2007. Thus it was difficult for firms to set appropriate discount rates owing to the introduction of the new accounting standard from 2001 to 2004.
2.4 Future Salary Increase
Future salary increase is based on employee wage administration in each firm, average salary, salary raise in the past, and so on7. It consists of two categories: mandatory pay raise and an across-the-board pay increase. Mandatory pay raise is affected by age-related procession on employees’ salaries. According to Japanese accounting standard, mandatory pay raises should be calculated based on age-specific average salaries according to the statistical data on current employees. An across-the-board pay increase determines movement of future salary levels. The rate is included in the future salary increase only when it is expected to grow for certain (Practices on Accounting for Employee Benefits, Appendix I, 2). On the other hand, IASB states that estimates of future salary increases take account of inflation, seniority, promotion, and other relevant factors (IAS19, par.84). An
across-the-7 Yamaguchi, Osamu, Practice of Pension Obligations, Tokyo: Chuokeizai-sha, Inc., 2000, p.130.
Table 2.6 Rates of Future Salary Increase
board pay increase is included in the calculation of pension obligations. The definition of future salary increase IASB states is wider than that in Japanese accounting standard.
Japanese accounting standard doesn’t require firms to disclose the rates of future salary increases. However, SFAS require the disclosure of the rate on financial statements. There are 18 Japanese firms listed on New York Stock Exchange. The rates of future salary increases for these firms are shown in Table 2.6.
The level of the rate each firm chooses depends on the firm’s management condition, salary increase scheme, and economic situation it is in. Most of firms in Table 2.6 chose rates from 2.0 to 4.0%. Firms tend not to change their rates significantly every year. As mentioned above, there was the bankruptcy of a big investment bank in 2007, and worldwide recession spread after that. However, most firms still keep their rates level, and some firms even assume higher rates. This rate might be easier to predict than other assumptions, such as a discount rate or an expected rate of return, since there are fewer uncertainties.
2.5 Expected Rate of Return on Plan Assets
The expected rate of return on plan assets (ERR) is based on market expectations, at the beginning of the period, for returns over the entire life of the related obligation (IAS19, par.106). Japanese accounting standard states that ERR is assumed with consideration of investment portfolio, management performance in the past, management policy, and the market for plan assets that firms hold (Practical Guidelines on Accounting Standard for Employee Benefits (Progress Report), 12). Imafuku (2000) states the reasons why ERR is set based on different information from that of the discount rate8:
- ERR is an expected rate rather than a realized rate. The amount of pension obligation calculated by the expected rate isn’t based on present value.
- It shall impair comparability if the amount of pension obligations is influenced by management of plan assets.
- Risks and uncertainty on future cash flows of pension obligations are not related to expected yield rates of plan assets.
In accounting standards, the definition of pension obligations is different from that of plan assets. Therefore, the method of setting ERR should be different from the one for the discount rate.
There are many papers examining the relationship between earnings manipulation and ERR. Bergstresser, Desai, and Rauh (2006) find firms use higher assumed ERR when they prepare to acquire other firms, when they are near critical earnings thresholds, and when their managers exercise stock options. Managers can use pension accounting to boost reported
profits on financial statements, and as a result, to influence stock prices. Li and Klumpes (2007) suggest that highly leveraged firms and underfunded firms systematically report higher ERRs. They also show that sample firms with higher leverage have a greater propensity to increase reported ERRs9. These results support the premise that UK managers inflate reported ERRs when they face a higher probability of technical default. Yoshida (2009) finds that unprofitable firms tend to choose higher ERRs. In a limited way, if firms can achieve their return on assets (ROA) in the previous fiscal year, they increase their ERRs.
In light of this situation, additional information on ERR might be useful to investors. There are some firms that disclose the ERR on plan assets, such as equities, bonds, property, etc. The IASB couldn’t mandate this information to be on financial statements, because there was resistance from those who commented on the exposure draft10. Also, Amir and Benartzi (1998) suggest considering enforcement of disclosure requirements regarding pension asset composition, because their study shows pension asset composition information is positively
9 However, they suggest that there is no evidence on the ERR being used to smooth earnings under
Financial Reporting Standard No.17: Employee Benefits.
10 Ernst&Young, Ibid., pp.68-69.
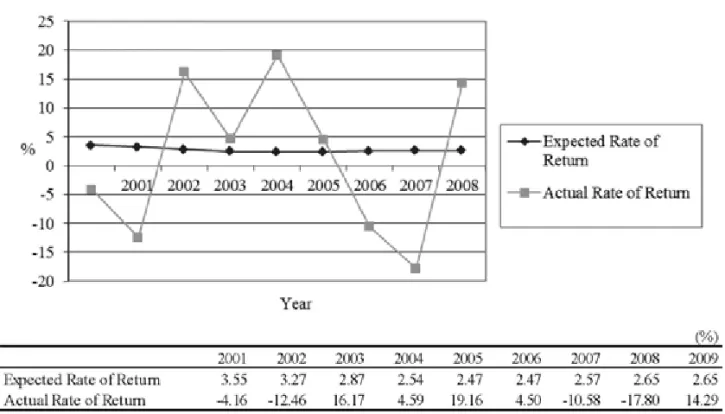
Figure 2.3 Average Expected Rates of Return and Actual Rates of Return
Sources : Nikkei Economic Electronic Databank System (2009)
Pension Fund Association, “The Movement of Adjusted Earning Yields on Pension Assets,” http://www.pfa.or.jp/jigyo/tokei/shisanunyo/shisanunyo01.html.
correlated with the future actual return on plan assets11. Such accounting standards might improve the comparability among firms in different countries.
Figure 2.3 presents average expected rates and actual rates of return on employees’ pension fund and defined benefit corporate pension. It is apparent from the graph that average expected rate in each year is always different from the actual rate of return.
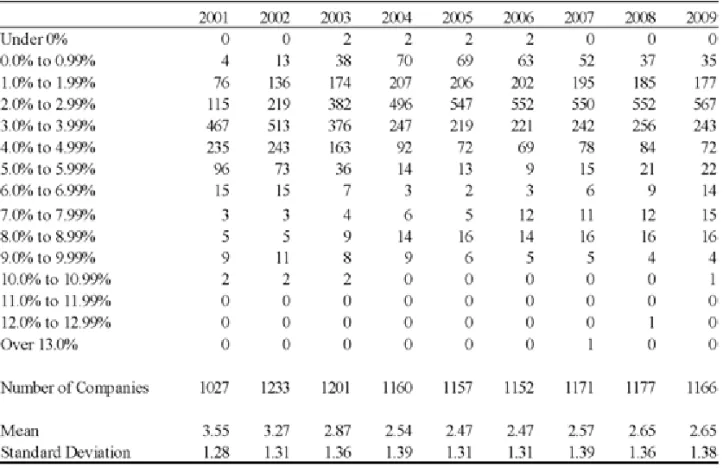
Table 2.7 reports the range of ERRs firms adopt. Most of firms choose ERRs from 1.0 to 4.99%. The standard deviation in each year is higher than that for discount rates. It means that the range of ERRs firms select is wider than that for discount rates.
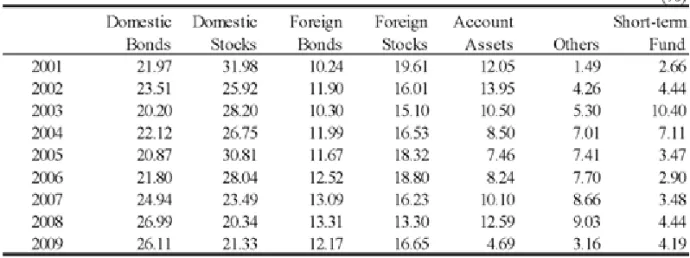
Table 2.8 and 2.9 explain the movement of actual rates of return in Figure 2.3. Employees’ pension fund and defined benefit corporate pension invest 40% to 50% of their assets in domestic and foreign stocks.
In 2002, the Nikkei Stock Average tumbled to a new low after the Japanese economic
Table 2.7 Range of Expected Rates of Return Firms Adopt
Source : Nikkei Economic Electonic Databank System (2009)
11 Their study also indicates that the ERR is not significantly associated with the future actual return on
bubble burst. The recession in the U.S. and the bankruptcy of WorldCom made foreign stock prices decline further. In 2003, worldwide monetary policy relaxation increased domestic and foreign stock prices. In 2004, the decrease of GDP in Japan, the increase in crude oil prices, and monetary tightening in China decreased domestic stock prices. In 2006, there was a worldwide decline in stock values, stock prices in China declined, and the financial crisis in the U.S. was triggered by defaults on sub-prime mortgage loans. In 2007, sub-prime mortgage loans grew into a serious problem, and they affected all domestic and foreign bond and stock prices. In 2008, the bankruptcy of the big investment bank, Lehman Brothers led to a global economic slowdown12.
12 Pension Fund Association, “The Survey and Comment on Pension Asset Management,” http://
www.pfa.or.jp/jigyo/tokei/shisanunyo/jittai/index.html.
Table 2.9 Pension Asset Structure
Source : Pension Fund Association, “The Survey and Comment on Pension Asset Management,”
http://www.pfa.or.jp/jigyo/toukei/shisanunyo/jittai/index.html.
Table 2.8 Rates of Return Categorized by Assets
Source : Pension Fund Association, “The Survey and Comment on Pension Asset
Table 2.10 reports how often and how much firms change their ERRs. Comparing the data to that in Table 2.5, firms change their ERRs more than their discount rates, except in 2001 and 2002. Similar to the tendency of changes in discount rates, many firms changed their ERRs from 2001 to 2003, and had no change in ERRs after 2004.
Many factors affect the determination of ERRs. These factors include much uncertainty concerning economic movement all over the world. The average ERRs are stable, however, average actual rates of return moves up and down every year. It means that volatility on ERRs is quite high.
3. Prior Research
These results above indicate how different actuarial assumptions selected by each firm are. All actuarial assumptions are not disclosed on financial statements. Okumura (2005) states that if a firm’s discount rate is increased 1% from 3% to 4% under certain conditions — employees’ average age is 40 year-old, retirement age is 60 year-old, and period of benefit is for 15 years — the Predicted Benefit Obligations (PBO) will drop by 23%. Therefore, these rates have a significant effect on the calculation of pension obligations and pension cost. Several studies show there is a possibility that managers in firms control these assumptions to make their financial statements look better.
Morris, Nichols, and Niehaus (1983) discuss why firms change actuarial assumptions. They indicate that firms change their assumptions due to a decrease of pension expense and an increase in the reported income figure, an advantage in tax status of pension contributions and plan earnings, and a decrease of pension obligation. They conclude that corporate managers consider the extent of a plan’s overfunding or underfunding when they decide how much they change their actuarial assumptions. Bodie, Light, Morck and Taggart (1987) find a pension fund liability on financial statements is systematically linked to firms’ profitability
Source : Nikkei Economic Electrionic Databank System (2009)
through the choice of a discount rate. More profitable firms tend to choose lower discount rates, which leads to a greater amount of pension liabilities. They also find a relationship between the level of pension funding and firms’ long-run profitability. Ghicas (1990) shows when firms have lower working capital, higher debt, and a lower rate of undertaking new investments, they switch their actuarial cost methods, and reduce their pension funding. Gopalakrishnan and Sugrue (1995) find that leverage and pension plan funding status are related to the choice of actuarial assumptions, the discount rate, and the rate of future salary increase. In their study, firms with higher leverage and pension plan funding choose higher discount rates and lower rates of future salary increases. They suggest that firms might set these rates in a manner that is favorable to them.
Godwin, Goldberg and Duchac (1996) examine whether six factors — changes in cash flows, earnings per share, tax status, leverage, dividends, and the market interest rate — affect the choice of actuarial assumptions or not. Their study provides evidence that managers are likely to increase actuarial assumptions in response to tighter dividend restrictions, lower earnings, higher leverage, and reductions in the tax benefits of plan funding. Asthana (1996) examines the effects of firms’ financial and pension profiles on their funding strategies and actuarial choices, using factors similar to those of Godwin, Goldberg and Duchac (1996). This paper’s results indicate that when firms have greater profitability, greater cash flows from operating activities, lower tax liability, and smaller debt, they tend to choose conservative actuarial choices to maximize contributions. Conversely, when firms have smaller profitability, smaller cash flows from operating activities, higher tax liability, and larger the debt, they tend to select liberal actuarial choices to minimize contributions. Funding status also affects firms’ actuarial choices. Firms overfunded make conservative actuarial choices, and those underfunded make liberal actuarial choices to avoid pension costs. Obinata (2000) examines what factors affect firms’ choices on discount rates, and reports that profitability has an impact on firms’ choices. This paper also studies if stock prices reflect the size of pension discount rate. It indicates that firms choosing lower pension discount rates are valued higher.
Most studies suggest that managers tend to manipulate pension transactions as an earnings management tool. Firms’ profitability, debt, cash flows from operating activities, pension funding status, and tax status can be primary factors to determine actuarial assumptions. However, only Blankley and Swanson (1995) examine whether firms manipulate actuarial assumptions consistent with the requirements of Statement of Financial Accounting Standard No.87: Employers’ Accounting for Pensions (SFAS87) as a tool of earnings management. They conclude that there is no evidence of systematic manipulation of actuarial assumptions in order to manage earnings or pension funding.
A revised Japanese accounting standard on employee benefits was introduced in 2001. Prior Japanese accounting rules required disclosing only the content of the pension plan and
the transition method when firms change their pension plans. It didn’t require firms to recognize pension obligations, plan assets, and pension costs on financial statements. When the current accounting standard was introduced, most firms had to recognize significant amounts of pension liabilities on their financial statements. Table 2.5 and 2.10 show that from 2001 to 2004, many firms decreased their discount rates and ERRs, which increased their pension obligation and pension cost amounts, and after 2005, firms tended not to change these assumptions. From 2001 to 2004, firms might have sought proper discount rates for their best estimation of pension obligations and pension costs. After 2005, which is five years after the introduction of the current accounting standard, firms might have been able to decide their actuarial assumptions with consideration of an average discount rate of past five-year market yields. Most of the papers described above prove managers change their actuarial assumptions in response to reduce pension obligations and pension costs. However, Japanese firms were required to decide their actuarial assumptions with consideration of an average discount rate of past five-year market yields. Under this condition, it seems to be difficult for Japanese firms to use pension accounting to manipulate their earnings. Most Japanese firms disclose only their discount rates and ERRs in their footnotes. Discount rates have the most significant effect on the estimated amount of pension liabilities, because pension obligations are higher than plan assets in most Japanese firms. Therefore, this paper will examine whether other financial factors affect firms’ decision on their discount rates to see if Japanese firms also use discount rates for earnings management.
4. Hypothesis Development
Actuarial assumptions are important factors to calculate pension obligations. IASB shows eight assumptions necessary for pension obligation measurement, and each assumption has a significant impact on the measurement. Firms might have incentives to manipulate their earnings by increasing or decreasing these assumptions, because all actuarial assumptions are not disclosed on their footnotes.
This paper will focus on discount rates and investigate if firms change their discount rates when other financial factors change, and if these financial factors have any effect on the choice of discount rates. As explained in Section 2.3, there was an important accounting change with respect to the discount rate, so that the discount rate is now determined with consideration of the yields on safe and secure long bonds at the end of the fiscal year. This research will also try to find whether the discount rate will fluctuate more if it is affected by other financial factors. Factors that might affect the choice of discount rates include profitability, leverage, pension funding status, cash flows from operating activities, tax-paying status, and others. Details of these factors are discussed as follows:
4.1 Profitability
Several papers prove that managers at firms change their actuarial assumptions for earnings management. Increases in discount rates decrease pension obligations and pension costs, and the resulting increase in earnings would yield a better valuation from investors. The first hypothesis of changes in profitability is as follows:
H 1a: A firm whose profitability (income before taxes/ net assets) increases does not change the discount rate. Conversely, the firm whose profitability decreases changes the discount rate.
Asthana (1999), Ghicas (1990), Godwin, Goldberg and Duchac (1996), and Obinata (2000) include profitability in their models to examine the effect of financial ratios on firm’s changes in actuarial methods, and Asthana (1999), Godwin, Goldberg and Duchac (1996), and Obinata (2000)13 present profitability as significant in their models.
For discount rate levels, choosing the higher discount rate decreases the amount of pension obligations and pension costs. Therefore, a firm whose profitability is low might set the discount rate high. The first hypothesis for the levels of discount rates is as follows:
H 1b: The higher the firm’s profitability, the lower the firm’s discount rate. Conversely, the lower the firm’s profitability, the higher the firm’s discount rate.
4.2 Leverage
Statement of Financial Accounting Standards No.158: Employers’ Accounting for Defined
Benefit Pension and Other Post Retirement Plans (SFAS158) requires disclosing unfunded
pension liabilities on the balance sheet. Japanese accounting standard on employee benefits also requires disclosing them on the balance sheet from 2012. Pension deficits are subtracted from shareholders’ equity. Therefore, the effect of pension liabilities on firms’ capital structure is significant. In this paper, debt to equity ratio is employed, which is one of the most important financial ratios to know firms’ leverage and capital risk. The ratio has an effect on the cost of capital, which is the rate of return a firm is expected to earn, because the stakeholders invest at the same risk as the rate of return. It is often used when stakeholders evaluate, invest, or finance the firm. The cost of capital is an important factor on financing and business decisions, and debt to equity ratio also can be the important factor. Under the current Japanese accounting standard, pension liabilities are disclosed in footnotes. They are amortized over several years and affect future earnings. Pension liabilities can be regarded as long-term liabilities. When a firm’s leverage becomes higher, there is a possibility that the firm increases the discount rate to avoid the cost over several years. Therefore, the second
13 In his paper, earnings before income taxes deflated by equity have the most significant effect on the
hypothesis of changes in leverage is as follows:
H 2a: A firm whose leverage (debt to equity ratio) decreases does not change the discount rate. Conversely, a firm whose leverage increases changes the discount rate.
For levels of leverage, when a firm’s leverage is higher, it might use a higher discount rate to eliminate the effect on future earnings. Therefore, the second hypothesis of levels in leverage is as follows:
H 2b: The higher the firm’s leverage, the higher the firm’s discount rate. Conversely, the lower the firm’s leverage, the lower the firm’s discount rate.
4.3 Pension Funding Status
When the Japanese accounting standard on employee benefits was introduced, it became apparent that firms had a considerable amount of pension deficits, and there was a lot of public attention on their pension funding status. Pension obligations provide the greatest share of total liabilities. Li and Klumpes (2007) indicate that higher actuarial assumptions directly contribute to both the existence and magnitude of actuarially determined pension deficits or surpluses for both financial reporting and funding purposes. Gopalakrishnan and Sugrue (1995) suggest that there is a negative correlation between the discount rate and the size of the pension liability, because a large unfunded pension liability could mean a lower credit rating and higher cost of debt for the firms. The levels and changes of discount rates directly affect the amount of pension obligations. Therefore, the third hypothesis of changes in pension funding status is as follows:
H 3a: The firm whose pension funding status decreases does not change the discount rate. Conversely, a firm whose pension funding status increases changes the discount rate.
Pension funding status is calculated by pension obligations divided by plan assets. Higher ratios mean higher unfunded status. Firms might use higher discount rates to reduce their pension liabilities, and make their balance sheets appear better. Therefore, the third hypothesis of levels in pension funding status is as follows:
H 3b: The higher the firm’s pension funding status, the higher the firm’s discount rate. Conversely, the lower the firm’s pension funding status, the lower the firm’s discount rate.
4.4 Cash Flows from Operating Activities
Increases in actuarial assumptions reduce the pension cost and the cash contribution to the pension plans. As a result, cash flows increase for several years after the assumption change. In general, Japanese firms make payments for their employees’ pension as compensation for their work after their retirement (Statement of Position on Accounting Standard for Employee Benefits, 3, 1). Pension is defined as future payment of employees’ salary. Therefore, the increases of cash flows are included in cash flows from operating activities on statements of
cash flows. Obinata (2000) uses both operating cash flows and investing cash flows in his model to see what factors affect firms’ choice of pension discount rates. The result shows that only operating cash flows are significant.
International Accounting Standard No.7: Statement of Cash Flows (IAS7) states that firms need cash and cash equivalents to conduct their operations, to pay their obligations, and to provide returns to their investors (IAS7, par.3). A statement of cash flows enhances the comparability of the reporting of operating performance by different firms, because it eliminates the effects of using different accounting treatments for the same transactions and prices (IAS7, par.4). Therefore, cash and cash equivalents are important factors for users of financial statements to evaluate firms. Firms might choose higher discount rates to increase their cash and cash equivalents if cash decreases. The fourth hypothesis of changes in cash flows from operating activities is as follows:
H 4a: The firm whose cash flows from operating activities increases does not change the discount rate. Conversely, the firm whose cash flows from operating activities decreases changes the discount rate.
It can be also said that firms whose cash and cash equivalents are low might use higher discount rates. Therefore, the fourth hypothesis of levels in cash flows from operating activities is as follows:
H 4b: The higher the firm’s cash flows from operating activities, the lower the firm’s discount rate. Conversely, the lower the firm’s cash flows from operating activities, the higher the firm’s discount rate.
4.5 Tax-Paying Status
Tax deduction is one of the most important reasons firms provide pension plans to their employees. All pension premiums made can be recognized as expense in that year in Japan. When firms make additional contributions to make up for the shortage of pension funding, it is also recognized as expense. Feldstein and Morck (1983) note that the tax law is a strong reason for firms to assume a low interest rate. Their analysis shows that firms with large pension liabilities tend to choose high interest rate assumptions, and firms with overfunded status increase their pension liability amount to enjoy the tax benefits. The assumed interest rate is related to the firm’s unfunded pension status. In our research, only 1,100 out of 10,444 firms have overfunded pension status. Therefore, it might be difficult to see the effect of tax-paying status on discount rate changes and levels in this study. The fifth hypothesis of changes in tax-paying status is as follows:
H 5a: The firm whose tax-paying status decreases does not change the discount rate. Conversely, the firm whose tax-paying status increases changes the discount rate.
Effective tax rate = (Income taxes – Changes in deferred taxes) / Cash flows from operating activities
The fifth hypothesis of levels in tax-paying status is as follows:
H 5b: The higher the firm’s tax-paying status, the lower the firm’s discount rate. Conversely, the lower the firm’s tax-paying status, the higher the firm’s discount rate.
4.6 Other Variables
Firm size and a year dummy variables are added to our models. Larger firms have more employees, therefore, they have larger pension obligations. If firms can manage their plan assets effectively, they can make use of economies of scale. However, as mentioned above, most firms have unfunded pension status, and they don’t manage their plan assets effectively. Therefore, larger firms will choose higher discount rates to reduce their large amount of pension obligations.
5. Research Design
This empirical analysis is based on nine years of annual report data. The time period of this study is from 2001, a year current accounting standard on employee benefits was required, through the latest year, 2009, for which data are available. Firms that are treated in this research design (excluding banks and insurance firms) are listed on the Tokyo Stock Exchange. Firms were selected that set and disclose both discount rates and expected return rates on their financial statements. A sample of 10,444 firms for nine years is identified. Financial data used in this study were collected from Nikkei Economic Electronic Databank System (2009) which is provided by the Nikkei Digital Media, Inc..
To examine our hypotheses on the changes in discount rates, the following model is employed:
△DRit = β0 + β1△PROFit + β2△LEVit + β3△FUNDit + β4△CASHit + β5△TAXit
+ β6SIZEit + ΣδDUMMYit
Variables are explained in Table 5.2 except for the dummy variable. DUMMY is a year dummy. The correlation coefficients for the variables on changes in discount rates are shown in Table 5.1. The result shows that there is a relationship between discount rates and all variables.
Table 5.2 Descriptive Statistics for the Changes in Discount Rates Table 5.1 Correlation for the Changes in Discount Rates
Note : Definitions of the variables are provided in Table 5.2.
△DR= the ratio of change in discount rate on pension obligations as reported under Japanese
account-ing standard on employee benefits between period t-1 and period t.
△PROF= the ratio of change in (income before taxes + pension cost) / net assets between period t-1 and
period t.
△LEV= the ratio of change in (total liabilities – provision for retirement benefits) / net assets between
period t-1 and period t.
△FUND= the ratio of change in (pension obligations – unrecognized actuarial gain or loss) / plan assets
between period t-1 and period t.
△CASH= the ratio of change in (cash flows from operating activities – increase (decrease) in provision for
retirement benefits) / net assets between period t-1 and period t.
△TAX= the ratio of change in (income taxes + pension cost * effective tax rate (40%) – changes in
deferred taxes) / (cash flows from operating activities – increase (decrease) in provision for retirement benefits) between period t-1 and period t.
The result of the regression analysis on the changes in discount rate is in Table 5.3. It reveals that there is a positive relationship between discount rates and leverage, cash flows from operating activities, and firm size, and a negative relationship between discount rates and profitability and pension funding status. Only the effect of tax-paying status is insignificant. However, the coefficient of pension funding status and cash flows from operating activities should have opposite signs as explained in these hypotheses.
Table 5.4 shows the average ratios of changes in discount rates, pension funding status, and cash flows from operating activities from 2001 to 2009. Compared with the average yields of 30-year government bonds in Figure 2.2, the average ratios of discount rates from 2001 to 2003 are set higher than the average yields. From 2004 to 2009, the average ratios are similar to the average yields. Japanese accounting standard states that an entity shall determine the discount rate based on yields on safe and secure long bonds including government bonds, government agency securities, and high-grade corporate bonds. Firms follow the movement of yields of these bonds, including high-grade corporate bonds, which are basically higher than yields of government bonds for the first three years. From 2004, firms started to choose the rates similar to 20 or 30-year government bonds. They might have some difficulties to choose their discount rates from 2001 to 2003, because the accounting standard was quite different from the prior one. From 2004, firms might be able to find their best estimate with consideration of an average discount rate of past several-year market yields. Therefore, firms decreased their discount rates in conjunction with yields on safe and secure long bonds from 2001 to 2003, and as a result, their pension funding status worsened. The data for these first three years might lead to the negative coefficient on pension funding
Table 5.3 The Effect of Financial Ratios on the Changes in Discount Rates
Table 5.4 Average Ratios of Changes in Discount Rates, Pension Funding Status, and Cash Flows from Operating Activities
status in Table 5.3. After 2006, the average ratio of discount rates increases, whereas the average yield of 30-year government bond decreases, and their funding status also increases. This result indicates that firms might use discount rates to reduce their pension obligations.
With regard to cash flows from operating activities, the positive coefficient sign for it in Table 5.3 should be affected by ratios for the first three years. The discount rates decrease from 2001 to 2006. As explained above, firms might have some difficulties in setting appropriate discount rates after the significant accounting change. Therefore, from 2001 to 2003, discount rates decrease, and the amount of cash flows from operating activities also decreases. However, from 2006 to 2009, the average ratios in changes in cash flows from operating activities decrease while discount rates increase. Therefore, after firms learn how the new pension accounting standard works, firms might start to manipulate their earnings through pension accounting.
Leverage has the most significant effect in Table 5.3. Pension liabilities have been already on the balance sheet in the U.S., and will be in Japan. The accounting change reflects that they are important liability factors on balance sheet even though they are off-balance. The Financial Accounting Standards Board (FASB) already noted that it would be conceptually appropriate to recognize a net pension liability or asset measured as the difference between PBO and plan assets when the accounting standard was issued in 1985. However, the approach wasn’t adopted because it might be too great a change from past practice at the time (SFAS87, par.107). Therefore, the effect of pension liabilities on leverage is significant, and they affect the change in firms’ discount rates.
To examine our hypotheses on the levels in discount rates, the following model is employed:
DRit = β0 + β1PROFit + β2LEVit + β3FUNDit + β4CASHit + β5TAXit + β6SIZEit
+ ΣδDUMMYit
The correlation coefficients for the variables on levels of discount rates are shown in Table 5.5. The result shows that there is a relationship between discount rates and profitability, leverage, pension funding status, and firm size.
Table 5.7 shows that there are relationships between discount rates and all other variables except tax-paying status, and they are the same result as in Table 5.3. Leverage and profitability have an effect on levels of discount rates. This means that firms whose financial conditions and operating results are not in good shape tend to choose high discount rates to reduce their pension obligations and pension costs. Regarding with year dummy for both changes and levels in discount rates, the t values from 2001 to 2004 were significant. Therefore, the accounting change in 2001 might have some effects on firms’ discount rate
Table 5.6 Descriptive Statistics for the Levels of Discount Rates Table 5.5 Correlation for the Levels of Discount Rates
Note : Definitions of the variables are provided in Table 5.5.
DR= discount rate on pension obligations as reported under Japanese accounting standard on employee
benefits.
PROF= (income before taxes + pension cost) / net assets.
LEV= (total liabilities – provision for retirement benefits) / net assets.
FUND= (pension obligations – unrecognized actuarial gain or loss) / plan assets.
CASH= (cash flows from operating activities – increase (decrease) in provision for retirement benefits) /
net assets.
TAX= (income taxes + pension cost * effective tax rate (40%) – changes in deferred taxes) / (cash flows
from operating activities – increase (decrease) in provision for retirement benefits.
changes and choices. These results prove that profitability, leverage, pension funding status, and cash flows from operating activities influence the change and level of discount rates.
6. Summary and Conclusion
The current Japanese accounting standard on employee benefits was introduced in 2001. The accounting change revealed that Japanese firms had considerable amounts of pension deficits. Pension is defined as future payment of employees’ salary, and future prospects must be considered to calculate pension obligations and pension costs. Several prior studies prove that firms change the discount rates needed for predictions in their pursuit of earnings management. Therefore, this study proved there is a relationship between changes or levels of discount rates and other financial factors on financial statements.
The result indicates that profitability, leverage, pension funding status, and cash flows from operating activities can be incentives to change and determine firms’ discount rates. Until 2008, Japanese accounting standard required firms to determine their discount rates with consideration of an average discount rate of past five-year market yields. Under this condition, it seemed to be difficult for Japanese firms to change their discount rates for earnings management; however, there was a tendency for firms to change their rates depending on other financial factors. The result also showed that there was a relationship between the levels of discount rates and some other financial factors including firms’ financial condition and management results. Japanese accounting standard now requires firms to review their discount rates annually, and moreover, pension liabilities will be on the balance sheet from 2012. Therefore, there is a possibility that firms change or choose favorable rates to decrease their pension obligations and pension costs, and reduce the negative effect of these amounts on financial statements.
References
Accounting Standards Board of Japan, Accounting Standard for Employee Benefits, Tokyo: ASBJ, June 1998.
Accounting Standards Board of Japan, Amendments to Accounting Standard for Employee Benefits, Tokyo: ASBJ, July 2008.
Accounting Standards Board of Japan, Statement of Position on Accounting Standard for Employee
Benefits, Tokyo: ASBJ, June 1998.
Amir, Eli, and Benartzi, Shlomo, “The Expected Rate of Return on Pension Funds and Asset Allocation as Predictors of Portfolio Performance,” The Accounting Review, Vol.73 No.3, July 1998, pp.335-352. Asthana, Sharad, “Determinants of Funding Strategies and Actuarial Choices for Defined-Benefit Pension
Plans,” Contemporary Accounting Research, Vol.16 No.1, Spring 1999, pp.39-74.
Bergstresser, Daniel, Desai, Mihir, and Rauh, Joshua, “Earnings Manipulations, Pension Assumptions, and Managerial Investment Decisions,” The Quarterly of Economics, February 2006, pp.157-195.
Blankley, Alan I., and Swanson, Edward P., “A Longtidinal Study of SFAS 87 Pension Rate Assumptions,”
Accounting Horizon, Vol.9 No.4, December 1995, pp1-21.
Bodie, Zvi, Light, Jay O., Morck, Randall and Taggart, Robert A. Jr., “Funding and Asset Allocation in Corporate Pension Plans: An Empirical Investigation,” in Issues in Pension Economics, eds. Bodie, Zvi et al., University of Chicago Press, 1987, pp.15-47.
Brown, Stephen, “The Impact of Pension Assumptions on Firm Value,” Working paper, Goizueta Business School at Emory University, September 2004.
Chuo Audit Corp. & NLI Research Institute, Accounting and Tax Practice on Corporate Pension, Tokyo: Nikkei Inc., 1999.
Collinson, David, “Actuarial Methods and Assumptions used in the Valuation of Retirement Benefits in the EU and other European Countries,” Groupe Consultatif Actuariel Europeen, United Kingdom, 2001. Coronado, Julia Lynn, and Sharpe, Steven A., “Did Pension Plan Accounting Contribute to a Stock Market
Bubble?,” Brookings Papers on Economic Activity, 2003, pp.323-371.
Emura, Hiroshi, and Inoue, Masahiko, The New Retirement Benefit Scheme and the Practical Accounting, Tokyo: Nikkei Inc., 2002.
Ernst & Young, IFRS -Observations on the Implementation of IFRS-, September 2006.
Feldstein, Martin, and Morck, Randall, “Pension Funding Decisions, Interest Rate Assumptions, and Share Prices,” in Financial Aspects of the United States Pension System, eds. Bodie, Zvi, and Shoven, John B., pp.177-207, Chicago: University of Chicago Press.
Financial Accounting Standards Board, Statement of Financial Accounting Standards No.87: Employers’
Accounting for Pensions, Stamford, CT: FASB, 1985.
Financial Accounting Standards Board, Statement of Financial Accounting Standards No.158: Employers’
Accounting for Defined Benefit Pension and Other Postretirement Plans, Norwalk, CT: FASB, 2006.
Ghicas, Dimitrios C., “Determinants of Actuarial Cost Method Changes for Pension Accounting and Funding,” The Accounting Review, Vol.65 No.2, April 1990, pp.384-405.
Associated with Changes in Pension-Plan Interest Rate Assumptions,” Journal of Accounting, Auditing
and Finance, Vol.11 No.2, Spring 1996, pp.305-322.
Gopalakrishnan, V. and Sugrue, Timothy F., “The Determinants of Actuarial Assumptions Under Pension Accounting Disclosures,” Journal of Financial and Strategic Decisions, Vol.8 No.1, Spring 1995, pp.35-41.
Imafuku, Aishi, Accounting for Retirement Benefits, Tokyo: Shinsei-sha Co. Ltd., Japan, 2000.
International Accounting Standards Board, Exposure Draft: Discount Rate for Employee Benefits -Proposed
Amendments to IAS19-, London: IASB, August 2009.
International Accounting Standards Board, International Accounting Standard No.19: Employee Benefits, London: IASB, 2004.
International Accounting Standards Committee, International Accounting Standard No.7: Statement of Cash
Flows, London: IASC, 1992.
International Accounting Standards Committee, International Accounting Standard No.37: Provisions,
Contingent Liabilities and Contingent Assets, London: IASC, 1998.
Ippolito, Rechard A., Pension Plans and Employee Performance Evidence, Analysis, and Policy, The University of Chicago Press, Chicago, 1997.
Kobayashi, Nobuyuki and Fujiwara, Satoru, Accounting Practice on Employee Benefits, Tokyo: Toyo Keizai, Inc., Japan, 1999.
Li, Yong and Klumpes, Paul, “Determinants of Expected Rate of Return on Pension Assets: Evidence from the UK,” SSRN Working Papers ID989559, March 2007, pp.1-45.
Ministry of Health, Labour and Welfare, Amendments of Financial Administration Policy on Employees’
Pension Fund, Tokyo: MHLW, September 30th, 2009.
Morris, Michael H., Nichols, William D. and Niehaus, Gregory R., “Considerations Driving Interest Rate Assumption Changes,” Financial Analysts Journal, November 1983, pp.13-15.
Obinata, Takashi, “Choice of Pension Discount Rate in Financial Accounting and Stock Prices,” Discussion
Paper CIRIE-F-82, University of Tokyo, July 2000.
Okumura, Masashi, “Discretion in the Choice of Pension Discount Rate, Projected Benefit Obligation and Stock Price,” The Waseda Commercial Review, Vol.404, June 2005, pp.27-49.
Suda, Kazuyuki, Empirical Analysis of Accounting Reform, Tokyo: Dobunkan Shuppan, Co. Ltd., 2004. The Institute of Actuaries of Japan & The Japanese Society of Certified Pension Actuaries, Practices on
Accounting for Employee Benefits, Tokyo: IAJ&JSCPA, December 2008.
The Japanese Institute of Certified Public Accountants, Report of Accounting Practice Committee Statement No.13, Practical Guidelines on Accounting Standard for Employee Benefits (Progress Report), Tokyo: JICPA, February 2009.
Yoshida, Kazuo, “Determinants of Expected Rate of Return on Pension Assets in Japan,” KAIKEI, Vol.CLXXV No.5, May 2009, pp.52-66.
Verrall, R., Sithole, T., Haberman, S., “International Comparative Study of Mortality Tables for Pension
Fund Retirees,” Cass Business School, London, 2005. http://www.cass.city.ac.uk/media/stories/
resources/mortality.pdf, (accessed 06-10-2010).
Zimmerman, Jerold L., “Taxes and Firm Size,” Journal of Accounting and Economics, No.5, April 1983, pp.119-149.
Ministry of Finance Japan, http://www.mof.go.jp, (accessed 06-10-2010)
Ministry of Health, Labour and Welfare, http://www.mhlw.go.jp, (accessed 06-10-2010) Pension Fund Association, http://www.pfa.or.jp, (accessed 06-10-2010)