早稲田大学大学院 環境・エネルギー研究科 博 士 学 位 論 文
Generation Optimal Mix Planning for Newly Industrializing Country by
K-Best Dynamic Programming
K-ベスト 動的計画法による新興国向けの電力 システム計画最適化
2011
年2
月早稲田大学大学院環境・エネルギー研究科 環境・電力システム研究
Aishah Mohd Isa
i
ABSTRACT
The current electricity situation requires electricity supply industries to be able to co-ordinate between technical, economical, environmental and societal responsibilities when processing power systems planning and operation tasks. The multi-attribute nature of such a problem requires new methodologies to be developed in order to meet all the requirements adequately.
For this doctoral work, a fast, efficient and robust methodology utilizing the K-best dynamic programming approach is proposed for coordinating between the multi-objective planning and operation requirements of power systems. The K-best dynamic programming approach applies mitigation strategies in order to decrease computational complexity and time as well as improving efficiency and accuracy. This proposed methodology would is validated by application to a Newly Industrializing Country.
ii
Acknowledgments
I owe my deepest gratitude to my supervisor, Professor R.Yokoyama and my co-supervisors, Dr T. Niimura and Dr H. Magori for their invaluable guidance and mentorship during my graduate programme culminating in the successful completion of the doctoral course. I would also like to thank the members of my review committee, Professor M. Katsuta, Professor S. Tomonari and Prof K. Iba, for their helpful comments during the grueling thesis review process.
To my family and friends I dedicate my heartfelt thanks and gratitude. None of my achievements would have been possible without their continual encouragement, support and prayers.
It is also a pleasure to thank my colleagues from Yokoyama laboratory for their support and encouragement. Special thanks to our administrative staff, Mrs Kanou and Mrs Inaba, for their guidance in navigating the complicated doctoral review procedures.
Financial support from the Japanese Ministry of Education, Culture, Sports, Science and Technology in the form of the Monbukagakusho Scholarship is also gratefully acknowledged.
Finally, all praise be upon Allah, the Merciful on whom ultimately we depend for sustenance and guidance.
Aishah Mohd Isa February 2011
iii
Table of Contents
Abstract i
Acknowledgments ii
Table of Contents iii
List of Figures vi
List of Tables viii
Chapter 1 General Introduction 1
1. Electrical Supply Industry 1
2. Power Systems Planning 4
3. Newly Industrializing Countries 6
4. The Generation Optimal Mix Problem 7
5. Electricity Generation Technologies 8
6. Research Outline 10
Chapter 1 References 13
Chapter 2 Newly Industrializing Countries Energy Policies 14
1. Definition of Newly Industrializing Countries 14
2. Analysis of Newly Industrializing Countries 17
2.1 Group I: Asian Newly Industrializing Countries 18
2.1.1 Economic Factor for Group I 18
2.1.2 Demographic Factor for Group I 21
2.1.3 Electricity Factor for Group I 22
2.2 Group II: Non-Asian Newly Industrializing Countries 23
2.2.1 Economic Factor for Group II 24
2.2.2 Demographic Factor for Group II 25
2.2.3 Electricity Factors for Group II 25
2.3 Comparison of NICs to a Japan 27
2.4 Summary of Newly Industrializing Countries 28
3. ASEAN NICs 29
3.2. Electrical Supply Scenario for Individual NICs 30 3.2.1 Malaysian Electrical Supply Scenario 30 3.2.2 Thailand Electrical Supply Scenario 31 3.2.3 Philippines Electrical Supply Scenario 32 3.2.4 Analysis of ASEAN NICs Current Energy Scenarios 34
4. Conclusions 39
Chapter 2 References 41
Chapter 3 Forecasting in Power Systems 44
1. Forecasting in Power Systems 44
2. Electricity Demand Forecasting 45
3. Price Forecasting 47
4. Case Studies for Power Systems Forecasting 48
4.1 Long Term Load Forecasting for Malaysian System 48 4.2 Short-term Forecasting of Price for the PJM System 54
5. Summary for Power Systems Forecasting 56
Chapter 3 References 57
iv
Chapter 4 Extended Dynamic Programming for Solving the Power System
Optimal Mix 59
1. Overview of Dynamic Programming 59
2. Theoretical Formulation of Extended Dynamic Programming 60
2.1 Sparse Dynamic Programming 60
2.2 Use of Inferior Solutions 61
2.3 The Extended Dynamic Programming 62
3. Integer-Programming Problem 63
3.1. Integer Programming Problem Formulation 63
3.2 Solution Method by Conventional Dynamic Programming 64 3.3 Solution Method by Extended Dynamic Programming 68 3.4 Effectiveness of Extended Dynamic Programming 69
4. Knapsack Problem 71
4.1 Knapsack Problem 71
4.2 Bounded Knapsack Problem 73
5. Generation Expansion Problem 74
5.1 Generation Best Mix Problem (GMP) Formulation 74 5.2 Generation Best Mix Problem (GMP) Solution 77
5.3 Simulation results and discussion 78
6. Conclusion 82
Chapter 4 References 84
Chapter 5 Reliability and Cost Evaluation for Power Systems
Generation Expansion by K-Best Dynamic Programming 86 1. Reliability and Economic Cost Objectives in a Power Systems 86
2. Economic Cost Evaluation 87
2.1 Economic Cost Evaluation by K-Best Dynamic Programming 87 2.2 Computational Experimentation for the K-best Dynamic Programming
2.2.1 Experimental Setup 88
2.2.2 Experimental Results 89
2.2.3 Summary 91
3. Reliability Evaluation 91
3.1 Reliability Evaluation by Effective Energy Function Approach 92 4. Combining Reliability and Economic Cost Criteria for Generation Mix Planning
4.1 Objective Functions 96
4.2 Problem Formulation 96
4.3 Solution Method 97
4.4 Two-Phase K-best Dynamic Programming Algorithm 97 5. Case Study for the Generation Optimal Mix Problem 99
5.1. Case Study Test Data 99
5.2 Simulation Results 100
5.3 Summary 104
6. Conclusion 104
Chapter 5 References 105
Chapter 6 Application to ASEAN NIC 106
1. Understanding the Malaysian Energy Scenario 106
2. Fuel Technologies for Malaysian Energy Production 109 3. K-Best Dynamic Programming Multi-criteria Trade-Off Method 110
3.1 Objective Functions 110
v
3.2 Problem Formulation 111
3.3 Solution Method 112
3.3.1. Phase I: K-Best DP for Economic Cost Function 112 3.3.2. Phase II: Effective Energy Function Approach for
Reliability and Environmental Impact Function 112
3.3.3. Trade-off and Evaluation 113
3.3.4 Flowchart for Solution Algorithm 114
3.4 Simulation and Results 115
3.4.1 Case Study Data 115
3.4.2 Simulation Results 115
4. Conclusion 121
Chapter 7 Conclusions and Further Work 124
1 Summary and Conclusions 124
2 Further Work 126
List of Publications
vi
List of Figures
Figure 1-1: Evolution of Electricity Industry Structure from Regulated to Deregulated 2
Figure 1-2: Summary of Power Systems Objectives 4
Figure 1-3: Least Cost Method 7
Figure 2-1: A few lists of Newly Industrializing Countries 15
Figure 2-2: World Map of Newly Industrializing Countries 16
Figure 2-3: Gross Domestic Product (GDP) Growth for Group I from 1990-2008 19 Figure 2-4: Comparison of GDP from Agriculture, Services and Industrial Contribution for Group
I 20
Figure 2-5: Population Growth for Group I from 1990 to 2005 21
Figure 2-6: Urbanization Growth for Group I 21
Figure 2-7: Electricity Consumption Growth for Group I 22
Figure 2-8: Electricity Production by Fuel for Group I in 2007 23 Figure 2-9: Gross Domestic Product (GDP) Growth for Group II from 1990-2008 24 Figure 2-10: Population Growth for Group II from 1990 to 2005 25 Figure 2-11: Electricity Consumption Growth for Group II from 1991-2007 26 Figure 2-12: Electricity Production by Fuel for Group II in 2007 27
Figure 2-13: Map of ASEAN Countries 29
Figure 2-14: Pre-reform Electricity Industry Structure 33
Figure 2-15: Electricity Consumption for ASEAN NICS compared to Japan for 2003-2007 34
Figure 2-16: Electricity Consumer Breakdown 36
Figure 2-17: ASEAN NICs Generation Mix 36
Figure 3-1: Malaysia’s Population Growth for 1993-2008 49
Figure 3-2: Number of Electricity Consumer Growth for 1993-2008 49
Figure 3-3: Malaysia’s GDP Growth for 1993-2008 50
Figure 3- 4: Malaysia’s Electricity Consumption Growth for 1993-2008 50 Figure 3-5: Error in Peak Demand Forecasting by Multiple Regression Analysis 51 Figure 3-6: Forecasted Maximum Demand for 2009 to 2020 Using Multiple Regression Analysis
52
Figure 3-7: ANN Configuration 52
Figure 3-8: Screenshot of JOONE program in training mode 53
Figure 3-9: Screenshot of JOONE program in forecast mode 53
Figure 3-10: Forecasted Maximum Demand for 2009 to 2020 Using Artificial Neural Networks 54
Figure 3-11: Input Data for Price Forecasting 55
Figure 3-12: Forecasted Price and Actual Price 56
Figure 4-1: Expression of state structure in the sparse dynamic programming 61 Figure 4-2: Occupied state space in each stage of general dynamic programming (with only one
constraint) 67
Figure 4-3 Stages by extended dynamic programming and occupation of state space (with only
one constraint). 69
Figure 4-4. Schematic drawing of inferiority criterion processing (when there is only one
constraint). 70
Figure 4-5. (y1, y2, z) State Space 71
Figure 4 6: State space of the final stage. 72
Figure 4-7. Annual LDC and stacked power supply outputs 75
Figure 4-8. Number of States by simulation case 80
Figure 4-9. CPU time by simulation case 80
Figure 4-10. CPU time for Number of States less than 100 81
vii
Figure 4-11. Stage transitions of number of states in simulation 81
Figure 5-1: Effect of varying K 89
Figure 5-2: Effect of varying K on number of solutions 89
Figure 5-3: Effect of varying number of units, n 90
Figure 5-4: Segmented Load Duration Curve 93
Figure 5-5: Convolution for Equivalent Energy Function Approach 94
Figure 5-6: Equivalent Load Duration Curve 95
Figure 5-7: Flowchart for Two Phase K-Best DP Algorithm 99
Figure 5-8: Reliability and Economic Cost 103
Figure 6-1: Map of Malaysia 107
Figure 6-2: GDP and electricity consumption 107
Figure 6-3: Malaysian Generation Mix by Fuel Type 108
Figure 6-4: Simplified Malaysian Generation Mix from 1971 to 2007 109
Figure 6-5: Flowchart for Solution Method 114
Figure 6-6: Economic Cost, Reliability and Socio-Environmental Cost 118
Figure 6-7: Economic Cost and Reliability 119
Figure 6-8: Economic Cost and Socio-Environmental Cost 119
Figure 6-9: Reliability and Socio-Environmental Cost 120
viii
List of Tables
Table 2-1: NICs Indicators 16
Table 2-2: Factors Affecting Energy Policies 18
Table 2-3: Comparison of NICs to Japan 28
Table 2-4: ASEAN NICs Electricity Characteristics 35
Table 2-5: Renewable Energy Targets 38
Table 3-1: Forecasting Ranges 45
Table 3-2: Factors affecting demand forecasting 46
Table 3-3: Correlation between Variables and Maximum Demand 51 Table 4-1. Data of two-dimensional knapsack problem having bounds 73 Table 4-2: Power supply composition and power source characteristics of problem mix 78 Table 4-3: Power supply composition and power source characteristics for simulation 78
Table 4-4: Summary of Results 79
Table 5-1: Input data for MC-GMP Simulation 99
Table 5-2: LDC for MC-GMP Simulation 100
Table 5-3: Results from Phase I of MC-GMP Simulation 101
Table 5-4: Results from Phase II of MC-GMP Simulation 102
Table 6-1: Socio-environmental Impact Costs for ej1 113
Table 6-2: Generation Type Characteristics 115
Table 6-3: Load Duration Curve 115
Table 6-4: Results from Phase I of Simulation 116
Table 6-5: Results from Phase II of Simulation 117
Table 6-6: Profile Rankings 121
1 | P a g e
Chapter 1
General Introduction
Electrical power supply industries worldwide are evolving from vertically integrated public service entities into competitive businesses. At the same time, environmental awareness has increased and economic costs are no longer the only customer requirement that power utilities have to contend with. Customers now demand for high quality, always-on electricity supply from clean, sustainable energy resources that will not pollute the environment. As a result, electrical power supply utilities now face the responsibility of finding a satisfactory balance between technical, economic, social and environmental issues. The aim of this doctoral study is to develop a methodology for constructing the optimal generation fuel mix that satisfactorily meets all four attributes. The methodology is then applied for evaluating capacity expansion planning for a Newly Industrializing Country.
1. Electrical Supply Industry
When the first power systems started emerging in the 1880s, the mere production and delivery of electrical energy would probably have been the only objective. Over a century later, the demand for electricity still continues to grow. This growth in demand for electricity spurs power systems growth, and as customers and their appliances become more sophisticated, they expect improved electricity quality as well. In order to satisfactorily serve this increasing demand, power systems production and delivery technologies had to improve as well. Utilities are now expected to provide high quality electricity, meaning electrical energy that is reliable, available at all times and at a constant frequency and voltage.
Electricity supply industries have also evolved through time. At first, the industry started as small businesses restricted to the locality that it serves. Then, as power systems become more networked, these small businesses tend to merge with or be absorbed into bigger businesses that control a larger network with more generating units.
2 | P a g e In the early 1900s, governments began to recognize that electrical energy is a key factor in national development. To better control and drive nation growth, these large electrical businesses were converted into government entities. In some countries, the introduction of electricity was late enough that its utilities began as government entities with full monopoly on the generation, transmission and distribution of electricity.
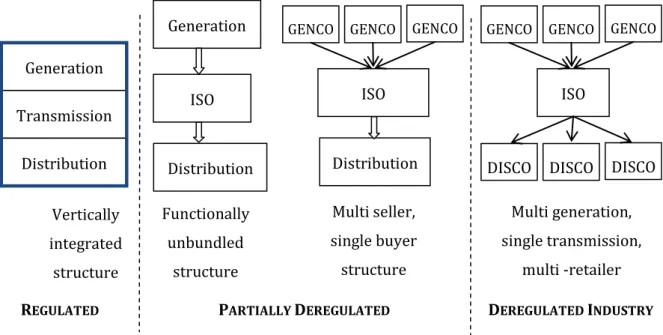
In the 1970s it was realized that the government entity model was no longer economically efficient, and the trend began to shift towards deregulation. The vertically integrated business structure is no longer suitable, and is gradually replaced by a new structure in which only the transmission of electricity is centrally operated.
Figure 1-1 shows the typical changes in electricity industry structure as the industry becomes fully deregulated. GENCO and DISCO are generation and distribution companies and ISO is the Independent System Operator.
Figure 1-1: Evolution of Electricity Industry Structure from Regulated to Deregulated In the first phase of deregulation, the vertically integrated entity is functionally unbundled and privatized. Functional unbundling is more practical since it is impossible to physically unbundle power systems assets. The transmission grid system is operated by the Independent System Operator (ISO). The ISO coordinates between the generation and distribution entities to maintain the demand-supply balance and ensure the safety and reliability of the whole power
Vertically integrated
structure
Functionally unbundled
structure
Multi seller, single buyer structure
Multi generation, single transmission,
multi -retailer structure Generation
Transmission Distribution
Generation
ISO
Distribution
GENCO 1
ISO
Distribution GENCO
2
GENCO 3
GENCO 1
ISO GENCO
2
GENCO 3
DISCO 1
DISCO 2
DISCO 3
REGULATED
INDUSTRY
PARTIALLY DEREGULATED
INDUSTRY
DEREGULATED INDUSTRY
3 | P a g e systems network. The next stage is usually the separation of the generation entity into smaller generation companies that would then compete to sell their electricity to the ISO.
In the fully deregulated electrical supply industry, competition has been introduced at the distribution level. The single distribution entity no longer exists but is replaced by several competing power retailers that purchase their electricity from the transmission entity and sells the electricity to the end-users. The selling and buying mechanisms differ depending on the market model implemented. Therefore, with deregulation, utilities must now have an economic objective added to its technical objective. Furthermore, as competitive businesses, utilities are now more obligated towards pleasing their customers. At the very least, customers will expect quality electricity at a cheap price.
Increasing environmental awareness is also another major issue that has to be dealt with by electricity industries worldwide. Along with the transportation industry, the electricity production industry has been identified as a main pollutant that affects land, water and air negatively. This realization has caused most utilities to add an environmental objective in their business operations and planning tasks. This is usually reflected in the control of pollutant emissions through responsible fuel management and emission filters. Another method is through efficient and sustainable energy practices that reduce energy wastage which in turn reduces the production of environmental pollutants.
In summary, electric power supply industries worldwide are evolving from vertically integrated public service entities into competitive businesses. At the same time, environmental awareness has increased. Cheaper tariffs are no longer the only customer requirement that utilities have to contend with. Customers now demand for high quality, always available electrical supply from clean, sustainable energy resources that will not pollute the environment. As a result, electrical power supply utilities now face the responsibility of finding a satisfactory balance between technical, economic, social and environmental objectives. These objectives were visually summarized as in Figure 1-2.
The technical, economic, social and environmental objectives are not only of different units, but are in conflict with one another. Hence, a power systems planning and operations problem subjected to these four objectives become a multi-objective problem where the aim is to find good trade-offs among the objectives.
4 | P a g e Figure 1-2: Summary of Power Systems Objectives
2. Power Systems Planning
The fundamental role of the electricity supply industry is to generate, transmit and deliver electrical power to consumers in their jurisdiction. Power systems planning is one the crucial tasks towards fulfilling that role, being a critical factor in ensuring power systems performance in the future.
Generally, power systems planning is conducted in tandem with a government entity, particularly with the economics planning and energy resources planning divisions, so that the decisions made are in accordance with the national energy policies. The rationale behind this cooperation is simple; electricity is no longer a luxury but a modern necessity without which the whole country could come to a standstill. Furthermore, although electricity related projects may cost the nation billions, electricity also provides jobs and drives economic development. Thus, national energy policies are the government’s method of guaranteeing that adequate supply of electricity is available at a reasonable price to support national socio-economic objectives.
In addition to national energy policy, power systems planning is also influenced by the future load demand, fuel supply accessibility, existing power system assets, latest technologies, and the availability of human and financial resources. Long-term power systems planning considers a time-frame of about ten to 35 years, and encompasses three parts [1-1].
i. Load forecasting
ii. Electrical generation planning iii. Electrical network planning
For this doctoral work, electrical network planning is omitted.
5 | P a g e Load Forecasting
Load forecasting predicts the future load demands on the power systems which form the basis for making planning, maintenance and operation decisions. If the operators had an estimation of the expected consumption for the next day, they are able to arrange beforehand a suitable number of power generating supplies to online and ready to generate electricity to meet the demand. Knowing the consumption estimation for the next month allows network planners to schedule appropriate days for maintenance without jeopardizing the system. For generation planners, prior knowledge of future consumption is required for fuel scheduling and capacity expansion planning.
Most load forecasting methods can be classified as either statistical techniques that depend on historical data or meta-heuristics techniques that depend on expert knowledge. Precise forecasting is impossible when results depend not only on the model used but also uncontrollable factors like weather conditions and policy changes. For this doctoral work, two different techniques are used to forecast long-term load for a Newly Industrializing Country.
Generation Expansion Planning
Where load forecasting predicts the future consumption requirement, generation expansion planning strategizes how the requirement will be met. The initial step is to determine if the existing power systems generation assets are sufficient for meeting the projected demand, and if not, then how much extra capacity will be required. Would refurbishment of existing generation units be enough or will new generation units need to be added to the system? What type of generating units should be added? Where and when should the generating units be built?
All these questions are part of the generation expansion planning problem. Other attributes also complicates the problem. For instance, a typical power system consists of various types of generating units with different characteristics and a lengthy planning period increases the dimensionality of the problem. Furthermore, the data used for planning, such as the load and fuel price projections data, are not actual data but estimates and this adds to the complexities of the problem.
Certain assumptions could be made to simplify the generation expansion planning problem [1- 1]. All electrical load and generation units can be assumed to operate from the same nodal point.
This way, the transmission costs are eliminated from the problem and similar generation unit
6 | P a g e types could be grouped together. Planning horizon is not divided into several decision stages, instead only one target date is set at the end of the planning horizon. Costs are averaged over the whole planning period rather than having a time-varying function. This simplified version of the generation expansion problem is the generation optimal mix problem which will be solved in this doctoral thesis and applied to a Newly Industrializing Country.
3. Newly Industrializing Countries
Newly Industrializing Countries (NICs) are developing countries that have not reached first- world status but have outpaced their developing counterparts. The nine core countries that have been commonly identified by researchers and economic analysts are Brazil, Mexico, South Africa, China, India, Malaysia, Philippines, Thailand and Turkey. Some lists also include Egypt, Indonesia, Jordan, Pakistan, and the Russian Federation [1-2].
The new group of NICs share various similarities; namely increased social freedoms and civil rights, strong political leaders, have switched from agricultural to industrial economies, allows free trade with other nations in the world and receives capital investment from foreign countries. Other features that will directly impact power systems planning and operations are rapid population and economic growth, less sophisticated power systems, societal constraints, restricted technical and financial resources [1-2] [1-3]. The rapid population and economic growth signals a corresponding growth in electricity demand which may not be adequately met by the current power systems installations. Restricted technical and financial resources may indicate difficulties in the making changes in the power systems.
NICs were initially chosen for this case study because these countries are still experiencing growth in demand and load capacity and will probably continue to do so in the coming years.
From the literature review conducted, it was found that Brazil, China and India are often grouped together with Russia as BRICs and identified as the large economies of the future. Due to the sheer rapidity of population growth and improvement of living standards of these four countries, their power systems development is closely monitored by researchers and analysts worldwide.
Therefore, this doctoral work will focus on the NICs in the South East Asian Region, specifically Malaysia, Thailand and Philippines. These three countries share similar characteristics in terms of meteorology and geography, social and political structures, industrial developments and economic activities thus further justifying this choice.
7 | P a g e 4. The Generation Optimal Mix Problem
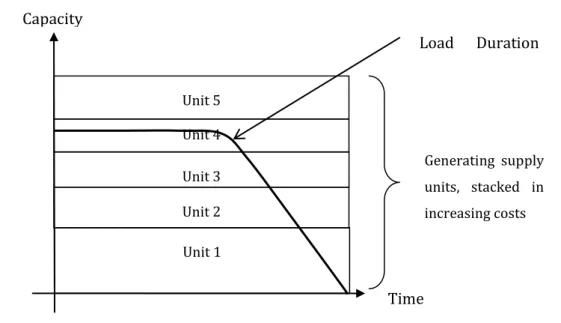
The generation optimal mix problem is a least cost problem where the objective is to decide on the optimal combination of generator supply units that meets electric power demand in a target fiscal year with minimum cost. The basic method to solving the GMP is the least cost method where the outputs of various power supply units are sequentially added from the cheapest to the most expensive, then the stacked power supply units are compared to the load duration curve (LDC) from a target year and LDC becomes the cut-off point for power supply selections.
Figure 1-3 is a graphical representation of this method.
Figure 1-3: Least Cost Method
From Figure 1-3, the vertical axis represents the system load capacity and the horizontal axis represents the duration time. With the LDC as the cut-off criteria, then Units 1, 2, 3 and 4 are selected, and Unit 5 eliminated from consideration.
There have been many mathematical models proposed for solving this generation optimal mix problem. Stoughton et al first introduced the method for directly constructing the optimal generation mix for thermal units by a forward recursive approach in 1980 [1-4]. Levin and Zahavi used a non-linear programming approach to generation optimal mix problem that considers limited-energy plants in papers [1-5] and [1-6] while Martins et al included wind power units in the mix [1-7]. Tanabe et al studies the conditions for determining a flexible generation mix under uncertainties by dynamic programming [1-8]. More recently, Habachi proposed a genetic algorithm solution to the generation optimal mix problem [1-9].
Unit 1 Unit 2 Unit 3 Unit 4 Unit 5
Generating supply units, stacked in increasing costs Capacity
Time
Load Duration Curve
8 | P a g e For this doctoral thesis, two new objectives are added to the problem, the reliability objective and the socio-environmental impact objective. The generation optimal mix problem is a large- scale combinatorial problem. Adding new criterions makes it vulnerable to computational explosion. Developing the solution method for this multi-objective generation optimal mix problem is the ultimate goal of this doctoral study.
5. Electricity Generation Technologies
The generation optimal mix problem means choosing between different types of generation technologies available the combination that best meets the stated objectives of the problem without violating the power demand constraints. With this in mind, this section introduces the existing generation technologies for better understanding on the generation technologies available for consideration.
Electrical energy is generated by conversion of energy from one form, such as kinetic energy, chemical energy and nuclear energy, into electrical energy. The conventional method of energy conversion is by using a prime mover, in which a prime-mover is used to drive electrical machines that convert mechanical energy into electrical energy. The non-conventional methods are those not involving a prime-mover, but use other means of energy conversion, such as an electro-chemical conversion in fuel cells, and solar radiation conversion where solar energy is converted directly into electrical energy by photovoltaic panels [1-10].
Conventional Condensing Power Plants
Conventional condensing power plants are usually fossil-fired, and have a typical efficiency of about 40 to 50 percent. Fuel like coal, natural gas or oil is burned, and the heat is used to boil water into super-heated steam that drives a steam turbine, which is interconnected with a generator on a common shaft [1-11]. The generator consists of a stator and rotor, and based on Faraday’s Law of Induction, electrical energy is generated in the stator when the rotor spins.
Coal-fired plants have a life expectancy of about 40 years, while gas-fired plants life expectancy is shorter at about 20 to 30 years [1-12]. The combustion process for the fossil-fired power plants generates excessive amounts of waste in the form of heat and ash and other gaseous particulates that can be somewhat mitigated at the plant design stage.
9 | P a g e Nuclear Power Plants
The concept of how nuclear power plants work is essentially similar to the conventional condensing power plants, but instead of burning fuel to create heat, heat energy is produced from the atomic fission process. Thus, the boiler in the conventional condensing power plants is replaced by a nuclear reactor. The nuclear fuel is in the form of fuel rods from enriched uranium. The overall efficiency of a nuclear power plant is also about 30 to 40 percent and the expected operating life is similar to coal-fired plants at 40 years.
Compared to the other forms of energy available, nuclear power with its security issues is by far the most controversial. As yet, there are no technology for safely dispose of spent nuclear rods.
There is a very real threat of radiation exposure from uranium mining and transportation, containment leakage and accidents. There is also the perceived threat of nuclear proliferation and terrorism. However, nuclear is still being used for power generation since it provides energy security for countries with limited natural resources, and the fact that nuclear energy is sustainable and carbon-free.
Hydro Power Plants
Hydro power plants generate electric energy by harnessing the kinetic energy of moving water in a waterfall to drive a hydraulic turbine that is interconnected to a synchronous generator.
The power extracted depends on both the waterfall’s height and rate of flow. It is the oldest form of renewable energy extraction and has a high efficiency rate of about 70 to 90 percent but with the longest construction time.
Solar Energy
There are two distinct ways of extracting energy from solar radiation. The first technique is by photovoltaic cells, where light is converted into electrical energy by the photoelectric effect. The second is by concentrating solar energy into a small beam that becomes the heat source for a conventional condensing power plant.
Due to the intermittent nature of solar energy, and the fact that it is only available during the day, complimentary technologies are introduced in conjunction with solar energy to make it more stable, such as heat storage systems. Both solar photovoltaic and concentrating solar thermal technologies are fairly new, and the costs are still high, but with depleting fuel sources and as the technologies mature, it is expected that solar energy will play a bigger role in electricity generation in the future.
10 | P a g e Wind Energy
When the wind blows, the wind turbine blades are rotated, and this produces electricity in the generator. Wind turbines can be either on-shore or off-shore, and can either operate individually, or as several units in a wind farm. Capacity factor for wind farms are about 20 to 30 percent, depending on the site’s wind conditions, even if the wind turbine as an efficiency of about 45 percent. Like solar energy, wind energy is also intermittent, but unlike solar thermal energy, it could not be saved, therefore, wind energy must be used whenever it is available and requires regulating back-up power capacity for when there it is not. Due to these limitations, wind energy is not recommended for large-scale power production [1-11].
Biomass and Biogas Energy
Energy from biomass can be converted into electricity by two processes. The first is by directly burning bio-waste to produce heat energy that can be converted into electrical energy by the condensing power plant. The second is by converting the bio-waste into a more convenient form such as liquid bio-fuel or combustible bio-gas and ethanol before burning. The conversion process can either be pyrolisis, gasification or anaerobic digestion, depending on the waste type.
Biomass energy production is linked to the forestry and agricultural industries since it relies on these industries to provide its feedstock. Biomass feed can come in the form of corn, sugar canes, pellets, wood chips, straws, black liquor, landfill methane, anaerobic digestors and vegetable oils [1-11]. The technical and economical characteristics of bio-plants differ depending on its source and site [1-13].
6. Research Outline
This thesis presents a methodology for solving the multi-objective generation optimal mix problem.
Problem Statement
From earlier discussions, it has been established that for single objective generation optimal mix problem, the aim is to generate the most cost-efficient combination of generation units required for a target year. With the advances in consumer applications and the increase in demands, utilities are mandated to provide electricity that is not only cheap, but also adequately reliable and environmentally-friendly. As a result, in the past two decades, the economic cost problem has evolved to become a multi-objective or multi-criteria problem that includes
11 | P a g e environmental, social and reliability targets too. The conflicting nature of these objectives requires decision-makers to make trade-offs that are rational and efficient.
Proposed solution
A two-phase K-best dynamic programming trade-off method has been developed specifically for solving the multi-objective generation optimal mix problem.
Brief Methodology
The doctoral study began with an initial review of the electricity supply industry, power systems planning and the Newly Industrializing Countries (NIC). This is followed by a thorough analysis of the Newly Industrializing Countries, accompanied by collection of relevant data that will later be used in comparison analysis and case studies. Based on the data collected, it was possible to forecast the load demand for a NIC for the next ten years.
At the same time, the solution framework for the generation optimal mix was gradually built. At first, only the single economic cost objective was considered, and the extended dynamic programming method was developed for solving the problem. The extended dynamic programming is an enhanced version of the dynamic programming method that alleviates the curse of dimensionality inherent in dynamic programming. Extended dynamic programming achieves this alleviation by adopting the sparsity and inferiority criterion theories to relax and mitigate combinatorial explosion.
Once the method was proven successful, the generation optimal mix problem was expanded to include the second objective; the reliability objective. A new method, the K-best dynamic programming was developed based on the extended dynamic programming method. Where extended dynamic programming provides a single optimal solution to the problem, K-best dynamic programming is capable of supplying a solution set. The solution set consist the best solution, the next best solution up to the K-th best solution.
To solve the two-criteria generation mix problem, a solution algorithm using the K-best dynamic programming method, the equivalent energy function method and the dominance analysis method was constructed. The solution algorithm was once again successfully tested for a small case study where the aim is to choose from a number of options the one that satisfactorily solves the problem and meets both the economic and reliability objectives.
12 | P a g e The solution algorithm was further improved when the third objective, the socio-environmental impact, was added to the generation optimal mix problem. When the third objective is added, dominance analysis is no longer sufficient for comparing the different options. Instead, dominance analysis is used as a screening criterion to eliminate the least efficient options. Then, goal programming method is used to choose the final option. This final solution algorithm is the two-phase K-best dynamic programming multi-criteria trade-off method.
Thesis Outline
This thesis consists of seven chapters. Chapter 1 gives the background of the research problem and outlines the thesis structure. Chapter 2 provides a review of the electricity energy scenario of Newly Industrializing Countries, and compares NIC characteristics to those of a developed country. Chapter 3 gives an overview of long term load forecasting methods as applied to the Malaysian electrical network. Chapter 4 is about the use of extended dynamic programming for the least cost generation optimal mix problem. Chapter 5 tackles the multi-criteria generation mix problem by using the K-best dynamic programming. Chapter 6 sees the application of K- best dynamic programming to an ASEAN Newly Industrializing Country for the assessment of new fuel technologies, including nuclear and solar. Chapter 7 presents the conclusions and possible further work.
13 | P a g e Chapter 1 References
[1-1] X. Wang and J.R. McDonald. Modern Power Systems Planning. McGraw-Hill. UK 1994.
[1-2] Benoliel, Daniel and Salama, Bruno Meyerhof. Patent Bargains in NICs: The Case of Brazil. Berkeley Program in Law & Economics. California, 2008. 052408-1.
[1-3] Dehdashti, Eddie S. Developing Countries-Restructuring with Benefits from Competition.
IEEE Power and Energy Magazine. 2004.
[1-4] N. M. Stoughton R. C. Chen S. T. Lee. Direct Construction of Optimal Generation Mix.
IEEE Transactions on Power Apparatus and Systems, Vol. PAS-99,No.2, pp 753-759, March/April 1980.
[1-5] N Levin and J Zahavi. Optimal Mix Algorithms with Existing Units. IEEE Transactions on Power Apparatus and Systems, Vol. PAS-103, No. 5, pp 954-962 May 1984.
[1-6] N Levin and J Zahavi. Optimal Mix Algorithms with Limited Energy Plants. IEEE Transactions on Power Apparatus and Systems, Vol. PAS-104, No. 5, pp 1131-1139 May 1985.
[1-7] B Martin and M Diesendorf. Optimal thermal mix in electricity grids containing wind power. Electric Power and Energy Systems, Vol 4 No 3 pp 155-161, July 1982.
[1-8] R. Tanabe, K. Yasuda, R. Yokoyama and H Sasaki. Flexible Generation Mix Under Multi Objectives and Uncertainties. IEEE Transactions on Power Systems, Vol. 8, No. 2, pp 581 - 587 May 1993
[1-9] A El-Habachi. Generation Mix Planning Using Genetic Algorithm. IEEE Power Engineering Society Vol 1 pp 513 -517 2002.
[1-10] J.B. Gupta. Generation and Economic Considerations. S.K. Kataria and Sons Publishing.
India 2005.
[1-11] Niko Jauhiainen. Assesment of Environmental Impacts of Power Generation. MSc Thesis.
Lappeenranta University of Technology. Czech Republic 2008.
[1-12] Projected Costs of Generating Electricity: 2005 Update by the Organisation for Economic Cooperation and Development (OECD).
[1-13] Renewables for Power Generation: Status and Prospects by the International Energy Agency (IEA)
14 | P a g e
Chapter 2
Newly Industrializing Countries Energy Policies
Energy is a vital component towards developing economic and social growth in a country. For a developing country, it is essential to have a comprehensive energy policy that provides a long-term, high quality and secure energy supply network. Climate change and fuel depletion leads to the formation of energy policies that are more environmentally friendly and varied to include the introduction of alternative forms of energy like renewable energy and nuclear energy. This chapter reviews the current energy scenarios for Newly Industrializing Countries, with a more detailed study of the countries situated in the South East Asian region.
1. Definition of Newly Industrializing Countries
The socio-economic concept of Newly Industrializing Countries (NIC) is used by geographers, economists and political experts to generally describe countries that have not reached first- world status but have outpaced their developing counterparts. Chowdury and Islam in [2-1]
provide a number of definitions from several resources.
The earliest is from the Organisation of Economic Co-operation and Development in 1979, in which NICs are recognized based on three growth measurements; industrial employment growth, manufacturing export growth and real capita Gross Domestic Product (GDP) growth.
Balassa defined a more specific quantitative measurement for the World Bank in 1980. NICs in this definition are developing countries with per capita income in excess of $1100 in 1978 and manufacturing sector exceeding 20% of its GDP share in 1977. Turner used only one criteria in his definition of NICs for the Royal Institute of International Affairs (RIIA) in 1982 which is the manufacturing share in the world trade. In 1993, Chowdury and Islam provided the following four criteria that should be fulfilled by countries in order to be recognized as a NIC.
1. A savings ratio equal to at least 15% of GDP 2. A real GDP per capita equal to at least US$1000
15 | P a g e 3. A share of manufacturing in GDP and employment equal to at least 20%
4. A Human Development Index (HDI) of at least 0.75
Besides these quantitative measurements, there are also several qualitative definitions of NICs.
One of the earliest definitions uses the Second World War as a threshold where and the economies from pre- and post-war is compared in terms of the manufacturing sector share in the economy. With this definition, Japan is the first recognized NIC since in its post-war era, Japan was able to transform into an industrialised economy. A more recent definition is by Bradford in 1982, where he recognized that NICs fills the intermediary stages in the international division of labour. Chowdury and Islam in 1993 defined NICs as latecomers to the manufacturing industry. The latest definition is by Bozyk in 2006, where he defined NICs as traditionally less developed countries which have made profound structural changes in their economies under conditions of fast growth rate [2-2].
In summary, there are several overlapping definitions for NICs and with the dynamic shifts of international economies, the countries defined as NICs changes from time to time. Figure 2-1 summarizes some of the lists of countries defined as NICs from [2-1].
Figure 2-1: A few lists of Newly Industrializing Countries
From the several available lists of NICs in 1980s, by the 1990s, the four outstanding NICs that appear in every list and are Hong Kong, Singapore, Taiwan and South Korea. These four countries are, also known as the four Asian tigers, have matured into New Industrialized Countries and are now at par with developed nations. Other countries are now being recognized as NICs. The nine core countries that have been identified are Brazil, Mexico, South Africa, China,
16 | P a g e India, Malaysia, Philippines, Thailand and Turkey. Some lists also include Egypt, Indonesia, Jordan, Pakistan, and Russia [2-3].
Figure 2-2: World Map of Newly Industrializing Countries [2-4]
The nine core countries are now analyzed by their indicators as listed by Chowdury and Islam and tabulated in Table 2-1. The electricity consumption growth was chosen as a fifth indicator.
TABLE 2-1:NICS INDICATORS
Country Developing
Country Middle
Income Savings (%GDP)
Real GDP per capita (USD)
Industry (%GDP)
Human Development
Index
Electricity Consumption
Growth Threshold >15% >USD1000 >20% >0.75 > 2.5 %
Brazil 17 8532 27 0.813 4.94%
China 52 3414 46 0.772 15.17%
India 34 1065 28 0.612 6.9%
Malaysia 37 8212 55 0.829 6.52%
Mexico 25 10,248 38 0.854 3.19%
Philippines 23 1844 33 0.751 4.16%
South
Africa 15 5666 31 0.683 2.97%
Thailand 29 4043 44 0.783 5.85%
Turkey 17 9881 28 0.806 8.51%
17 | P a g e The data are for the year 2008 and were mostly obtained from the World Bank database [2-5], except for the Human Development Index data which was published on the United Nations Development Program (UNDP) Website [2-6].
It can be easily seen that all the countries fulfill the economic and electricity growth indicators.
For the fourth indicator, India and South Africa has a lower HDI index than the threshold of 0.75 set by Chowdury and Islam. The HDI is a statistical rank of countries based on a composite index combining the purchasing power, life expectancy and literacy measurements [2-6]. The 0.75 threshold indicates a high quality of life and opportunity for social development. Since both India’s and South Africa’s HDI are still above average, both countries are still included in the list of NICs in this study.
2. Analysis of Newly Industrializing Countries
Energy policies are the deliberate plan of action for an entity to guide its decisions regarding the energy issues within its jurisdiction. This encompasses the production, distribution and consumption of energy in order to achieve a certain reasonable outcome. National electricity policies focus on electricity and it ensures electricity supplies are adequate and available at reasonable prices to support national socio-economic objectives.
Several key factors driving the energy policy includes energy demand and supply, energy security, energy economics, environmental issues, available technology and international agreements. A typical energy policy consists of a purpose statement, its applicability and scope as well as the policy statements. Depending on the type of energy policy, policy statements may include legislation and taxation, subsidies and incentives, international treaties or guidelines for environmental conservation.
This chapter studies the characteristics that affect the electricity policies in the Newly Industrializing Countries. For ease of comparison, for this section, the nine core countries recognized as Newly Industrializing Countries in the last section are divided into two groups.
Group I are countries located in Asia. This consists of India, China, Malaysia, Philippines and Thailand. Group II are the non-Asian countries, namely Brazil, Mexico, Turkey and South Africa.
Each group will be studied from three key factors, the economic factor, the demographic factor and the electricity factor.
18 | P a g e TABLE 2-2:FACTORS AFFECTING ENERGY POLICIES
Factors Description
Economic Factor The economic variables that will be studied are economic growth in the past, the factors driving economic growth in the future and the availability of foreign direct investment to finance development projects in the country.
Demographic Factor
Population growth is not the only indicator for energy growth in the future, it is also important to know the percentage of population in the 18-65 age bracket since this demographic consists the major electricity users.
Electricity Factor
This includes a short overview of each NIC’s electricity consumption growth, fuel mix, fuel availability and the electricity supply industry structure.
At the end of this section, each country will be analyzed with respect to a developed country.
Please note that, unless otherwise stated, all data were obtained from the WorldBank database, which is available online at the WorldBank website [2-5].
2.1 Group I: Asian Newly Industrializing Countries
The Asian region is the largest region in the world made up of 48 countries. It is also the most populous, currently housing about 60 percent of the world human population. Due to its vast size, there exists in Asia a wide range of different economic, cultural, political and environmental situations. Each country’s situation is influenced by its own historical and geographical backgrounds. For instance, the People’s Republic of China is a communist country;
Thailand has a monarchy system with parliamentary democracy while India also has a parliamentary democracy but no monarchy. This diverseness in even the most basic of characteristics makes a thorough analysis of all 48 countries in the Asian region difficult.
Therefore, five countries have been pre-selected for this analysis and all five are the countries established earlier as a Newly Industrializing Country.
2.1.1 Economic Factor for Group I
As a rule, the Gross Domestic Product (GDP) is used as an indicator for a country’s economic condition. GDP represents the total dollar value of all goods and services produced in the
19 | P a g e country over a specific period of time. It is calculated from the domestic consumption, domestic investment, government expenditure, exports and imports. A high GDP indicates a healthy economic condition with low unemployment and wage increase [2-7]. Figure 2-3 shows the annual GDP growth for the countries under review from 1990-2008.
Figure 2-3: Gross Domestic Product (GDP) Growth for Group I from 1990-2008
As can be seen in Figure 2-3, since 1990, all five have enjoyed high annual economic growth.
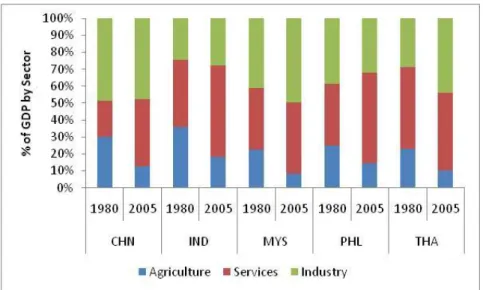
There are some exceptions, for instance in 1997, Malaysia, Philippines and Thailand, were hit by the 1997 Asian Financial Crisis while in 2001, India’s economy was affected by the Enron financial scandal. However, these countries were able to remedy their situations pretty quickly, and in the past five years, all five countries have shown consistent economic growth each year, for China and India at about ten percent each year and for the other three at about five percent Analyzing the types of economies for these countries, it was found that all five have successfully shifted away from an agricultural based economy. For example, in 1980, India’s agricultural sector contributed 36 percent of the GDP but in 2008, the figure is reduced to only 17 percent.
The trend is repeated in the other four countries. China, Malaysia and Thailand now relies more on industrial sector, while for India and Philippines, more than half of the economy comes from the services sector. This development is an important criteria for the energy policy making since both industrial and services sectors are more electricity intensive than agricultural sector,
20 | P a g e thus capacity allocations must be made by decision makers if the trend towards industry and services is expected to continue.
Figure 2-4: Comparison of GDP from Agriculture, Services and Industrial Contribution for Group I Another important economic aspect that should be taken into account is the availability of private funds for capacity expansion projects. Developing countries are anticipated to need USD 5 trillion of investment to meet demand for electricity by 2030, with more than USD 2 trillion for new generation capacity alone [2-8]. Most developing countries are financially unable to provide the high capital required for these projects, hence investment from other private entities, usually foreign, are generally welcomed.
Foreign direct investment is any investment by foreign businesses in local enterprises that earns interest for the foreign business. The foreign business entity must hold more than 10 percent of the shares in order to be considered as a foreign direct investment. This may be in the form of share-holding, joint ventures, ownership or mergers.
Foreign direct investment injects much needed capital to drive a developing country’s economic growth but the advantages of foreign investment are not limited to financial benefits. Foreign direct investment through technology transfer is able to directly improve local expertise and introduce more advanced technological resources.
Indirectly, it has been observed that countries with foreign direct investment are able to utilize the profits for infrastructure improvement and at the same time improve the health and education sectors as well [2-9]. The five countries being studied all receives foreign direct investment.
21 | P a g e 2.1.2 Demographic Factor for Group I
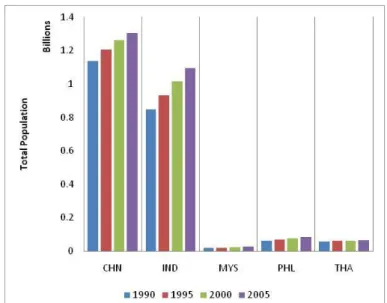
The next factor under study is the demographic factor. Figure 2-5 shows the population growth for all five countries, in the five year intervals from 1990 to 2005. By the year 2000, both India and China’s population have exceeded the 1 billion people mark, and based on this trend, the population in all five countries are expected to grow for the next decade.
Figure 2-5: Population Growth for Group I from 1990 to 2005
Furthermore, as economies shift away from agricultural-based, the populations tend to move out of rural areas into urban areas. This resulted in the steady increase of urbanized population in all five countries as illustrated in Figure 2-6.
Figure 2-6: Urbanization Growth for Group I
22 | P a g e It has also been noted that in each of the five countries, more than 60 percent of the population is in the 15-64 age bracket, with China having the highest percentage at 71.53 percent . This, along with the rising life expectancy and more sophisticated use of electrical and electronic consumer goods in Asia, indicates that the residential and commercial electricity needs in these countries will continue to grow for the foreseeable future.
2.1.3 Electricity Factor for Group I
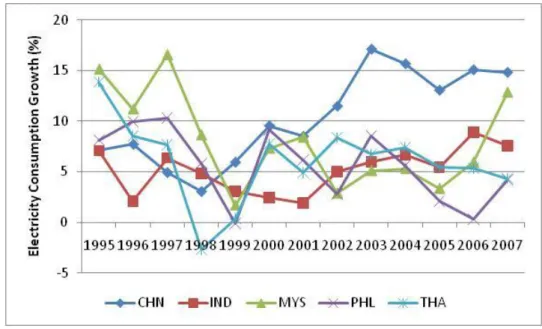
Next, the electricity factor is analyzed. The electricity power consumption growth from 1995 to 2007 is shown in Figure 2-7. Since the year 2002, electricity consumption growth has been pretty stable for four of the countries analysed. China’s consumption growth has been very high at about 15 percent each year, while for India, Malaysia and Philippines, consumption growth was moderately high at about five percent average. For Philippines, however, the growth has been pretty erratic.
Figure 2-7: Electricity Consumption Growth for Group I
Comparing to Figure 2-3, it can be seen that electric power consumption for these five countries experienced dips at about the same time as the dips in economic growth. It can be safely assumed that these two factors correlates and economic crises will affect consumption adversely.
The next figure shows the electricity production for each country for the year 2007 by type of fuel for electricity generation. The number under the country labels shows the amount of
23 | P a g e electricity generated for that year. It can be easily seen that the fuel mix for these countries are dependent on one type of fuel, either coal or gas. Only India and China has nuclear generation.
Figure 2-8: Electricity Production by Fuel for Group I in 2007
Since mid-1990s, all five countries have begun electricity market reforms. However, all five have more or less halted the reform process at the generation level while the transmission and distribution levels are still under regulation. According to [2-8], the task of full reformation has been found to be too politically and institutionally difficult to implement.
Competition at the generation level was introduced in the form of Independent Power Producers (IPP); which are privately-owned generation that sells its generated electricity to the publicly-owned grid either through long-term contracts or through a power pool market. By 2005, Philippines has the most IPPs at 45, followed by China with 32 IPPs while India, Malaysia and Thailand has sixteen, thirteen and seven IPPs each.
2.2 Group II: Non-Asian Newly Industrializing Countries
The four non-Asian NIC in this study is Mexico, Brazil, Turkey and South Africa. Mexico and Brazil are both situated on the American continent; South Africa is on the African continent, while Turkey sits in between Europe and Asia. All four countries are republics, although Mexico and Brazil are federal republics and Turkey is a parliamentary republic.
24 | P a g e 2.2.1 Economic Factor for Group II
The economic growth in the four countries is shown in Figure 2-9. Once again, the GDP is used as the economic indicator.
Figure 2-9: Gross Domestic Product (GDP) Growth for Group II from 1990-2008
In the 1990 to 2000 period, all four countries were having unstable economy, reflected in the erratic economic growth during that time. In 2001, the financial crisis known as the “Dot-com bubble burst” caused stock markets in industrialized nations to crash, with negative repercussions to developing countries.
Turkey was the worst hit of the four countries under analysis. From 2002 onwards, Turkey has shown much better economic growth, leaping to about nine percent GDP growth in 2004 while the other three countries continue to experience stable economic growth at about four percent yearly.
Unlike the Asian countries that are going towards industry-based economy, these four countries are much more reliant on services sector. In fact, for Brazil, Mexico and South Africa, the services sector contributes more than 60 percent of the GDP whereas for Turkey, the contribution is at 45.8 percent. All four countries also receive foreign direct investment. In 2008, foreign direct investment for each country is at about 2-3 percent of their GDP.
25 | P a g e 2.2.2 Demographic Factor for Group II
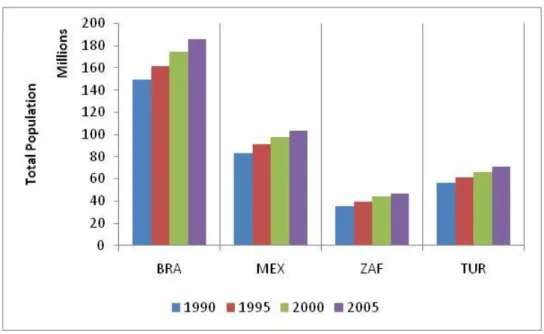
Figure 2-10 shows the population growth for Group II from the year 1990 to 2005 in five year intervals. Like its Asian counterparts, the trend for population growth has shown to be increasing in the past fifteen years and is expected to increase further in the future.
Figure 2-10: Population Growth for Group II from 1990 to 2005
It was also found that the percentage of population in the 15 to 64 age bracket is also high for all four countries at about 65 percent of the total population. Urbanization ratio is also high, about 85 percent of Brazilians, 77 percent of Mexicans, 61 percent of South Africans and 69 percent of Turks live in urbanized areas. Both these indicators suggest that more electricity will be consumed in the residential and commercial sectors in the following years.
2.2.3 Electricity Factors for Group II
The first electricity factor measurement to be analyzed is the electrical power consumption growth, and the historical record is graphically shown in Figure 2-11.
Once again, the electricity consumption decrease points correlate with the economic growth graph, with clear dips for all countries in 2001. From 2002 onwards, growth has been pretty stable, averaging at about 3 percent for South Africa, 5 percent for Mexico and Brazil, and at 8 percent for Turkey. It should be noted however, that the electricity production in these four countries are somewhat problematic.
26 | P a g e Figure 2-11: Electricity Consumption Growth for Group II from 1991-2007
In South Africa, the power consumption has actually outstripped the available power production capacity a few times, resulting rolling blackouts in 2007. Rolling blackouts are a last- resort action by the grid operators to maintain grid stability by shedding low priority loads when demand exceeds capacity.
In Brazil, droughts caused severe depletion in Brazil’s hydro-reservoirs in 2001. Blackouts were avoided by severe power rationing. Clearly, expansion projects are urgently required to meet this deficiency.
The next indicator is the fuel mix for these countries which is shown in Figure 2-12. It is apparent that the four countries in Group II have an imbalanced fuel mix, and are each heavily reliant on one single type of fuel.
In Brazil, the pre-dominant generation technology is hydro, for Mexico and Turkey, the main fuel is natural gas and for South Africa, over 90 percent of the electricity comes from coal technology. Although this situation is not ideal, the risk is somewhat mitigated by the fact that the main-fuel are mostly from indigenous sources. Thus, vulnerabilities to price or political manipulation from outside influences are less likely. However, other risks, such as depleting resources and environmental impacts could still be a problem.
27 | P a g e Figure 2-12: Electricity Production by Fuel for Group II in 2007
The final indicator for electricity factor is the electricity industry deregulation. The Brazilian power system is the only country where the electricity industry is fully reformed. South Africa, Turkey and Mexico are only deregulated at generation level, following the generic multiple seller, one buyer model.
2.3 Comparison of NICs to a Japan
The attributes of the Newly Industrializing Countries are compared to those of a developed country, Japan. The attribute chosen to represent economic factor is average GDP growth for the past five years. For demographic factor, the chosen attribute is average population growth for the past five years. For electricity factor, two attributes are chosen, average electricity consumption growth and electricity reforms.
From Table 2-3, it is evident that while the economic, population and consumption growth for NICs is high, for a developed country like Japan, growth is much slower, and declining for certain attributes, particularly population growth.
All the countries studied have undergone electricity reforms to some extent, but only Brazil, Philippines and Japan has an actual market open for electricity selling. Brazil’s market is the
28 | P a g e Electric Energy Commercialization Chamber, Philippines has its Wholesale Electricity Spot Market (WESM) and Japan’s market is the Japan Electric Power Exchange (JEPX).
TABLE 2-3:COMPARISON OF NICS TO JAPAN
Economic
Factor Demographic
Factor Electricity
Factor Electricity Reform Factor
Brazil 4.72% 1.12% 4.94% All sectors since 1995
China 10.82% 0.56% 15.17% Generation 1985
India 8.49% 1.37% 6.9% Generation 1991
Malaysia 5.78% 1.78% 6.52% Generation 1993
Mexico 3.40% 1.03% 3.19% Generation 1994
Philippines 5.52% 1.86% 4.16% Generation 1988
All sectors 2001 South
Africa
4.66% 1.22% 2.97% Generation 1998
Thailand 4.70% 0.87% 5.85% Generation 1994
Turkey 6.04% 1.28% 8.51% Generation 1984
JAPAN 1.58% -0.0022% 1.45% Generation 1995
2.4 Summary of Newly Industrializing Countries
From the analysis, it can be summarized that the new group of NICs shares various similarities.
Compared to other developing countries, their citizens have increased social freedoms and civil rights. Economically, these countries have switched from mostly agricultural- based to industrial-based economies. Free trade with other nations in the world is encouraged and all nine receives capital investment from foreign countries.
In terms of energy polices, these countries are experiencing rapid population and economic growth and this causes a parallel growth in energy consumption. However, the existing energy facilities are less sophisticated compared to those available in a first-world country, and with restricted technical, human and financial resources, energy providers in NICs tend to be more conservative in implementing new policies [2-3] [2-10].
![Figure 2-2: World Map of Newly Industrializing Countries [2-4]](https://thumb-ap.123doks.com/thumbv2/123deta/9785289.1868603/25.892.121.830.185.495/figure-world-map-newly-industrializing-countries.webp)