The Emergence of the New Urban Middle Class in
the Philippines and Its Social Character :
Focusing on the New Upper Middle Class
著者名(英)
Masatoshi IKEDA
journal or
publication title
The Bulletin of Faculty of Sociology,Toyo
University
volume
38
number
2
page range
53-116
year
2001-02
URL
http://id.nii.ac.jp/1060/00002247/
Creative Commons : 表示 - 非営利 - 改変禁止
The Emergence of the New Urban Middle Class in the Philippines and lts Social Character/IKEDA Masatoshi
The Emergence of the New Urban Middle Class
in the Philippines and Its Social Character:
Focusing on the New Upper Middle Class
IKEDA Masatoshi
lntroduction
This paper aims to analyze the emerging process of the new urban middle class in the Philippines and to clarify its social character fbcusing on the new urban middle claSS. In 1986 the downfa11 of the Marcos dictatorship was brought about by the People Power Revolution. It was also said to be a white collar revolution. After the revolution,rapid economic progress has taken place under the Aquino and Ramos
administrations.in the Philippines(once dubbed“a sickman in Asia”). Through this high economic growth period, there appeared a mass number of white-collar workers. From these white collar workers emerged the new middle class-the class which is foreseen to play important social roles in the Philippines in the near future. However, little research has been conducted on the middle class. Socio-physical environment and the social consciousness its members are developing are not known. Thus, this paper attempts to analyze the emerging process of the new urban middle class and clarify i七s social character fbcusing on the upper new middle class. The reason why this class is fbcused on is first, this class will give us clues to understand the nature of the coming new mass consumer society, and secolld, this class will be a comparable social stratum to the Asian“new rich”who eam more than$2,500monthly.
Abstract
Since the latter part of the 1980s,due to the progress of knowledge intensive and service oriented industrial structure, coupled with the progress of high educational attainment among people, a mass of formerly unknown people, called the new middle class has come into existence in the Philippines. This new group of people are composed of those in the managerial stratum that are derived from the professional! thechnical workers themselves which have in turn come from the clerical workers. ’lhere are two rising up patterns among the Philippine new middle class. One is byclimbing up the ladder to manageria1/administrative positions in formal
organizations and the other is by being an independent business operator. In terms of social mobility, the Philippine society has been a highly mobile society. But, a social banier that has hindered the mobility of the people lies not between the lower class and the middle class, but between the middle class and the upper class. Noteworthy, however, is the recent trend of the society of becoming a closed society. Still the high mobility of the people can’t be denied.Demographically, relatively young people and women workers are found in
managerial occupation. Sociologically, this seems to imply that the emergence of the middle class is connnected with the progress of meritocracy in the Philippines. In their family life, women take part in important decision making processes on an equal footing with men. Their high status in the family is shown by the fact that about 30%of women are household head. Among the socioeconomic factors which best describe the middle class people is their high-income level;but, more important than income level is life style. The place where their house is located the type of car they own, the amount ofmoney they spend on education are important media in determining their social
statUS. In most cases,their houses are located in exclusive subdivisions. And their children attend expensive private schools starting from the elementary level. As to education, the middle class people are highly educated children of highly educated parents. For example, more than 20%of them were enrollees in graduateschools. In addition to this, more than 15%of them let their children study
extracurricular lessons from private teachers or attend private institutes fbr the purpose of upgrading marks in the school.The Emergence of the New Urban Middle Class in the Philippines and lbs Social Character/IKEDA Masatoshi They also enjoy playing golf at their golf club during the weekends. As to social consciousness, more than 7090 of them think they belong to the middle-middle class. As to the social mobility on the level of consciousness, they think they belong to a higher stratum now than that they identified with during their high schoo1 days. This happy memory of their past inter generational mobility will make them insiders of the present social system. Accordingly, the increase of the middle class in number will be conducive to the stability of the present social system. It is not class consciousness but stratum consciousness that has direct relevance to the way of viewing society. The upper class and the lower class are more inclined than the middle class to see the society from an antagonistic point of view.The middle class also stands in the middle between them on the leve1 of consciousness.
Analytical Frame of Social Character
Social character is defined as the social entity of a group of a people. These are composed of the life style, the life structure and the social consciousness that are commonly f()und among them. To determine the social character of the new middle class of the Philippines,41evels of social factors are formed. As shown in figure 1, these 41evels are:first, the demographic level, exemplified by factors like sex,age andethnicity;second, the socioeconomic level factors like occupation,educational
attainment and income;third,the life style level;fourth, the social consciousness level composed of stratum consciousness,class consciousness and awareness of social issues. These fbur levels of social factors are believed to have mutually-defined relationshipsamong themselves.
Figure l Analytical Frame of Social CharacterIV
Stratum Consciousness,Class Consciousness an awareness of social issues Social Consciousness Level III II 1 Lifb Style Li飴Style I・evel Occupation,Educational Attainment, Income Socio Economic Leve1 Sex, Age, EthnicityDemographic Level
1.The Change in Socio-Economic Structure
Back ground of The Emergence of The Urban New Middle Class
The emergellce of middle class is closely related with the economic growth that happened between 1985 and 1998. The real gross domestic product of the Philippines grew from 420.8 billion pesos to 707.9 billion pesos. The growth rate is 4.07%per year.This indicates good economic performance under the Aquino-Ramos administrations.
Table l shows the change in the industrial structure in 8 years between 1986 and 1993 in terms of the皿mber of persons employed. Tab|e l The Change of the lindustrial Structure in(%)1986
1996
Agriculture, fishery and forestry Mining and quarryingManufacturing
Elect亘cuty,gas and waterConstruction
Wholesale and retail tradeTransportation,storage&communication
Financing,insurance,real estate,and business services Community,soeial and personal services not adequately defined or reported97231719ー
サ コ コ の リ コ ロ ロ909033417
4 1 1 41.7 0.4 10.0 0.4 5.7 14.8 6.0 2.5 18.3 0.02 Tota1 100.0 99.82 source:for 19861992 Philippine Yesr book p711 NSO 1992 for 19961999Philippine Statistical Year book pl1-10 National Statistical Coordination Board Manila 1999 Du亘ng this pe亘od, while the share of employed persons of Ag亘culture, fishery and fbrestry has decresed丘om 49.9%to 41.7%, the share of employed persons of tertia]ry industry sector has increased仕om 40.1%to 47.9%. The manuf巨cturing sector has also increased the share as well. What is noteworthy in this sector is that the technology revolution has taken place. This is shown in the change in the composition of export items. Table 2 indicates how the share of export items has changed from 1988to 1998. Table 2 Main Export ltems(1988’1998)in$million 1988(%) 1998(%) Agricultural,f()restry,and mineral productsGarments
Electronic/electrical productsOthers
1,484.7(21.0) 1,343.3(19.0) 1,484.7(21.0) 2,757.3(39.0) 2,360.8( 8.0) 2,360.8( 8.0) 17,115.8(58.0) 7,672.6(26.0) 7,070 (100.0) 29,510 (100.0) source:Far Eastern Economic Review July 15 1999The Emergence of the New Urban Middle Class in the Philippines and lbS Social Character/IKEDA Masatoshi According to this table,while electronics!electrical products accounted for only 21% of total export in 1988, but it grew up to 58%in 1998 making it the leading export industry. As shown in this table, Philippines is quietly and quickly going hi-tech.“A quite revolution is under way in the Philippines,where a fast growing and increasingly sophisticated technology industry is competeing with more established regional rivals for investment dollars.”1) “Arnerica Online, Andersen Consulting firms are shifting their offices to Asia. The winners in this quest fbr skilled but inexpensive English-speaking staff are likely to be two countries:India and the Philippines.”2)These countries will be white collar gold mines in the age of information societysociety”. Table 3 indicates the change in the occupational structure between 1992 and 1998. Table 3 The Change of the Occupational Structure in thousand(%)
1992
1998
Agricultural,&fbrestry workers丘shermen Administrative,managerial workers Professional technica1&related workers Clerical workers Sales workers Service Workers Production and related workers Transport Equioment OperatorOthers
10,200(37.7) 281( 1.0) 1,354( 5.0) 933( 3.5) 3,094(11.5) 2,113( 7.8) 5,038(18.7) 3,976(14.7) 20(0.1) 11,163(33.3) 570( 1.7) 1,697( 5.1) 1,271( 3.8) 4,152(12.4) 3,005( 9.0) 6β66(18.9) 5,231(15.6) 26(0.1) Total 27,009(100.0) 33,481(100.0) source:1999Philippine Statistical Year Book p 11-16 National statistical Coordination Board Manila 1999 The service workers in the table consist of medical doctors, social workers, nurses, hygenists the officials of barangay,the lowest local government units which amounts to about 40,000 across the country. According to this table,the share of the white collar workers rose from 28.8%in 1992 to 32%in 1998. Indications are that the white collar workers composed of adfriinistrative,managerial workers, professional/technical and related workers, clerical/sales workers and service workers are the mainstay of the urban new middle class.ll. Outline of Research snd Some Characteristics of Respondents
ll-1 Research Outline This research was conducted at Don Bosco lnstitute located in Makati, the largest financia1 center in the Philippines. Don Bosco lnstitute Makati is well known as a school where most students are from the upPer middle class family. Questionaires were distributed to the parents of the first grade up to the parents of the sixth gradepupils through class room teachers. From the 500 questionaires originally
distributed,455 questionaires were retrieved. ll-2 Some Characteritics of the Respondents 1.Demographic traits Table 4 Age distribution by Sex in%(n) 一2930-39
40-49
50-59
60一 Tota1Male
Female
1.3(4)5.9(9) 41.1(122) 56.6( 86) 48.8(145) 36.8( 56) 8.1(24) 0.7(1) 0.7(2) 0.0(0) 100.0(297) 100.0(152) Total 2.9(13) 46.3(208) 44.8(201) 5.6(25) 0.4(2) 100.0(449) As shown in table 4,2970ut of 449 respondents are male. In short, the ratio of male to female is 2:1. As to the age distribution,the median age fbr both sexes is 40,to be specific,40.2 for men and 40.8 for women. The reason why the respondents are relatively young is that they are parents of elementary school pupils. The fact that the age distribution of the urban middle class is young is an important factor for the examination of the questions regarding the lifestyle and the emerging process of the middle class. The household head seems to be a determining factor of the lifb style of a family. Such being the case,the attributes of household head must be analyzed first. Table 5 shows sexial distribution of the household head. 2.Respondents’status in the household Table 5 Household Head by sex in%(n)Head
Non-head Tota1Male
Female
98.7(293)86.9(133) 1.3(4) 13.1(20) 100.0(297) 100.0(153) Tota1 94,7(426) 5.3(24) 100.0(450)Z2=228.9832 v=0.7133 p<0.0050
The Emergence of the New Urban Middle Class in the Philippines and lbS Social Character/IKEDA Masa畝)shi From table594.7%are household-heads and this proves that the research was conducted according to the original plan.1330ut of the 426 household heads,(31.2%) are women, a ratio which seems to be very high compared to that of Japan. This ratio symbolizes the high status of women in the Philippine middle class families. Table 6 Ethnic Characteritics in%(n) total Chinese ancestor on the side of household head Chinese ancestor on the spouse’s side Chinese ancestor on both side No Chinese ancestor on either side 36.8(91) 20.6(51) 7.7(19) 34.9(86) Total 100.0(247) There are three minority groups in the Philippines,that is, Chinese, Muslims and indigenous people. Table 6 shows the percentage of the ethnic Chinese among the Philippine middle class. Accrding to this table(this excludes 205 people who didn’t answer to any choices),1610ut of 247 people have Chinese ancestor. To sum up,two out of three Philippine middle class families are etnic Chinese. Then, is being ethnic Chinese advantageous in determining his/her social status?Table 7 shows the difference of the income level by ethnicity. Table 7 1ncome distribution by ethnic groups in%(n)
Low
Middle
High
Highest
TotalChinese
Non Chinese 22.5(36) 29.1(25) 23.2(37) 34.9(30) 24.6(40) 20.9(18) 29.7(48) 15.1(13) 100.0(161) 100.0( 86) Total 28.0(69) 26.8(66) 22.2(55) 23.0(57) 100.0(247) Z2=11.2043 v=0.213 p<0.025 1ncome groups are categorized by the fbllowing criteria Low :less than 25,000 pesos a month Middle:25,000-45,000 pesos High :45,000-75,000 pesos Highest:more than 75,000 pesos and so on The median of all the incomes is 41,000 pesos per month. Taking into account of the fact that this is based on the personal income,it can be refbrred that this middle class family surveyed belong to the upper middle class family. While the median income of the ethnic non-Chinese is 26,200 pesos a month, that of ethnic Chinese is48,400pesos a month. This indicates that as far as income is concerned, being an ethnic Chinese is somewhat advantageous to his!her economic well being. Then,behind this relationship is there any fact to the effect that the ethnic Chinese are better educated than the ethnic non Chinese? Table 8 Educational attainment by ethnic groups in%(n)
Hg
Ug
Gwnc
Gd
Total Ethnic ChineseNon Chinese
5.0(8) 5.8(5) 68。4(111) 65.1( 56) 10.8(17) 14.0(12) 15.8(25) 15.1(13) 100.0(161) 100.0( 86) Total 5.3(13) 67.6(167) 11.7(29) 15.4(38) 100.0(247) X2=0.6248 v=0.0503 n.s. Abbreviations in the above table mean fbllowing educational attainment Hg:High school graduates Ug:University graduates Gwnc:Graduate work(not completed) Gd:Graduate work with degree(Master’s Doctor,s)and so on According to Table 8 there is no significant difference in educational attainment of the two et㎞ic groups. On the contrary, the percentage of the people who attended 9・adu・t・・sch・・1 in・n・w・y・r an・ther i・1・wer am・ng・thni・Chin・・th・n th・t・f ethnic non-chinese. Yet the fact that they are better off than the ethnic non-Chinesestill remains. This suggests that the ethnic Chinese may have good social
connnections that are conducive to their economic well-being.lll. Socio-Economic Characteristics
111・・10ccupational Characteritics of New Middle Classes Occupation is an important too1 which give decisive clues to sociological analysis of social stratification. The characteristics of occupational strata is to be examined in the following. 1.Gender and Occupation. It is said that socio-economic chances are comparatively equally distributed between men and women in the Philippines. How is the case with the new middle class people?Table 9 indicates occupational distribution by sex.T[he Emergence of the New Urban Middle Class in the Philippines and lts Social Character/IKEDA Masatoshi
Table 9 0ccupational distribution by sex in%(n)
Men
Women
TotalManagerial
Business
Professional/technical Clerica1/sales Blue collar 28.6(83) 19.2(56) 22.0(64) 11.0(32) 192(56) 23.6(33) 17.1(24) 7.9(11) 37.8(53) 13.6(19) 26.9(116) 18.6( 80) 17.4( 75) 19.7( 85) 17.4( 75) Total 67.5(291) 32.5(140) 100.0(431) γ2=49.057 v=0.3373 p<0.0050 According to table 9, men are more illclined than women to take professional/ technical occupation. While 7.9%of women take this occupation,22.0%of men are engaged on it. On the other hand, women have a greater tendency than men to takeClerical!sales related works. Women cover 37.8%while men occupy 11%only.
Generally speaking,men tend to take luclative jobs than women do. Noteworthy,however, is the fact that 23.6%of women take managerial occupation. Women in the Philippines seem to be doing better in the labor market than their counterparts in Japan.2.Age and Occupation
In table 10, it appears that age has a strong influence on the kind ofjob one takes. Table 10 0ccupational distribution by age groups in%(n)under 40 above 40 Total
Managerial
Business
Professional/technical Clerical/sales works Blue collar 28.4(61) 16.7(36) 13.0(26) 242(52) 17.7(38) 25.5(57) 19.6(44) 21.4(48) 15.2(34) 18.3(41) 26.9(118) 18.2( 80) 17.3( 76) 19.6( 86) 18.0( 79) Total 100.0(215) 100.0(224) 100.0(439) γ2=7.67057 v=0.1322 n.S. Respondents are divided into two groups by median age(40). While people under 40 have relatively strong propensity to take clerical/sales related works, people above 40 have a relatively strong inclination to take professional!technical works. Though its difference as X 2 indicates, is not statistically significant. Noteworthy,however is the fact that 28.4%of people under 40 take managerialoccupation. This indicates that meritocracy is under way in the Philippines.
Sociologically, speaking, it can be said that the emergence of the urban new middleclass is closely related to the progress of meritocracy in the Philippines.
3.Employment Status and Occupation
Being employed or not affects the consciousness of individual people. For one’s employment status reflects the difference of the class interest between capitalists and the working class. Table l l indicates strong influence of the employment status on occupation. Table l l Occupation by Employment Status in%(n)Employee
Employer
TotalManagerial 93.2(110)
Business 7.5( 6) Professional 1 technical 56.8( 42) Clerical/Sales related 89.3( 75) Blue Collar 69.7( 53) 6.8(8) 92.5(74) 43.2(32) 10.7(9) 30.3(23) 100.0(118) 100.0( 80) 100.0( 74) 100.0( 84) 100。0( 76) Total 66.2(286) 33.8(46) 100.0(432) γ2=186.7319 v=O.65754 p<O.0050 As expected,the percentage of being an employee is high among manageria1 workers and clerical and sales related workers. Most of managerial workers are people who work f()r the middle management, thus, they are still considered as employees. On the other hand 43.290 of professional/technical workers are employers. This is because some of them are medical or law practitioners.7.5%of business operatorsconsider themselves as employees,because they are operating agencies like travel
agency and insurance agency. Such being the case, it will be hard to classify them into the old middle class or the new middle class only by looking at their employment status. However, as revealed by Cramer’s contingency coef且cient, strong relationship is observed between occupationand employment status.
4.Educational Attainment and Occupation
One of the most important factor which determines one’s occupational chance is educational attainment. Table 12 -1 and table 12-2 shed light on this question. By focusing on the category of Managerial workers,a clear relationship has come tothe fore between occupation and educational attainment. The percentage of the
managerial workers is the highest among the people with graduate education.
The Emergence of the New Urban Middle Class in the Philippines and ltS Social Character/IKEDA MasatOshi
f()110wed by university graduates.the lowest among high school graduates.
Tabie 12-1 0ccupation by Educational Attainment in%(n)
Mng
Buz
ProftechClerk
BC
TotalHigh
Univ
Grad
17.2(5) 26.0(76) 33.6(36) 20.7(6) 21.8(64) 8.4(9) 6.9(2) 16.7(49) 20.6(22) 17.2(5) 20.8(61) 16.8(18) 38.0(11) 14.7(43) 20.6(22) 100.0( 29) 100.0(293) 100.0(107) Total 27.3(117) 18.4(79) 17.0(73) 19.6(84) 17.7(76) 100.0(429) γ2=37.2781 v=0.1702 p<0.0050 abbreviations in the table are as fbllowing <Educational Attainment> High is high school graduates. Univ is university 9raduates. Grad is Graduate work with degree and or Graduate work not completed. (Graduate school enrolees)<Occupation>
Mng is managerial workers Buz is business operators Proftech is professional/technical workers. Clerk is clerical/sales workers. BC is Blue Collar workers. and so on in the following tables. Table 12-2 Educational Attainment by occupational groups in%(n)High
Univ
Grad
TotalMng
Buz
ProftechClerk
BC
)))))56251
1
(r\(((3779540254
9冒 - 65.0(76) 80.9(64) 67.2(49) 72.7(61) 56.6(43) 30.7(36) 11.4(9) 30.1(22) 21.4(18) 28.9(22) 100.0(117) 100.0( 79) 100.0( 73) 100.0( 84) 100.0( 76) Total 6.8(29) 68.3(293) 24.9(107) 100.0(429)γ2=372781 v=0.1702 p<0.0050
Table12-2 analyzed the occupational characteristics from the view point of
educational attainment. As revealed in this table 12-2, in terms of graduate school education,managerial workers are the most highly educated people and it is followed by professional/technical workers, blue-collar workers and clerical workers. In this turn interesting,however, is the fact that blue-collar is better educated than clerical workers. The fact that even the people with graduate education are working as blue- collar workers suggests the existence of exodus of highly educated people as overseas contract workers.ill-2 1ncome Characteristics of the New middle Class.
1.The Respondents’lncome ln Comparison with the General Family lncome
Table 13 Annual tncome of Urban family(1997)
Income Range
number of famlies Ratio一 10,000 10,000- 19,999 20,000- 29,999 30,000- 39,999 40,000- 49,999 50,000- 59,999 60,000- 79,999 80,000- 99,999 100,000- 149,000 150,000-249,000 250,000-499,000 500,000一 8,111 82,827 181,310 297,082 367,272 372,881 816,428 715,339 1,348,750 1,391,201 870,693 298,748 0.1%
12
2.7 4.4 5.4 5.5 12.1 10.6 20.0 20.7 12.9 4.4 Total 6,750,642 100.0 source:1999 Philippine statistica1 Year Bo_ok p2-11 National St’atistical Coordination Board manila 1999 According to this table,the median of the annual income for urban family across the country is 120,000 pesos(equivalent to 10,000 pesos a month). As was mentioned intable 7 the median incomes of the family surveyed is 41,000 pesos a month.
Therefore,the income of the people surveyed is 4 times higher than that of the average urban families across the country.2.Age and lncome
In a society like Japan where the seniority system is dominant, wages rise as the age advances. How is the case in the Philippines? Table 14 1ncome Distrubution by Age Groups in%(n)under 40 above 40 Total
Low
Middle
High
Highest
42.9(94) 23.7(52) 16.0(35) 17.4(38) 19.5(43) 30.1(66) 25.9(57) 24.5(54) 31.1(137) 26.9(118) 21.0( 92) 21.0( 92) Tota1 100.0(219) 100.0(220) 100.0(439) 叱2=58.633 v=0.36546 p<0.0050 note:Income is categorized in the same way as in the Table 7 Table 14 indicates that those in younger bracket(those below 40)have lower income than those who are in the senior bracket(those above 40). In terms of theThe Emergence of the New Urban Middle Class in the Philippines and lbS Social Character/IKEDA Masatoshi median income,those under 40 receive 25,992 pesos while those above 40 receive 45,463pesos.The latter is 7590 higher than the former. It is supposed that the people in the senior bracket tend to take more profitable jobs which require experience and skills.
3.Gender and lncome
Table 15 1ncome Distribution by Sex h%(n)Men
Women
Totale託
l e㌦帥帥
bMm伍
24.4(71) 27.1(79) 24.4(71) 24.1(70) 44.5(66) 26.4(39) 14.2(21) 14.9(22) 31.1(137) 26.9(118) 21.0( 92) 21.0( 92) Total 100.0(291) 100.0(148) 100.0(439)Z2=22.605 v=02269 p<0.0050
In general, inequality between men and women is clearly found in income
distribution. Then,how is the case in the Philippines?Table 15 shows that more women are found to be in the low income bracket than in the high-income bracket. On the contrary, more men belong to the high income bracket than the low income bracket. While median income fbr men is 38,893 pesos, median income fbr women is 24,167 pesos. The latter is only 62.1%of the fbrmer. This difference appears to reflect the kind of occupation they are engaged in. As shown in Table 9, men tend to take more money making job than women do.4.Occupation and lncome
Both table 10 and table 14 indirectly suggests that there is a strong relationship between occupation and income. Table 161)elow directly indicates the relationship between occupation and income. Table 16 the relationship between occupation and income. in%(n)Low
Midd}eHigh
Highest
TotalManagerial
Business
Prof&technical
Clerical/Sales Blue Collar 19.1(22) 27.6(21) 19.5(15) 49.4(42) 40.3(32) 36.6(42) 23.7(18) 16.9(13) 29.4(25) 27.4(19) 22.6(26) 29,0(22) 20。8(16) 9.4(8) 24.2(16) 21.7(25) 19.7(15) 42.8(33) 11.8(10) 8.1(6) 100.0(115) 100.0( 76) 100.0( 77) 100.0( 85) 100.0( 73) Total 30.8(132) 27.5(117) 20.7(88) 21.0(89) 100.0(426)。。、。、1。,。m。 wasca、。g。ri、ed丘認蕊。y㌃麟1。。8;霊1.
Median income fbr each occupation is as fbllows. The.nedian income fbr managerial workers is highest at 64,615,fbllowed by the income of the business operators at 43,903pesos.The next is the income of the blue-collar worker at 32,000 pesos.As indicated by the large Cramer’s contingency coe伍cient,the relationship between the two variables is strong. Noteworthy,however,is the fact that the income of the blue- collar workers is higher than that of the white-collar workers. Su伍ce it to say that
the status inconsistency is observed among the white-collar workers. This
inconsistency may therfbre affect the social consciousness and political attitude of white.collar workers. 5.Educational Attainment and Income One of the important social factors that affect one’s income is his/her educationalattainment.
Table 17 Educational Attainment and lncome in%(n)Low
Middle
High
Highest
TotalHigh school
University
Grad not com Grad degree 39.3(11) 32.8(97) 30.1(16) 25.0(27) 32.1(9) 28.7(85) 20.8(11) 20.4(22) 28.6(8) 20.3(60) 18.9(10) 21.3(23) 0.0(0) 18.2(54) 30.2(16) 33.3(36) 100.0( 28) 100.0(296) 100.0( 53) 100.0(108) Total 31.2(135) 26.9(116) 21.1(91) 20.8(90) 100.0(432) X2=20.903 v=0.155 p<0.01 Cursory look at Table 17 reveals that the higher one is educated, the higher his/ her income becomes. The difference in the median income supports this statement. The median income of high school graduates is lowest at 31,666 pesos fbllowed by that of the university graduates at 36,986 pesos, next comes the median income of those who did graduate work but did not complete it at 57,712 pesos. On the other hand, that of those who finished graduate school with degree is highest at 57,712 pesos. Although the Cramer’s contingency coefficient is small at O.155,these two variables are not statistically independent at 1%1eve1.lV. The Emerging Process of the Urban New middle Class
lV-11ntergenerational Occupational Mobility Table 18 compares father’s occupation when our respondents were high school[1’he Emergence of the New Urban Middle Class in the Philippines and ltS Social Character/IKEDA Masatoshi
students and their first job a]fter school.
Table 18 Father’s Occupation and First Job after school in:n
Firstjob
Manager
Buz
Proftech ClericalBC
Tota}Father Manager
Buz Proftech Clerical BCqOO132
’051乙31
11丁⊥76103
21
P9S1
S4
只)703
9一9錫15▼
40▼
39△
77△
83▼
Total 9 1547
125
58
254
Marks in the table show △:Expanding occupational stratum ▼:Shrinking occupational stratum Abbreviations in the table show the followings Manager:Managerial workers Buz二Business operators Proftech:Proffesional/technical workers Clerical:Clerical/sales workers BC:Blue-collar workers According to this table, only 770ut of 254 respondents were in the same job category over the generatuion. From this, the gross mobility rate(GMR)is computedas
254-77
GMR=
=0.697254
This means that about 70%of middle class people experienced intergenerational social mobility. The business operator stratum, the managerial workers,and blue- collar worker stratum were shrinking strata. They had shrunk from 40 to 15,from 15 to 9 and 83 to 58 between the two generations respectively. On the other hand, theprofessional/technical worker stratum and the clericaVsales stratum were both
expanding strata. They had expanded from 39 to 47 and from 77 to 125 respectively. When it comes to the direction of mobility of the shrinking strata.22%of the blue- collar workers moved to the professional technical worker stratum. While 52.5%of of the business operators became clerica1/sales workers(downward mobility in terms of income). The above findings support the breakdown theory of the 01d middle class. After subtracting the stractural mobility rate from the gross mobility rate,we got the net mobility rate of O.453. This figure is large enough to indicate high social mobility in the Philippines.From table 18,we created table 19 by combining the managerial workers and the business operators, professional/technical workers into the upper middle class and
the other occupational categories into the lower middle class.
Table 19 1ntergenerational stratum mobility
Children after school in%(n)
Upper middle Lower middle Total
Father
Upper middle kower middle 41.5(39) Q0.0(32) 58.5(55) W0.0(128) 100.0( 94) ▼ P00.0(160)△ Total 28.0(71) 72.0(183) 100.0(254) X2=13.522 v=0.231 p<0.005 Marks in the table 19 are the same as in table 18 △:Expanding stratum ▼:Shrinking stratu皿 From this table, we get the net mobility rate of O.252. It is also found while theupper middle stratum is a shrinking stratum, the lower middle stratum is an
expanding stratum. Over the two generations, downward mobility surpasses upward
mobility. Regarding the possibility of becoming a member of the upper middle, a child whose origin is the upper middle is more likely to be an upper class person than a child who comes f士om the lower middle class by a margin of 21.5%. By the way,the odds ratio of the upper middle to the lower middle is 2.8364. These indicate that the high social status tends to be maintained over the generation irrespective of the fact that the downward mobility surpasses upward mobility. lV-2 lntragenerational Occupational Mobility Most people experience occupational mobility in his/her life(intragenerational social mobility). Table 20 compares two occupations.,the first occupation they took after graduating school and the other they are engaged on as of now. Out of 363 respondents,132 people remained in the same occupational stratum. Accordingly, the gross mobility rate(GMR)is363-132
GMR=
=0.637363
The Emergence of the New Urban Middle Class in the Philippines and lts Social Character/IKEDA Masatoshi In table 20, the structural mobility rate is O.377 the net mobility rate is O.637- 0.377=0.260.Although, the net Intragenerational rate is much smaller than the intergenerational mobility rate by a margin of O.193, still about one in every f()ur persons experiences social mobility・ Table 20 First Occupation and Present occupation Prsent occupation in:n
Manager
Buz
Proftech ClericalBC
Others
TotalFirst Manager
Buz Proftech Cle亘cal BC Others319320
1 16
4
384272
nO-⊥115393
5
233727
19●123963
001503
20
1565
199
46
18 △△ ▼△▼ Total98
66
62
74
54
9363
Abbreviations in the table show the fbllowings. Manager:Managerial workers Buz:Business operators Proftech:Professional/technical workers Clerical:Clerical/sales workers BC:Blue-collar workers Marks are the same as in the table 18. Let us look at the occupational stratum and its intragenerational mobility closer. First,the managerial!administrative stratum expanded from 20 to 98. It grew fbur times larger than it used to be and it had brought in 63 members from clerical/salesworkers stratum.
On the other hand, the clerica1/sales stratum had shrunk from 199 to 74 andbecame only one-third of that after schooL The business operator stratum had
expanded from 15 to 66 and had brought in 42 members from the clerical/sales
stratum. Among the 51 persons added,42 were clerica1/sales workers with the ratio of 82.4%. However those in blue-collar worker stratum had stayed in the same stratum during their generation. It had expanded from 46 to 54.The professional/ technical stratum also did not undergo great mobility.lt decreased from 65 to 62 with aslight difference of 3. Indications show that there are two career up patterns among the Philippine new middle class. One is by climbing up the ladder to managerial positions in f()rmal organizations. The other is by being an independent business operator. Like in table 19, we aggregated the siX occupational strata to get two social strata.From this we formed table 21.
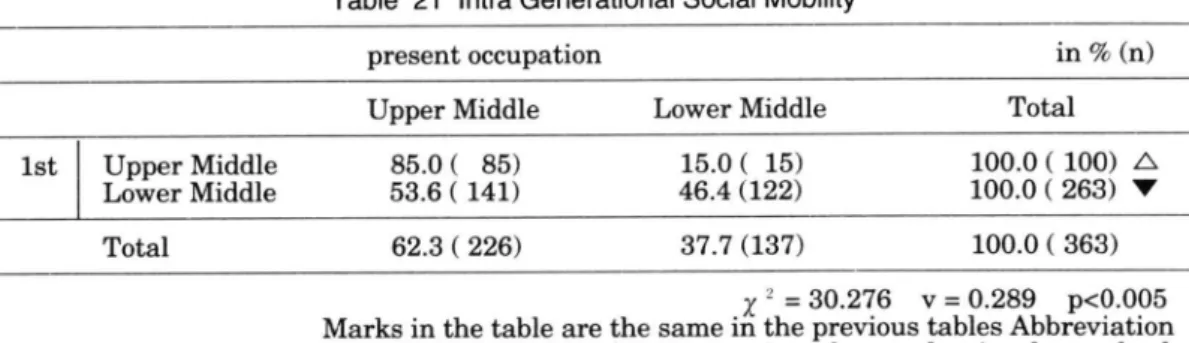
Table 211ntra Generational Social Mobility
present occupation in%(n)
Upper Middle Lower Middle Tota1 Upper Middle Lower Middle Total 85.0( 85) 53.6(141) 62.3(226) 15.0( 15) 46.4(122) 37.7(137) 100.0(100) △ 100.0(263) ▼ 100.0(363) γ2=30.276 v=0.289 p<0.005 Marks in the table are the same iri the previous tables Abbreviation lst:first occupation after graduating from school From table 21, we can see that 85.090 of those who started their career in the upper middle class remained in the same stratum. Whereas,53.6%of those who started from the lower middle class went up the socia1 ladder and became the member of the upper middle class. The percentage of the former is 31.4%larger than that of the latter. Odds ratio computed from this table is 4.9031. In order to make a good carreer up pattern, it is important to start from a good job which belongs to the upPer middle class after 9raduating from school. IV-3 The Total Inter Generational Mobility
Here, the total Inter generational Mobility means integrated two mobility
processes・ first:from the father’s occupation when our respondents were highschooler to their first occupation after school second:from the first occupation of our respondents after school to their present job Table 22 Father’s Occupation and Present occupation Present occupation in:nManager
Buz
Proftech ClericalBC
Others
Tota1Father
Manager
Buz
Proftech ClericalBC
Others
075888
11⊥-11←-11
521797
19●-540042
11
672996
11†⊥226389
021220
28△
44△
45△
79▼
80▼
32▼
Total86
51
55
59
50
7308
MarkS are the same as in the table 18. Father:Father’s occupation when our respondents were high schooler Present:present occupation of our respondentsThe Emergence of the New Urban Middle Class in the Philippines and ltS Social Character/IKEDA MasatOshi In table 22,69 out of 308 remained in the same occupational stratum. Accordingly gross mobility rate(GMR)is f()und to be 308-69 GMR= =0.776 308 As the structural mobility rate br皿ght about by the change in industria1 structure is O.224,the net mobility rate(NMR)is given by the following formula. NMR=0.776-O.224 = O.552 This figure indicates more than 50%of the people had expe㎡enced social mobility over the two generations.
For example managerial stratum is a remarkably expanding stratum. It has
expanded from 28 to 86 between the period of the father’s generation and the child’sgeneration. This occupational stratum has brought in members from the clerical
worker stratum,the blue-collar worker stratum,the business operator stratum and the profbssiona1/technical workers. On the other hand,the blue-collar worker stratum is a shrinking stratum. Thisstratum has decreased its member丘om 80 to 50 during the two generations. The
direction of七he movement is pointing towards the clerica1/sales(19)the managerial stratum(18)and the professional/technical stratum(14)in that order. The clerical/ sales worker stratum is a shrinking stratum as well. Its member has decreased from79to59 during the two generations. And its direction is moving towards the
mallsgerial stratum, followed by the professional/technical workers. The six occupations in table 22 are again aggregated into two social strata like what is done in table 19 to get table 23 Table 23 Total lnter generational Social Mobility Child’s stratum in%(n) Upper Middle Total Upper Middle Lewer Middle 76.1( 89) 53.9(103) 62.3(192) Lower Middle 23.9( 28) 46.1( 88) 37.7(116) Total 100.0(117) △ 100.0(191) ▼ 100.0(308)Z2=15.21635 v=0.22227 p<0.0050
Ftr in the table stands for FatherFf。m thi、 t。bl。,w。 g。t th・g・・ss m・bility・at・・fO.425, th・・t・u・tu・al m・bility・at・ of O.244 and the net mobility rate of O.181 and this is relatively small when compared to the intergenerational mobility rate found in table 20 by a margin of O.079. What b。。ught・b・ut this chang・in・th・n・t m・bility・at・a・e upw・・d m・bility・at・・f th・
10wer stratum and downward mobility of the upper middle stratum in the
intergenerational social mobility. However,this doesn’t give the optimistic prospect to the wide openness in the Philippine society. Here, the probability that a child whose origin is from the upper middle class to become a member of the upper middle class is bigger than that of a child from the lower middle by a margin of 22.2 percent. Since the odds ratio of the upper middle class to the lower middle class is 2.7157. This indicates that the high social status tends to be maintained over the tWo generations as examined in table 19. Regarding th。 p。・・ess t・th・・P・n…i・ty in th・PhilipPin・・, tw・t・bles ab・ut the re・ent t・end are computed. Table 24 and table 25 show the total intergenerational social mobility for the respondents in their 40’s, for the respondents in their 30’s respectively. Table 24 Total lnter Generational Social Mobility in their 40’s Children’s stratum in%(n)Upper Middle
Lower Middle Tota1Openness
Father
UpPer Middle kower Middle 66.7(36) U1.8(47) 33.3(18) R8.2(29) 100.0(54) P00.0(76) △▼ 0.9231 O.9184 Total 63.8(83) 36.2(47) 100.0(130) 0.9207 γ2=0.30900v=0.048 n.s. Abbreviations in the table stand for followings. Ftr is father’s stratum. Openness is the coef五cient of openness The child whose origin is from the upper middle is more likely to be the upper middle than the child from the lower middle by a mergin of 4.9 percentage point. By the way, the odds ratio of the upper middle to the lower middle is 1.234. Indication is that as the coef6cient of openness shows,in the case of 40’s, father,s social stratum didn’t affect that much the children’s social stratum However,changes took place in ten years. Table 25 shows the social mobility of the respondents in their 30’s. According to this table,the child whose origin is from the upper middle is more likely to be the upper middle than the child from the lower middle by a great mergin 。f 42.8 per・ent・g・p・int. By th・w・y,th・・dd・rati・・f th・upPer middl・t・th・1・w・・The Emergence of the New Urban Middle Class in the Philippines and lts Social Character/IKEDA Masatoshi middle is 7.64634. The coeMcient of openness which shows the openness of society is much smaller in this age bracket than that of 40’s. In view of fbregoing we can say that father’s social stratum strongly determines the children’s social stratum Table 25 Total lnter Generational Social Mobi|ity in their 30’s Children’s stratum in%(n)
Upper Middle Lower Middle Total
Openness
Total Upper Middle Lower Middle 84.6(44) 41.8(41) 56.7(85) 15.4(8) 58.2(57) 43.3(65) 100.0(52) 100.0(98) 100.0(150) 0.8421 0.3555 0.3547
Z2=25.17293 v=O.3448 P<0.0050
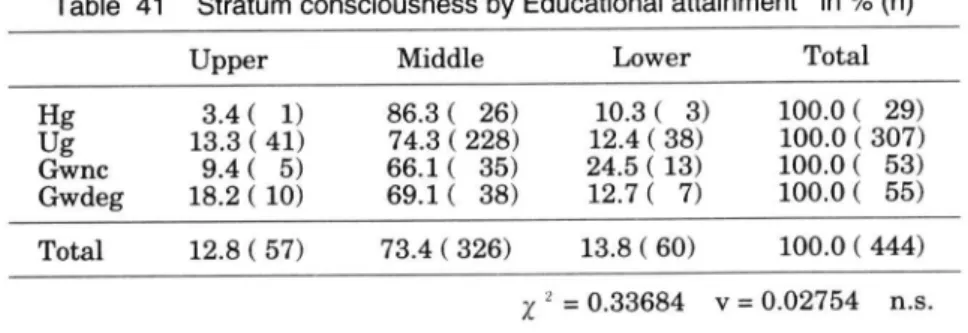
This trend becomes stronger past ten years. Does this indicate the trend that the Philippine society is moVing toward a closed society in terms of the social stratification? lV-4 Educational Attainment and Occupational Mobility As was shown in Table 12 Educational attainment and occupation are closely related each other. On the other hand, higher social status tends to be reservedamong the higher social stratum. Do these two facts mean that the higher
educational attainment is being handed down to the next generation? Table 26 Comparison of Educational attainment of Two GenerationsChild
in%(n)Hg
Ug
Gd
Total99d
HUG
Total 11.7(19) 3.3(5) 2.3(1) 7.1(25) 76.0(123) 84.5(125) 68.2( 30) 78.5(278) 12.3(20) 12.2(18) 29.5(13) 14.4(51) 100.0(162) 100.0(148) 100.0( 44) 100,0(354) ZL’=43.509 v=0.350581 p<0.0050 Accordillg to the table, being University graduates seems to be a minimum requirement f(}r one to be a member of the middle social stratum. More than one out of seven are educated at the graduate level in one sense or another. With the exception of the high school graduates, we can observe that the higher one’s father’s educational attainment is, the higher one’s educational attainment will be.29.5%of those whose father studied at graduate school also entered graduate school. On top of this,more than 15%of those who were enrolees in graduate schools le七their children study curricular lessons from private teachers or attend private
institutions for the purpose of upgrading marks in school. From this,We can say that parents who are highly educated motivate their children to take higher education and they can do this because they can afford to spend money on it.
V Life Style
Lifestyle is the expression how people consume goods,and a media through whichpeople exhibit their social status. According to Chua Beng-Huat,“even under
conditions of relative underdevelopment,identity construction and status display
through consumer products seem unavoidable”.3)It can be said that societies are stratified along the line of life style. During the research, some inf()rmants even say that・it’s not money but life style that is important as a criterion in judging one’s social status. For example, overseas contract workers earn a lot of money but that doesn’t automatically mean they belong to the middle class. What matters is the lifestyle that they lead.V-1Living Environment
House is probably the most ostentatious display of owner’s wealth.4)In the Philippines. the community where their houses are located is the most effective display of their wealth. Suf丘ce it to say that the people who live in slum areas are the lower class people. On the other hand, people who live in subdivisions or village are the upPer class people.General public lives in neighborhoods composed of houses made of concrete
materials that are not as good as the high class residential area,but not as bad as the lower class residential area like slum. Table 27 shows the relationship between the residential area and income groups. According to the table,29.4%of the middle class people live in the high class residential area. It further indicates the higher one’s income is,the higher his/her tendency to live in the high class residential area becomes(this is with the exception of the low-income group and the middle-income group).The Emergence of the New Urban Middle Class in the Philippines and lts Social Character/IKEDA Masatoshi
Table 27 Residential Area by lncome Groups in%(n)
H.C.RA. G.RA. Total
Low
Middle
High
Highest
25.5(35) 22.0(26) 28.3(26) 45.7(42) 74.5(102) 78.0( 92) 71.7( 66) 54.3( 50) 100.0(137) 100.0(118) 100.0( 92) 100.0( 92) Total 29.4(129) 70.6(310) 100.0(439) JUz=15.95739 v=0.19066 p<0.0050 abbreViations in the table are as follows. H.C.R.A. is High Class Residentia1 Area G.R.A. is The General Residential Area. Table 28 focuses on the relation ship between theoccupationa19roups.
residential area and the
Table 28 Residential Area by Occupational Groups in%(n)H.C.R.A. G.RA. Total
Manager
Buz
Proftech ClericalBC
Others
29.7(35) 27.5(22) 42.1(32) 22.1(19) 26.9(18) 16.7(2) 70.3(83) 72.5(58) 57.9(44) 77.9(67) 73.1(49) 83.3(10) 100.0(118) 100.0( 80) 100.0( 76) 100.0( 86) 100.0( 67) 100.0( 12) Total 29.2(128) 70.8(311) 100,0(439)X2=10.28617
v=0.1599 n.s. Although it is fbund that Occupation and Residential are independent with each other, there are marked differences in the percentage of the people who live in high- class residential areas. From table 28, professional/technical workers(42.1%)have the strongest tendency to live in a high-class residential area. The managerial workers(29.7%)follow this group with 29.790 by a margin ofi2.4%. On the whole,table 28 appears to reflect the difference in inome level among the occupational groups.When compared to the clerical workrs(22.1%), the blue-collar workers(26.9%)are more inclined to live in high-class residential area than theformer do. This reflects the difference of the income level between the two
occupational groups as was shown in table 16. It is enough to say that in the case of the residential area,status inconsistency was observed between the clerical workers and the white-collar workers. Another factor relevant to the residential area is ethnicity. Table 29 shows the connnection between the two.Table 29 Residential Area by Ethnic groups in%(n)
H.C.R.A. G.R.A. Total
Chinese
Non chinese 27.7(88) 30.2(26) 72.3(230) 69.8( 60) 100.0(318) 100.0( 86) Total 28.2(114) 71.8(290) 100.0(404) Xz=0,021059 v=0.007220 n.s. Abbreviation in this table are the same as the ones shown in table 28. Regarding general residential area, although the difference is not particulary noticeable,more ethnic Chinese(72.3%)than ethnic non Chinese(69.8%)tend to live in the general residential area rather than a high-class residential area despite of the being well-off in terms of income. This appears to contradict the finding that the ethnic Chinese are well off in terms of income and if he/she is more remeuerated he/she tends to live in high class residential area. This may be because ethnic Chinese tend to f()rm ethnic communltles irrespective of wealth. Other reasons aside from this remain to be analyzed. V-2Posession of Durable consumer goods as a status symbol Up to the financial crisis in July 1997, the most conspicuous trait of the lifestyle of Asian middle class people is a great thirst{for consumption. According to Aoki,“Asia is血110f sucess stories. In the whole world, this area can be said to be a success itsel£However,七here are differences f士om region to region but still they have something in common,like their lifestyle-overseas travel,the internationalization of their business,family life, their hobby, income, high educational attainmellt. The People who have new consciousness on life and lead different life style from their parents are increasing dramatically. It is said that in this part of the world, people who have monthly incomes that excesses $2,500number more than 30.5 million.“Aoki calls this income group “urban middleclass. This class tend to have common value system which lessens the national
diferences in different respects.”5[ Consumer goods ref【ect people’s way of life. In this research we hypothesized thatthe皿mber of consumer goods that one owns, for example, personal computer,fax
machine,passenger car,air conditioner,audiovisual equipment,video camera,laser
disc,credit card, golf club membership, sports club membership,second house,CATVThe Emergence of the New Urban Middle Class in the Philippines and lts Social Character/IKEDA Masatoshi subscription and others judge one’s level of・life.Table 30 shows the number of social status goods held by the different income groups. Table 30 number of consumer goods held by income groups in%(n) ~5
6~7
8~9
10~ Tota1LOW
Middle
High
Highest
45.5(62) 26.3(31) 13.0(12) 9.8(9) 38.0(38) 35.6(42) 26.1(24) 13.0(12) 14.0(19) 22.0(26) 31.5(29) 34.8(32) 12.5(17) 16.1(19) 42.4(27) 42.4(39) 100.0(136) 100.0(118) 100.0( 92) 100.0( 92) Total 26.0(114) 26.5(116) 24.2(106) 23.3(102) 100.0(438) Z2ニ82.25702 v=0.4336 p<O.0050 AS shown, by the large Cramer’s contingency coefflcient(v)of this table,the income evel and the number of consumer goods held are closely related. The ratio of the people who have more than 10 consumer goods increses according to the income level. While it is only 12.5 percent at the low income group,it jumps up to 42.4percent at the the highest income group. Table 31 displays the diffusion rate of the items and association coefficient measured by the cramer’s contingency coeMcient Table 31 Diffusion rate and Cramer’s contingency coefficientdiffusion
Income
Occupation
Stratum consPC
Air conCar
Credit card Sports club Golf club Second houseAudio
Video cameraFax
Celluar phoneTelephone
Laser discCATV
Educationinvst
65.9% 75.2 59.7 73.9 13.5 7.7 21.2 60.2 36.5 23.2 80.5 98.3 41.2 73.2 14.1 0.2609 0.17781 0.22442 0.2626 0.18824 0.1457 0.21876 0.168665 0.134772 0.23765 0.13881 0.06086 0.11782 0.16231 0。111492 O.183498 0.261799 0.23638 0.4688 0.145755 0.1441 0.18824 0.22307 0.152735 0.25734 0.21807 0.13294 0.210323 0.1223 0.115 0.13908427 0.1232163 0.14900 0.21812 0.231191 0.19481396 0.1432 0.1194 0.12165 0.11257 0.17338 0.100250208718
0.15429 0.05843 Abbreviations in the table are as follows Diffusion:iffusion rate Stratumcons:stratum consciousness Educationinvst:to let their children study curricular lessons from private teachers or atend private lnstitutes for the purpose of upgrading marks in the school. According to this table, items that are closely related to stratum consciousness arenot individual goods like audio equipment and video camera,but the so-called
relational items like sports club membership, golf club membership that are conducive to cultivating social relationship in which people build up their social position.Table 32 exhibits the relation between income and golf club membership.
Table 32 Golf club membership by income group in%(n)