統計的検定とブートストラップ法についての考察
著者
石村 貞夫, 石村 友二郎
雑誌名
鶴見大学紀要. 第4部, 人文・社会・自然科学編
号
51
ページ
65-68
発行年
2014-03
URL
http://doi.org/10.24791/00000162
Creative Commons : 表示 http://creativecommons.org/licenses/by/3.0/deed.ja統計的検定とブートストラップ法についての考察
Some remarks on statistical test using the Bootstrap methods
石村 貞夫・石村 友二郎
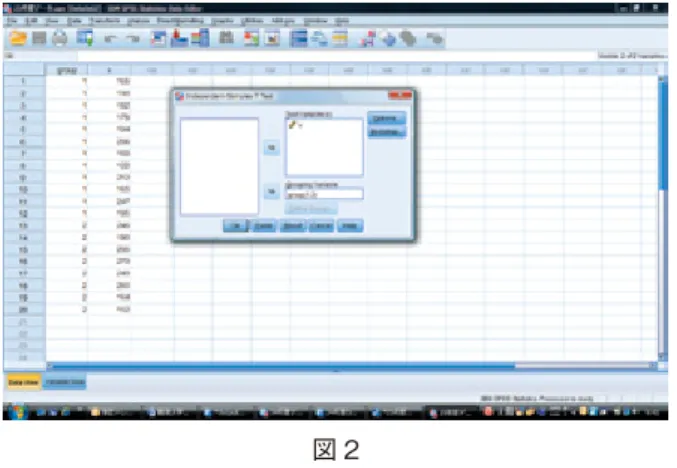
65 1.序文 統計学といえば、統計的推定や統計的検定が中心的 話題となる。 研究対象としての母集団のパラメータを推定したり 検定したりするとき、母集団は正規分布に従っている という正規性を仮定するのが一般的なのだが、研究対 象によっては、正規性を仮定できない場合も多い。 統計的検定では、データの測定値を順位に置き換え るというノンパラメトリックな方法が開発され、 Wilcoxon の順位和検定や Kruskal-Wallis の検定な ど、多くのノンパラメトリック検定が知られている。 それとは別に、B.Efron によって開発されたブート ストラップ法という新しい統計処理がある。この方法 は、標本から母集団を再生するという方法で、乱数を 利用するところに特徴がある。統計解析用ソフトSP SSでは、新しいバージョンから、このブートスト ラップ法が追加されている。 そこで、この掌篇では、正規性を仮定した2つの母平 均の差の検定方法、ノンパラメトリックによる2つのグ ループの差の検定方法、ブートストラップ法による2つ の母平均の差の検定方法の3つの統計的検定を比較検討 してみよう。 データは、次のように入力される。 2.正規性を仮定したt検定 SPSSを使って、2つの母平均の差の検定をおこな うには、次のように、検定変数を移動し、 ボタン をクリックする。 統計的検定とブートストラップ法についての考察
統計的検定とブートストラップ法についての考察
Some remarks on statistical estimation using the Bootstrap methods
石村 貞夫・石村 友二郎
Sadao ISHIMURA and Yujiro ISHIMURA
図 1 図 2 この出力は、次のようになる。Levene's Test の Sig. を見ると等分散を仮定できるので、次に等分散を 仮定した場合の有意確率 Sig.(2-tailed)を見る。する と、有意確率は0.05以下なので、2つのグループ間に有 意差があることがわかる。
T-Test
表1 Group Statistics group N Mean Std. Deviation Std. Error Mean x 1 12 179.67 34.812 10.049 2 8 222.75 48.735 17.230表2 Independent Samples Test
Levene's Test for Equality of
Variances
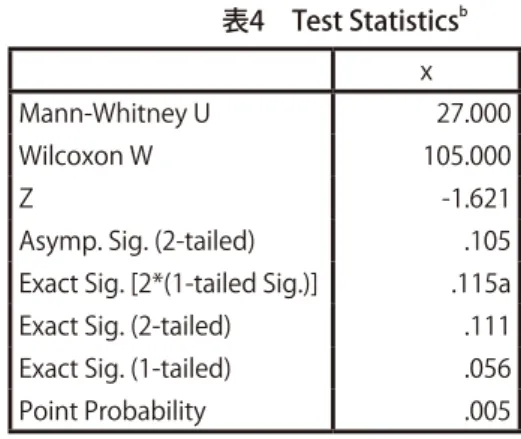
t-test for Equality of Means F Sig. t df Sig. (2-tailed) x Equal variances assumed 2.065 .168 -2.314 18 .033 Equal variances not assumed -2.160 11.710 .052 3.ノンパラメトリック検定 SPSSを使って、ノンパラメトリック検定をおこ なうには、次のように、検定変数を移動し、 ボタ ンをクリックする。 表4 Test Statisticsb x Mann-Whitney U 27.000 Wilcoxon W 105.000 Z -1.621
Asymp. Sig. (2-tailed) .105 Exact Sig. [2*(1-tailed Sig.)] .115a Exact Sig. (2-tailed) .111 Exact Sig. (1-tailed) .056 Point Probability .005 a. Not corrected for ties.
b. Grouping Variable: group
4.ブートストラップ法による検定 SPSSを使ってブートストラップ法による検定を おこなうには、次のように、Bootstrap をチェックす る。 この出力は、次のようになる。Exact Sig.を見ると 有意確率が0.05より大きいので、したがって、2つのグ ループ間に有意差があるとはいえない。
Mann-Whitney Test
表3 Ranksgroup N Mean Rank Sum of Ranks
x 1 12 8.75 105.00 2 8 13.13 105.00 Total 20 この出力は、次のようになる。このブートストラッ プ法では、サンプル数が1000個になっている。表6で は、各グループの母平均の信頼区間が信頼係数95%で 計算されている。 表7では、2つのグループの差の検定が行われ、有意 確率 Sig.(2-tailed)が0.05以下なので、2つのグループ 間に有意差があることが分かる。
Bootstrap
表5 Bootstrap SpecificationsSampling Method Simple
67
統計的検定とブートストラップ法についての考察 表6 Group Statistics
group Statistic Bootstrapa
Bias Std. Error 95% Confidence Interval Lower Upper x 1 N 12 Mean 179.67 -.06 10.10 160.46 198.61 Std. Deviation 34.812 -2.085 7.238 17.027 46.233 Std. Error Mean 10.049 2 N 8 Mean 222.75 .21 16.49 191.19 254.00 Std. Deviation 48.735 -4.453b 9.659b 18.801b 59.701b Std. Error Mean 17.230
a. Unless otherwise noted, bootstrap results are based on 1000 bootstrap samples
b. Based on 999 samples
表7 Bootstrap for Independent Samples Test
Bootstrapa Bias Std. Error Sig. (2-tailed) 95% Confidence Interval Lower Upper x Equal variances assumed -.271 19.430 .049 -80.275 -5.541 Equal variances not assumed -.271 19.430 -80.275 -5.541
a. Unless otherwise noted, bootstrap results are based on 1000 bootstrap samples ここで、取り出すサンプルの数を 5000個に増やし てみよう。すると、その出力は、次のようになる。し たがって、サンプルの数を増やすと有意確率も変化す るのだが、その値は必ずしも、小さくなるとは限らな いことがわかる。 表8 Bootstrap Specifications
Sampling Method Simple
Number of Samples 5000 Confidence Interval Level 95.0% Confidence Interval Type Percentile
表9 Bootstrap for Independent Samples Test
Bootstrapa Bias Std. Error Sig. (2-tailed) 95% Confidence Interval Lower Upper x Equal variances assumed .074 19.364 .050 -79.641 -4.079 Equal variances not assumed .074 19.364 -79.641 -4.079
a. Unless otherwise noted, bootstrap results are based on 5000 bootstrap samples
さらに取り出すサンプルの数を10000にしてみると、 次のような出力結果を得る。
表10 Bootstrap Specifications
Sampling Method Simple
Number of Samples 10000 Confidence Interval Level 95.0% Confidence Interval Type Percentile
表11 Bootstrap for Independent Samples Test
Bootstrapa Bias Std. Error Sig. (2-tailed) 95% Confidence Interval Lower Upper x Equal variances assumed .392 19.552 .049 -80.250 -4.548 Equal variances not assumed .392 19.552 -80.250 -4.548
a. Unless otherwise noted, bootstrap results are based on 10000 bootstrap samples
ところが、取り出すサンプル数を100000のように多 くしてしまうと、次のような警告がでて、SPSSは 計算を中止する。
表12 Bootstrap Specifications
Sampling Method Simple
Number of Samples 100000 Confidence Interval Level 95.0% Confidence Interval Type Percentile
表13 Warnings
No statistics are computed for a split file in the Independent Samples table. The split file is: $bootstrap_split=3866. No statistics are computed for a split file in the Independent Samples table. The split file is: $bootstrap_split=13815. The total number of pivot table cells across split files exceeds 1362033. This limit can be altered by using the SET MXCELLS command. If the working file was being created or modified during the current procedure, any changes were probably lost. Execution of this command stops.
また、サンプルの数が同じであっても、ブートスト ラップ法をおこなうたびに、その出力結果が異なると いうことに注意しておこう。次の出力は、サンプル数 が1000の場合である。表7では有意差が見られたのだ が、表15では有意確率 Sig.(2-tailed)が0.05より大き くなっているので、2つのグループ間に有意な差がある とはいえない。 表14 Bootstrap Specifications
Sampling Method Simple
Number of Samples 1000 Confidence Interval Level 95.0% Confidence Interval Type Percentile
表15 Bootstrap for Independent Samples Test
Bootstrapa Bias Std. Error Sig. (2-tailed) 95% Confidence Interval Lower Upper x Equal variances assumed -.089 20.239 .058 -82.012 -2.885 Equal variances not assumed -.089 20.239 .076 -82.012 -2.885
a. Unless otherwise noted, bootstrap results are based on 1000 bootstrap samples
参考文献
1.M.G.Kendall Kendall's Advanced Theory of Statistics, Volume 1,2,3 CHARLS&GRIFIN
2.石村貞夫 入門はじめての統計解析 東京図書
3.石村貞夫 他 SPSSによる統計処理の手順 第6版 東京図 書
統計的検定とブートストラップ法についての考察
Some remarks on statistical test using the Bootstrap methods
歯学部 准教授 石村貞夫 早稲田大学大学院 基幹理工学研究科 応用数学科