Development of an In-line Near-Infrared
Spectrometer and a Near-Infrared Imaging
Device and Their Application to Pharmaceutical
Analysis
著者(英)
Kodai Murayama
学位名
博士(工学)
学位授与機関
関西学院大学
学位授与番号
34504乙第384号
URL
http://hdl.handle.net/10236/00027324
Development of an In-line Near-Infrared
Spectrometer and a Near-Infrared Imaging
Device and Their Application to Pharmaceutical
Analysis
A Thesis for the Degree
of
Doctor of Engineering
Submitted to
School of Science and Technology
Kwansei Gakuin University by
Kodai Murayama
Contents
General Introduction 1
References 14
Chapter 1: A Polychromator-Type Near-Infrared Spectrometer with a
High-Sensitivity and High-Resolution Photodiode Array Detector for
Pharmaceutical Process Monitoring on the Millisecond Time Scale 24
Abstract 25
1. Introduction 27
2. Development of High-density and High-sensitivity PDA Detector 30
3. Design of NIR Spectrometer 34
4. Experimental 38
5. Results and Discussion 40
6. Conclusion 43
7. References 45
Chapter 2: Feasibility Study of Diffuse Reflectance and Transmittance
Concentration in Bilayer Tablets using High-speed
Polychromator-type Spectrometer 61
Abstract 62
1. Introduction 64
2. Materials and Methods 68
3. Results and Discussion 73
4. Conclusion 77
5. References 79
Chapter 3: Application of a Newly Developed Portable NIR Imaging Device to
Dissolution Process Monitoring of Tablets 95
Abstract 96
1. Introduction 98
2. Materials and Methods 102
3. Results and Discussion 106
4. Conclusion 110
Chapter 4: Image Monitoring of Pharmaceutical Blending Processes and the
Determination of an End Point by Using a Portable Near-Infrared
Imaging Device Based on a Polychromator-Type Near-Infrared
Spectrometer with a High-speed and High-Resolution Photo Diode
Array Detector 127
Abstract 128
1. Introduction 129
2. Experimental Section 132
3. Results and Discussion 135
4. Conclusion 138
5. References 140
Chapter 5: An Application for the Quantitative Analysis of Pharmaceutical
Tablets using a Rapid Switching System between a Near-Infrared
Spectrometer and a Portable Near-Infrared Imaging System Equipped
with Fiber Optics 158
Abstract 159
2. Instrumentation 165
3. Material and Methods 167
4. Results and Discussion 168
5. Conclusion 173
6. References 176
Conclusion 193
Acknowledgements 195
List of Abbreviations
AD: analog to digital
AOTF: acousto-optic tunable filter API: active pharmaceutical ingredient AsA: ascorbic acid
DR: diffuse reflectance
D-NIRs: distributed near-infrared spectrometer DIF: direct interface
FDA: food and drug administration FIF: fiber interface
FOV: field of view
FT: Fourier transformation HPMC: hydroxypropyl cellulose IC: integrated circuit
ICH: international conference on harmonization of technical requirement InGaAs: indium gallium arsenide
LV: latent variable
Mg-St: stearic acid magnesium salt Mid-IR: mid-infrared
NEP: noise equivalent power NIR: near-infrared
PAT: process analytical technology PCA: principal component analysis
PCMW: perturbation-correlation moving window PLSR: partial least squares regression
PD: photodiode
PDA: photodiode array
P-NIRs: polychromator near-infrared spectrometer QbD: quality by design
RMS: root mean square
RMSECV: root-mean-square-error of cross-validation RMSEP: root means squared error of prediction SD: standard deviation
SNR: signal to noise ratio Tr: transmission
2DCOS: two-dimensional correlation spectroscopy UV: ultraviolet
General Introduction
In the production of a large number of pharmaceuticals, continuous quality assurance has become a major issue. In 2004, the US Food and Drug Administration (FDA) proposed the Process Analytical Technology (PAT) with the aim of improving the development efficiency, quality, and productivity of pharmaceutical products.1 With this proposal, the introduction of systems/analyzers has advanced in the pharmaceutical manufacturing line. Figure 1 shows the conceptual diagram of PAT. In the PAT for pharmaceutical product manufacturing, clarifying the variable factors for the analysis and quality control of the manufacturing process, understanding the primary factors, and process improvement by feeding back the obtained results to the manufacturing process, are desired. For this purpose, an analyzer capable of real-time measurement is required.1-5 Further, for providing high quality pharmaceutical products in a stable and efficient manner, the concept of QbD (Quality by Design) has attracted attention. In the “Pharmaceutical development guidelines Q8” (R2) presented by the International Conference on Harmonization of Technical requirement (ICH), QbD is defined as a systematic approach to development that begins with predefined objectives and emphasizes product and process understanding and process control, based on sound science and quality risk management. Based on these guidelines, introduction of
analyzers into the process lines is actively being studied.6-7
The in-line analysis tool is an essential technique to understand the formulation process and forms the core of PAT for implementing a new quality control system for pharmaceutical products. Since the in-line analysis tools can rapidly analyze without any impact on the manufacturing process, they have the advantage of obtaining a lot of high quality information for understanding the manufacturing process.1-3 Spectroscopic techniques are one of the most effective methods of PAT in pharmaceutical processes.2,4,8,9 Representative spectroscopic techniques for industrial process analysis are an ultraviolet-visible (UV-Vis) spectroscopy, mid-Infrared (mid-IR) spectroscopy, Raman spectroscopy and Near-Infrared (NIR) spectroscopy.2 UV-Vis spectroscopy is effective for extracting qualitative and quantitative information regarding the contents of tablets.10 Mid-IR spectroscopy, NIR spectroscopy and Raman spectroscopy are effective for API concentration analysis, detection of intramolecular and intermolecular interactions, and evaluation of physical and chemical characteristics. It is also effective for evaluation of pharmaceutical blends and granulation processes.11-13 In particular, NIR spectroscopic analysis technology is promising as an in-line analysis tool and many studies and practical implementation are progressing. Because of NIR spectroscopy enables non-destructive, non-contact and rapid analysis
by a diffuse reflection method of pharmaceutical formulation. This feature is difficult to achieve with other spectroscopy. In addition, with the purpose of evaluating and analyzing the variations in component concentration distribution and non-uniformity of the final product or the target of the process, the developments in imaging devices are progressing.8,9 In particular, the NIR imaging device has become an important tool for understanding the quality characteristics defined in the QbD approach.14-17
NIR spectroscopy is one of the analytical methods capable of rapid analysis using light in the wavelength range of 800 to 2500 nm. There are four main characteristics of NIR spectroscopy. First is to be able to observe the absorption spectrum derived from the fundamental vibration overtones and combination modes of the molecular vibrations of the functional groups (O-H, C-H, N-H) that contain hydrogen atoms. In addition, on the short wavelength region of NIR, absorption spectrum of electronic transition of molecules is observed. Second is to be able to analyze without choosing the state of the sample, namely solid, liquid or gas. The third is to be able to perform non-destructive analysis without requiring pretreatment of the sample. In particular, the state of the pharmaceutical sample is often the state of the powder. Therefore, NIR spectroscopy can be analyzed by using diffuse reflection method, which is advantageous for non-destructive measurement of powder. The diffuse reflection method is one of
reflection methods. The diffuse reflection method is a method of measuring reflected light that has been absorbed by repeating reflection, refraction transmission, scattering, etc. of NIR light inside the sample and then again outside the sample. The fourth is to be able to perform contactless remote analysis using glass or optical fibers.8,18
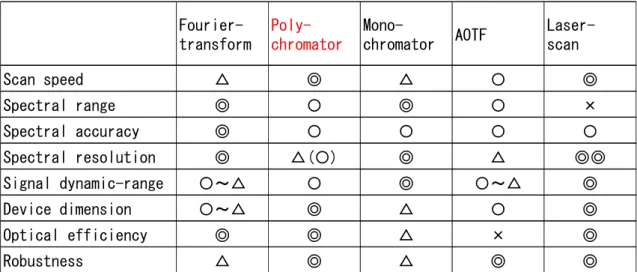
Some of the representative spectroscopic methods of the NIR spectroscopic device are the Fourier transformation (FT) method, monochromator method, laser scan method, polychromator method and so on. Table 1 shows the features of each spectroscopic method. In the FT method, the spectrum is measured by Fourier transform of the optical interference signal obtained by moving in parallel a reflecting element such as a mirror and continuously changing the optical path length with the reference light.19 By providing a wavelength reference mechanism inside the spectroscopic device, long wavelength measurement accuracy can be achieved. Further, in principle, it has the superiority of optical throughput. However, since it has a movable mechanism of the optical element, there are a few demerits such as long measurement time and susceptibility to vibrations, but in recent years, it is widely being used in the field of spectroscopic analysis. In the monochromator method, spectra are obtained by filtering specific wavelengths using diffraction gratings or acousto-optic elements.20 In the monochromator method, wavelength scanning is performed by changing the angle of
the diffraction grating or the ultrasonic frequency of the acousto-optic device. Due to the high filtering effect of diffraction grating, high dynamic range and high wavelength resolution can be achieved. However, since specific wavelengths are cut out and measured, there are demerits such as long measuring time, large size, and susceptibility to vibrations. Laser scanning type (wavelength scanning type) is a method in which the light intensity from the sample is measured while scanning the wavelength of the irradiating light.21 Since laser light is used, high wavelength resolution and high dynamic range characteristics can be easily obtained. On the other hand, since the measurement wavelength range is limited by the oscillation range of the laser, it is expensive, as it needs many laser light sources for measuring a wide-band. In polychromator method, wavelength dispersion of NIR light is carried out using diffraction grating or the like and the spectral region is simultaneously detected by a multi-channel detector. Since polychromator method has high light utilization efficiency and it can be configured without mechanically movable parts, it has features such as high resistance to vibration and easy miniaturization.21 However, it is not as easy for the number of channels in the detector to increase the wavelength resolution compared to the other methods in order to determine the wavelength resolution.21,22
the spectroscopic method should be capable of detecting diffuse reflected light. Further, since the manufacturing process must be monitored in real time, functions such as high speed, compactness, and maintainability are required.2 From this point of view, if in-line NIR spectrometer take into consideration the contents of the features in Table 1, the polychromator type that has no mechanical driving part, can be considered suitable.2,21 However, as described above, polychromator type spectroscopic device has the problem of low wavelength resolution.
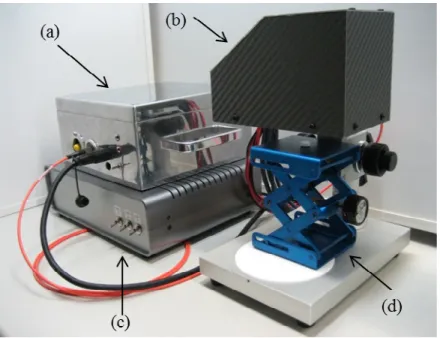
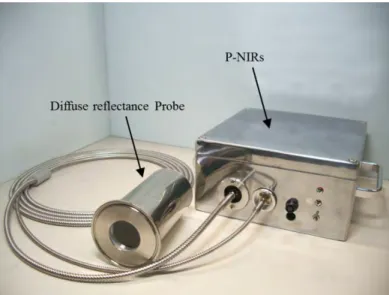
In this paper, in order to realize a high-sensitivity Photo Diode Array (PDA), it was developed a world-class high-density 640-element PDA detector and a charge amplifier Integrated Circuit (IC). Using the PDA sensor that combines the high-density PDA and high-sensitivity IC, a polychromator type NIR spectrometer was developed that has high-speed and high wavelength resolution characteristics.23 Since this polychromator-type NIR spectrometer possesses a high speed that can acquire a weak diffuse reflection spectrum in 10 msec or less, and a high wavelength resolution of 1.25 nm or less, it can achieve all the functions of an in-line analysis tool. Figure 2 shows the developed in-line NIR spectrometer. Figure 2 (a) shows the fiber interface type NIR spectrometer, Figure 2 (b) shows the diffuse reflectance optical fiber probe, and Figure
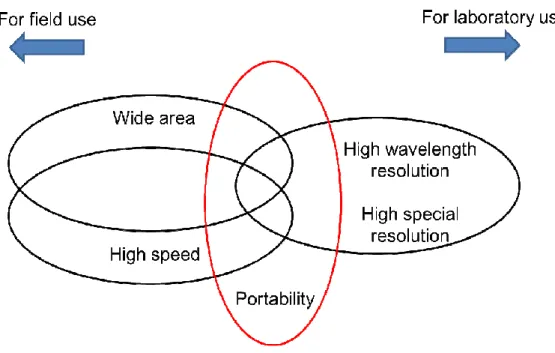
2 (c) shows the spectro-engine of polychromator type NIR spectrometer. The fiber interface type NIR spectrometer is used with the diffuse reflectance optical fiber probe. Further, by combining the polychromator type NIR spectrometer and the mirror scanning optical system, a portable NIR imaging device was developed that can be used onsite. Figure 3 shows the developed portable NIR imaging device and the in-line NIR spectrometer. The portable NIR imaging device is used by connecting the in-line NIR spectrometer with optical fiber. The conventional NIR imaging devices are a microscope-type FT-NIR imaging device with motorized XY stage.14 Although the conventional NIR imaging device based on FT-NIR is excellent sensitivity and wavelength resolution, it has a problem of large size and slow measurement speed. However, the developed portable NIR imaging device is 18 cm × 20 cm × 22 cm in size, approximately 2 kg in weight and small enough to carry with one hand.24-26 In addition, the portable NIR imaging device can acquire NIR imaging data composed of 10000 NIR spectra in approximately 15 minutes and has high speed of tenth times or more compared with the conventional FT-NIR type NIR imaging devices. Figure 4 shows the diagram of the function necessary for NIR imaging devices. Our portable NIR imaging device succeeded in offering the totally new function of portability to NIR imaging device. Using this in-line NIR spectrometer and NIR imaging device, the in-line
monitoring of the pharmaceutical product manufacturing process, tablet penetration analysis, and homogeneity of mixed samples and tablets were investigated.23-28
In Chapter 1, in order to realize a compact, high resolution, high sensitivity, high speed polychromator type NIR spectrometer (P-NIRs), the world-class high-density and high-sensitivity array detector was developed.23 As P-NIRs use the newly developed 640-element PDA detector, they show an improved wavelength resolution and high sensitivity. Since the existing NIR spectrometers have PDA detectors having up to 512 elements, their maximum wavelength resolution is 1.56 nm. However, the newly developed PDA detector has made it possible to reach a wavelength resolution of 1.25 nm or less. Further, by using the PDA detector in conjunction with the newly developed charge amplifier array, measurement time has been shortened to about one 100th (from 1 sec to less than 10 msec). A high-performance prototype model was developed through mechanical investigation and prototyping of the remote DR detection mechanism necessary for the in-line monitoring of pharmaceutical processes, introduction of high-speed data processing, and addition of functions such as wireless interfaces. And a high-speed NIR spectrometer was developed for in-line use and validated its performance. In PAT, since the timely quality parameters and functional
properties of pharmaceutical products have to be monitored during the manufacturing process, high-speed P-NIRs are the extremely suitable NIR spectroscopes. Furthermore, due to its small size, it can be very easily installed in various pharmaceutical process lines. By measuring the DR-NIR spectra of D-mannitol and talc powders, P-NIRs were confirmed the achievement of high speed, high sensitivity, and high resolution. Further, P-NIRs was succeeded in the in-line monitoring of the mixed state of the powder samples using P-NIRs.
In Chapter 2, the feasibility of analysis of API inside the bi-layer tablets was investigated on the millisecond timescale using NIR spectroscopy.27 In this experiment, the newly developed P-NIRs that can enable rapid spectral measurement of tablets were used. In the transmission measurement of tablets, since the transmitted light is extremely weak, measurement is difficult. However, since the NIR spectra of bi-layer tablets gave DR- and Tr-NIR spectra at 500 and 400 msec respectively. Comparison of the NIR spectrum with its second derivative showed that NIR spectrum was specific and selective with respect to the variations in ascorbic acid (AsA) concentration. Verification results and regression vectors demonstrated that the PLSR model enables the estimation of AsA concentration in bi-layer tablets. It was confirmed that the Tr-NIR
method was quite robust with respect to the orientation of the tablet. Therefore, this study is one-step towards the realization of real-time release test as it enables the transmission measurement of bi-layer tablets in less than a second.
In Chapter 3, the application of new portable NIR imaging device (D-NIR) in the dissolution process of tablets for the needs of PAT and/or QbD is reported.25 In the conventional NIR imaging devices, since the NIR imaging is acquired while operating the sample, there are limitations on the speed and device size in acquiring the solubility of the tablet. However, since D-NIRs have high speed as well as portability, they are suitable for visualizing the dissolution process of the tablets that change moment by moment. The NIR spectra were measured in the 1000 to 1600 nm region of the model sample tablet containing 20 wt% of AsA and 80 wt% of HPMC as API during the dissolution process for up to 300 minutes. In the second derivative spectrum of the sample tablet, the 1361 nm band could be clearly identified as the unique band of AsA. As expected, the color contrast in the tablet dissolution image had changed before the start and this result was significantly enhanced by using the peak height ratio based images. The understanding of the tablet dissolution process, such as the degree of penetration of water into the tablet, can be improved by NIR imaging. The results
obtained in this study demonstrate that NIR imaging that uses the spectral variations such as band intensity variation and peak-height ratio variation at 1361 nm is a powerful tool for the evaluation of the tablet dissolution process.
In Chapter 4, a new version of the NIR imaging device shown in Chapter 3 was developed.26 The new version achieved a high signal-to-noise ratio and high speed. The SNR of the new version is 10 times that of the old version and the measurement speed of the new version has improved to 7 times the old version. By using the new version, the blending monitoring was performed the in-line evaluation of the heterogeneity during the blending process and succeeded in determining the endpoint of homogeneous mixing. To evaluate the uniformity of mixed samples using the NIR imaging device, offline analysis at the laboratory was common. However, with the new version of NIR imaging device, it has become possible to perform at-line analysis at the site of the mixing process. In this experiment, using an in-line NIR spectrometer, continuous monitoring of the mixing process and NIR imaging spectra of the mixed samples were measured at different times. NIR imaging revealed that the AsA distribution in the blended sample varies over time. It was confirmed that a mixing time of 8 minutes was sufficient for homogeneous mixing. This study demonstrated that NIR imaging is
extremely useful for the further understanding of the results of in-line monitoring of the blending process.
In Chapter 5, in order to facilitate the development of probe design and in-line type NIR spectrometer, an optical fiber switching system was developed that can switch between spot size variable type DR probe and NIR imaging device (D-NIRs).28 As an in-line analytical tool, the optimal design of a diffuse reflective probe is important in determining the spectral quality. However, the diffuse reflective probes are not designed considering the in-plane variations of powder samples. This switching system can acquire DR spectrum and NIR imaging data with one polychromator type NIR spectrometer (P-NIRs). Therefore, it was possible to evaluate the dispersibility and uniformity of the sample by NIR imaging and the quality of the spectral data obtained by DR probe. A model tablet containing 0 to 10% AsA was prepared as API and NIR spectrum in the 950 to 1700 nm region was measured using P-NIRs. The optical switching system provided with D-NIRs and P-NIRs was able to collect the DR spectrum and NIR imaging data rapidly, accurately, and automatically using the optical fiber-type switching module of the rotary mechanical parts. The NIR spectra of the model tablet samples were measured using spot sizes for the DR probe of ⌀1 and ⌀5
mm. The predicted concentration value of AsA was more accurate for ⌀5 mm than ⌀1 mm. In addition, the optimal spot size using NIR imaging data was estimated to be ⌀5 mm to ⌀7 mm. Therefore, the possibility of selecting a more suitable optical fiber probe by using a system that can switch between single point measurement type optical fiber probe and NIR imaging measurement is suggested.
In this paper, developed a high speed, highly sensitive in-line NIR spectrometer and portable NIR imaging device were clarified that the visualization of pharmaceutical manufacturing process can be realized. These results suggest that the in-line NIR spectrometer and NIR imaging device developed for the quality control of pharmaceutical manufacturing process are useful analysis tools. The developed in-line NIR spectrometer and NIR imaging device are expected to be applied to chemical processes, paper production processes, film production processes, food production processes, agriculture, and healthcare in addition to pharmaceutical manufacturing processes. Furthermore, the developed high-density, high-sensitivity PDA detector can be expected to be applied to other spectroscopic methods (for example, application to Raman spectroscopy apparatus).
References
1. U.S. Food Drug AdministrationDA, Guidance for Industry, PAT: A Framework for
Innovative Pharmaceutical Development, Manufacturing, and Quality Assurance
(U.S. Food and Drug Administration, Maryland, 2004).
2. Bakeev, K. A. (Ed.). (2010). Process analytical technology: spectroscopic tools and implementation strategies for the chemical and pharmaceutical industries. John
Wiley & Sons., p.13-38.
3. Cogdill, R. P., Knight, T. P., Anderson, C. A., & Drennen, J. K. (2007). The financial returns on investments in process analytical technology and lean manufacturing: benchmarks and case study. Journal of Pharmaceutical Innovation, 2(1-2), 38-50. 4. Workman Jr, J. (1995). A review of process near infrared spectroscopy: 1980–1994.
Journal of near infrared spectroscopy, 1(4), 221-245.
5. Scott, B., & Wilcock, A. (2006). Process analytical technology in the pharmaceutical industry: a toolkit for continuous improvement. PDA journal of pharmaceutical
science and technology, 60(1), 17-53.
6. International Conference on Harmonisation of Technical Requirements for Registration of Pharmaceuticals for Human Use, ICH Harmonised Tripartite
7. Kourti, T., & Davis, B. (2012). The business benefits of quality by design (QbD).
Pharm Eng, 32(4), 1-10.
8. Y. Ozaki and T. Amari. (2000): Near-Infrared Spectroscopy in Chemical Process Analysis. Sheffield Academic Press, p.53-92.
9. Hassell, D. C., & Bowman, E. M. (1998). Process analytical chemistry for spectroscopists. Applied Spectroscopy, 52(1), 18A-29A.
10.Behera, S., Ghanty, S., Ahmad, F., Santra, S., & Banerjee, S. (2012). UV-visible spectrophotometric method development and validation of assay of paracetamol tablet formulation. Journal Analytical and Bioanalalytical Techniques, 3(6), 2-6. 11.Wartewig, S., & Neubert, R. H. (2005). Pharmaceutical applications of Mid-IR and
Raman spectroscopy. Advanced drug delivery reviews, 57(8), 1144-1170.
12.T.R.M De Beer, C. Bodsonb, B. Dejaegher, B. Walczak, P. Vercruyssea, A. Burggraevea, A. Lemos, L. Delattre, Y. Vander Heyden, J.P. Remone, C. Vervaet, W.R.G. Baeyens (2008). Raman spectroscopy as a process analytical technology (PAT) tool for the in-line monitoring and understanding of a powder blending process. Journal of pharmaceutical and biomedical analysis, 48(3), 772-779.
13.Vergote, G. J., De Beer, T. R. M., Vervaet, C., Remon, J. P., Baeyens, W. R. G., Diericx, N., & Verpoort, F. (2004). In-line monitoring of a pharmaceutical blending
process using FT-Raman spectroscopy. European Journal of Pharmaceutical
Sciences, 21(4), 479-485.
14. Šašić, S., & Ozaki, Y. (Eds.). (2011). Raman, infrared, and near-infrared chemical imaging. John Wiley & Sons.
15. Reich, G. (2005). Near-infrared spectroscopy and imaging: basic principles and pharmaceutical applications. Advanced drug delivery reviews, 57(8), 1109-1143. 16. Awa, K., Okumura, T., Shinzawa, H., Otsuka, M., & Ozaki, Y. (2008).
Self-modeling curve resolution (SMCR) analysis of near-infrared (NIR) imaging data of pharmaceutical tablets. analytica chimica acta, 619(1), 81-86.
17. Shinzawa, H., Awa, K., & Ozaki, Y. (2012). Compression effect on sustained-release and water absorption properties of cellulose tablets studied by heterospectral two-dimensional (2D) correlation analysis. Analytical Methods, 4(6), 1530-1537.
18.Threlfall, T. L. & Chalmers, J. M. (Eds.). (2002) Handbook of Vibrational Spectroscopy, vol. 5. John Wiley & Sons., p.423–435.
19. Andrews, D. L. (Ed.). (2009) Encyclopedia of Applied Spectroscopy, John Wiley &
Sons., p.872-886.
Spectroscopy, vol. 1. John Wiley & Sons., p.383–392.
21.Threlfall, T. L. & Chalmers, J. M. (Eds.). (2002) Handbook of Vibrational Spectroscopy, vol. 1. John Wiley & Sons., p.393–417.
22. Ozaki, Y. (2012). Near-infrared spectroscopy—its versatility in analytical chemistry.
Analytical Sciences, 28(6), 545-563.
23. Murayama, K., Genkawa, T., Ishikawa, D., Komiyama, M., & Ozaki, Y. (2013). A polychromator-type near-infrared spectrometer with a high-sensitivity and
high-resolution photodiode array detector for pharmaceutical process monitoring on the millisecond time scale. Review of Scientific Instruments, 84(2), 023104.
24. Ishikawa, D., Shinzawa, H., Genkawa, T., Kazarian, S. G., & Ozaki, Y. (2014). Recent Progress of Near-Infrared (NIR) Imaging—Development of Novel
Instruments and Their Applicability for Practical Situations—. Analytical Sciences, 30(1), 143-150.
25. Ishikawa, D., Murayama, K., Awa, K., Genkawa, T., Komiyama, M., Kazarian, S. G., & Ozaki, Y. (2013). Application of a newly developed portable NIR imaging device to monitor the dissolution process of tablets. Analytical and bioanalytical
chemistry, 405(29), 9401-9409.
(2015). Image Monitoring of Pharmaceutical Blending Processes and the
Determination of an End Point by Using a Portable Near-Infrared Imaging Device Based on a Polychromator-Type Near-Infrared Spectrometer with a High-speed and High-Resolution Photo Diode Array Detector. Molecules, 20(3), 4007-4019.
27. Ishikawa, D., Genkawa, T., Murayama, K., Komiyama, M., & Ozaki, Y. (2014). Feasibility study of diffuse reflectance and transmittance near infrared spectroscopy for rapid analysis of ascorbic acid concentration in bilayer tablets using a high-speed polychromator-type spectrometer. Journal of Near Infrared
Spectroscopy, 22(3), 189-198.
28. Murayama, K., Ishikawa, D., Genkawa, T., & Ozaki, Y. (2017). An application for the quantitative analysis of pharmaceutical tablets using a rapid switching system between a near-infrared spectrometer and a portable near-infrared imaging system equipped with fiber optics. to submitted Applied Spectroscopy
Table 1 Table of the features of each spectroscopic method Fourier-transform Poly-chromator Mono-chromator AOTF Laser-scan Scan speed △ ◎ △ 〇 ◎ Spectral range ◎ 〇 ◎ 〇 × Spectral accuracy ◎ 〇 〇 〇 〇 Spectral resolution ◎ △(〇) ◎ △ ◎◎ Signal dynamic-range 〇~△ 〇 ◎ 〇~△ ◎ Device dimension 〇~△ ◎ △ 〇 ◎ Optical efficiency ◎ ◎ △ × ◎ Robustness △ ◎ △ ◎ ◎
Figure 2 (a) In-line type NIR spectrometer, (b) diffuse reflectance optical fiber probe and (c) spectro-engine of P-NIRs
(a)
(b)
Figure 3 Portable NIR imaging device and in-line NIR spectrometer: (a) in-line type NIR spectrometer, (b) portable NIR imaging device, (c) control box for NIR imaging device and (d) sample stage
Chapter 1
A Polychromator-Type Near-Infrared
Spectrometer with a High-Sensitivity and
High-Resolution Photodiode Array Detector for
Pharmaceutical Process Monitoring on the
Millisecond Time Scale
Abstract
In the fine chemicals industry, particularly in the pharmaceutical industry, advanced sensing technologies have recently begun being incorporated into the process line in order to improve safety and quality in accordance with PAT. For estimating the quality of powders without preparation during drug formulation, near-infrared (NIR) spectroscopy has been considered the most promising sensing approach. In this study, a compact polychromator-type NIR spectrometer equipped with a photodiode (PD) array detector was developed. This detector is consisting of 640 InGaAs-PD elements with 20 µm pitch. Some high-specification spectrometers which use InGaAs-PD with 512 elements have a wavelength resolution of about 1.56 nm when covering 900–1700 nm range. On the other hand, the newly developed detector, having the PD with one of the world’s highest density, enables wavelength resolution of below 1.25 nm. Moreover, thanks to the combination with a highly-integrated charge amplifier array circuit, measurement speed of the detector is higher by two orders than that of existing PD array detectors. The developed spectrometer is small (120 mm × 220 mm × 200 mm) and light (6 kg), and it contains various key devices including the high-density and high-sensitivity PD array detector, NIR technology and spectroscopy technology for a spectroscopic analyzer that has the required detection mechanism and high sensitivity for powder measurement, as
well as a high-speed measuring function for blenders. Moreover, the characteristics of the developed NIR spectrometer were evaluated, and the measurement of powder samples confirmed that it has high functionality.
1.
Introduction
In the pharmaceutical industry, at a worldwide level, the development and approval of new drugs is increasingly being governed by common regulations. In this scenario, there has emerged the need for a quality assurance method with a strong scientific basis. To satisfy this need, the U. S. Food and Drug Administration proposed process analytical technology (PAT) for the design, analysis, and control of pharmaceutical manufacturing processes through the timely measurement of the critical process parameters that affect the final product quality. This technique is expected to replace conventional validation techniques and realize improved manufacturing efficiency and quality control of pharmaceuticals.1–4
PAT is used to analyze the manufacturing process, determine the factors essential for understanding the manufacturing process, and clarify variable factors that affect quality control. At the same time, it is important to improve the manufacturing process based on the results of PAT. From these viewpoint, real-time measurement is essential. Toward this end, spectroscopy, in particular, near-infrared (NIR) spectroscopy, has attracted considerable interest because it affords several advantages such as noncontact and nondestructive measurements and availability of remote detection by optical fiber.5–10
obtains the spectrum by the Fourier transform of interference signal data acquired while changing the optical path length.7 It needs a wavelength standard, and therefore, it has very high wavelength accuracy. Moreover, in principle, it has superior optical throughput. Finally, various improvements have recently been made to the drive mechanism of the variable optical length, data processing, and so on. The monochromator-type spectroscopic method is also widely used in NIR spectrometers; this method is a wavelength dispersion method.8 In this method, the wavelength is continuously swept by changing the angle of the diffraction grating. The advantages of this method are the high dynamic range and high wavelength resolution. However, it does have some disadvantages, such as the long measurement time, large size, and lack of robustness owing to the wavelength being swept mechanically. The laser-scanning-type method is used to sweep the emission wavelength by varying the current or the external cavity. Although the measurement wavelength area is limited to the range of laser emission, this method has advantageous features such as high dynamic range and high wavelength resolution. In this method, multiple lasers with different emission wavelength regions are required to cover the measured NIR wavelength region. The method which uses a polychromator employs a spatial wavelength dispersion device, and it enables detection over a wavelength region by using a multichannel detector. Unlike in the
monochromator-type method, this method simultaneously detects multiple beams over a wavelength region. The number of channels in the multichannel detector determines the wavelength resolution. This method has advantageous features such as high-speed measurement, robustness, and compactness owing to the non-mechanical moving architecture.9
These methods involve specific advantages and disadvantages, and it is necessary to select one that is most suitable for use as an in-line analyzer. Generally speaking, this PAT application requires features such as high-speed measurement, compact size, and maintainability (if possible, maintenance-free). The polychromator-type method provides these features; however, its wavelength resolution is inferior to that of other methods. If the wavelength resolution of this method could be improved, it would become the best method for in-line spectroscopy. To improve the wavelength resolution of this method, it is necessary to increase the pixel number of the photodiode array (PDA);10 the pixel number of PDA also determines the PDA device size. The spectrometer size increases in proportional to the PDA device size. In other words, both wavelength resolution improvement and device miniaturization can be achieved by increasing the pixel number and density of PDA.
high-density array with a charge-amplifier-array-type integrated circuit (IC). It holds PDA with one of the world’s highest density (20-µm pitch) and unusual high speed (~10 ms). This novel detector has allowed us to improve the wavelength resolution and detection sensitivity of the polychromator-type NIR spectrometer (P-NIRs). We have designed a new P-NIRs using this PDA as well as an improved optical probe to improve the sensitivity. The wavelength resolution and sensitivity of the P-NIRs were evaluated through the measurement of a powder sample, and its applicability to an in-line monitoring process was examined through the measurement of a powder mixture process.
2.
Development of High-density and High-sensitivity PDA Detector
2.1
High-density PDAThe detector consists of a high-density PDA containing 640 elements with 20µm pitch. InGaAs photodiodes with a wavelength sensitivity of 900–1700 nm (photoreceptive sensitivity: 0.8 at 1550 nm) are used. The wavelength resolution of the NIR spectrometer which uses the new PDA with 640 elements is 60% higher than that of a conventional high-specification NIR spectrometer that has a PDA with 256 elements. If a measurement wavelength region is 900–1700 nm, the wavelength resolution is 3.1 nm for a spectrometer with a PDA having 256 elements while it is 1.25
nm for that with the 640 elements. Figure 1-1 shows a diagram of a part of the newly developed PDA. This is a PN-junction-type PDA. The substrate structure of the photodiode is formed by growing an InGaAs optical absorption layer on an InP-based substrate by epitaxial growth and then growing an InP cap layer on the InGaAs optical absorption layer. Moreover, an InP buffer layer is formed between the InP substrate and the InGaAs photoabsorption layer. An SiO2 mask pattern is formed in order to form the
640-element PDA with 20 µm pitch and 10 µm photoreceptive width on the substrate. Zn is diffused into the obtained substrate to form a high-density PN-junction-type PDA. The PDA converts the energy of incident light into a photocurrent. The photocurrent is output to the outside with a metallic pad. The PDA may suffer from fluctuations in the current output owing to light energy entering between two adjacent PDs. To prevent these fluctuations and to improve sensitivity, an optical cover material was placed between adjacent PDs.11-13 Figure 1-1 shows a chart of the electrode pattern of the PDA. The 640 elements in the PDA are divided into two sets of 320 elements based on whether the pixel number is even or odd. Moreover, the bonding pads are arranged in a staggered manner with a two-step arrangement. In this manner, the array density could be increased.
2.2
Charge Amplifier Array Silicon Integrated CircuitA charge-amplifier-array-type Si-IC that amplifies the photocurrent converted by the 640-element PDA was also newly developed. Figure 1-2 shows a block diagram of the charge-amplifier-array-type Si-IC. It consists of a 320-element charge amplifier array that is highly integrated to match with a PDA with world top class density, a sample hold circuit, a shift register circuit, and a timing generator circuit. A photocurrent from the photodiodes charges the integral capacitor, and the electric charge is converted into a voltage by the charge amplifier. The output voltage can be calculated by Eq. (1).
(
)
f c d s sC
T
I
I
V
=
+
⋅
(1)where, Vs [V], Is [A], Id [A], Tc [s], and Cf [F] indicate the output voltage, signal current,
dark current, charge time, and integral capacitance, respectively.
The charge amplifier can maintain a high dynamic range by having, and selecting two integral capacitors (that have value of 0.5 pF and 10 pF). All elements of the charge amplifier array work completely at the same time by the clock synchronous method that is controlled by the timing generator circuit. The charge time is controlled based on the external input pulse width. The signal of each element after charging was completed is held by the sample hold circuit, following which each signal is read one-by-one by the
shift register circuit at high speed. The bonding pad arrangement of the charge-amplifier-array type Si-IC is the same as that of the PDA.
Existing PDAs individually acquire the photocurrent signal converted by each element by using an external amplifier, and therefore, they require a measurement time of sub-seconds to detect the signal level. In contrast, the newly developed PDA acquires the photocurrent signal converted by each element simultaneously using the charge-amplifier-array-type Si-IC, and therefore, it requires a measurement time of less than 10 ms.
2.3
Photodiode Array DetectorFigure 1-3 shows the newly developed photodiode array sensor. An AlN substrate was selected owing to its good heat conduction and other features. At its center, it contains 640 InGaAs photodiode elements with 20-µm pitch, which we believe to be the highest density reported thus far in the world, on both sides of the substrate, and the newly developed charge-amplifier-array-type Si-IC is mounted on top of this. The substrate is mounted on a ceramic package via a thermoelectric cooler and is sealed with a cap with a sapphire window after filling with N2.
evaluated. The light receiving surface was shaded, and 100 measurements were carried out with an operation temperature of 25 °C, charge time of 10 ms, and integral capacitance of 0.5 pF. The root mean square noise voltage (Vrms) of each pixel was
calculated from the measured data, and the root mean square noise current (Irms) of each
pixel was calculated by Eq. (1). Figure 1-4 shows a plot of the root mean square noise current of each pixel. The root mean square noise current of each pixel in the PDA was less than 0.03 pA. Moreover, the noise equivalent power (NEP) was calculated by Eq. (2).
S
I
rmsNEP
=
(2)where, the photoreceptive sensitivity S is 0.8 A/W at 1550 nm. In all pixels, NEP was less than 0.0375 pW, demonstrating that the newly developed PDA can detect even a feeble light.
3.
Design of NIR Spectrometer
3.1
Development of Polychromator-type NIR SpectrometerIn the present study, we developed two types of P-NIRs: one with an optical fiber interface (FIF) model with a diffuse reflectance (DR) optical fiber probe for remote measurement, and the other with a direct interface (DIF) model with a built-in DR optical fiber probe. Figures 1-5 and 1-6 show the FIF and DIF, respectively. Both
P-NIRs consists of a polychromator equipped with a PDA detector, an internal optical source (halogen lamp, power consumption 5 W), an 18-bit analog to digital (AD) convertor for signal conversion and CPU, a data interface, a power supply (battery and external source), and a DR optical fiber probe. The optical fiber for irradiating light is connected with a built-in optical source, and the optical fiber for receiving light diffuse-reflected from a sample is connected with the spectrometer. Figure 1-7 shows a schematic diagram of the P-NIRs spectroscopy system, and Table 1-1 summarises the specifications of this system. A halogen lamp is used to irradiate the samples with NIR light through the optical fiber. The optical fiber comprises a bundle of ~100 optical fibers with a core diameter of 190 µm. The DR light enters the spectrometer through the optical fiber, and it is dispersed by the diffraction grating device. The dispersed light is irradiated on the PDA by a condensing lens. The PDA output is converted by the 18-bit AD converter and the CPU carries out calculation processes such as the averaging on it. Thereafter, the data sent to a control computer as spectrum data.
The targeted measurement performance of the P-NIRs is inspection of the process line in 10 ms. Toward this end, the P-NIRs employs a high-speed AD converter (1×10⁶ samples/s), a digital signal processor, and parallel processing of data. Separately, the P-NIRs has functions such as the wireless data interface, battery operation, and external
synchronous sampling of data. The P-NIRs is controlled by a control computer through a serial or a wireless communication protocol. The P-NIRs receives instructions (control commands) from the control computer, and executes the spectral measurement, process data, and transfer data. The absorption spectrum is displayed and saved on the control computer.
3.2
Spectro-engine of P-NIRsFigure 1-8 shows the spectro-engine of P-NIRs. The light diffuse reflected from a sample is collimated by the collimator lens, and collimated light enters the diffraction grating. The light is diffracted into beams of each wavelength. The light is focused onto the pixels of the PDA by using a focusing lens in conjunction with a mirror. The intensity of the beams of each wavelength is detected by the PDA, and the spectral data are obtained through signal processing.
3.3
Diffuse Reflectance Optical Fiber Probe for High SensitivityIn the present study, a DR optical fiber probe was also newly developed for convenient and sensitive spectral measurement. This optical fiber probe consists of the condensing lens and the optical fiber bundle. The lens condenses the irradiating light and
the light diffuse-reflected from the sample. By changing the focusing distance of the condensing lens, one can flexibly vary the working distance between the probe and the sample. The optical fiber bundle is an assembly of optical fibers that transmits the irradiating and diffuse reflection lights. The optical fiber bundle is bunched together at one end, and it is separated into the optical fibers for the irradiating light and the optical fiber for the diffuse reflection light at the other end.
The irradiating light intensity increases as the caliber of optical fiber increases, and the detection property improves, on one hand it also leads to an increase in the mechanical fragility. The optical fiber bundle was selected and the composition was examined, to achieve a certain mechanical strength, a sufficient light intensity and a high optical wavelength resolution. One of the best solution to achieve this is the combination of the multimode fiber for detection and a large number of high numerical aperture, small diameter, optical fibers for irradiation. About 100 optical fibers of its guiding diameter of 200mm allowed us to realize a certain mechanical strength, adequate diameter and a high efficiency.
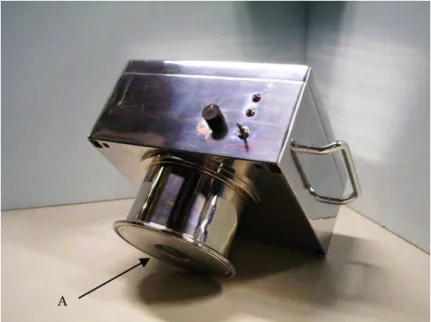
A DIF model spectrometer was developed that has a built-in DR probe shown in Fig. 6, for the direct installation to a rotation blender the DIF model has a three-axis accelerometer to detect its posture, wireless data interface and lithium ion batteries.
4.
Experimental
4.1
Evaluation of Wavelength ResolutionTo demonstrate importance of the wavelength resolution and detection sensitivity of P-NIRs, the DR-NIR spectra of talc (Mg3Si4O4 (OH)2, Kanto Chemical Co., Inc.) was
measured by using the DR optical fiber probe (FIF model). The distance between the probe and the talc powder was approximately 50 mm, the sampling time was 30 ms, and averaged spectrum calculated from 10 spectra was obtained; the total acquisition time for one spectrum was 0.3 s. Moreover, a halogen lamp (5 W) was used as the light source.
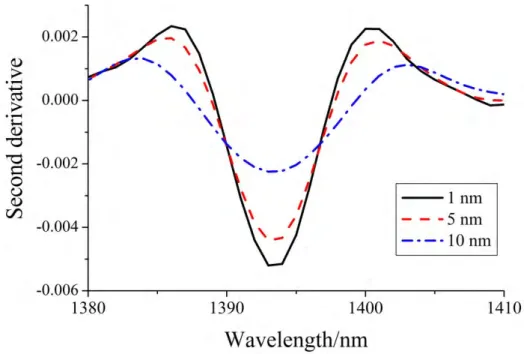
The NIR spectra generally have two major drawbacks: band overlaps are severe and the baseline fluctuation of the spectra is often considerable. The second-derivative pretreatment of the spectra is essential for overcoming these problems. If the wavelength resolution of an obtained NIR spectrum is low, it is difficult to separate overlapping bands because the spectrum is distorted. Therefore, the band separation result by the second-derivative pretreatment is also affected by the wavelength resolution. Thus, we have assumed that one can evaluate the wavelength resolution by calculating the second derivative of the spectrum.
To evaluate the wavelength resolution of P-NIRs, that of the NIR spectrum obtained with a 1 nm wavelength resolution was decreased to 5 and 10 nm by the simple moving average method. These spectra were subjected to the second-derivative treatment by the Savitzky-Golay method (smoothing point: 11 point).14
4.2
Blending Monitoring TestTo evaluate the high speed performance of P-NIRs, we measured the dynamic mixture spectra of talc and D-mannitol (HOCH2 (CHOH)4 CH2OH, Kanto Chemical Co.,
Inc.) during rotation mixing with the DIF model of P-NIRs. Monitoring powder blending process by using NIR spectroscopy has been investigated,15-17 because it is highly desired to detect the homogeneity of mixed powder. The outline of the blending test setup is shown in Figure 1-9. When DR method is used to measure a spectrum, it is highly desirable to keep an irradiation distance constant, however powder under mixing always moves and the irradiation distance changes largely during spectral measurement. Therefore, high speed is highly requested for the NIR spectral measurement in blending process.
The 2-L glass bottle is connected with the clump ferrule of the DIF model of P-NIRs. The center of rotation is in the connected part, and the rotation speed is 12 rpm. First, a
300 g of talc was put into the glass bottle, and then, a 700 g of D-mannitol was added on the talc sample. When P-NIRs is in the bottom position the mixture sample in the bottle reaches the optical window (sapphire), so this timing is adopted as a measurement point. The spectral measurement is performed by detecting the measuring points by the built-in three-axis accelerometer during rotation. The sampling time was 30 ms, and averaged spectrum calculated from 30 spectra was obtained; the total acquisition time for one spectrum was 0.9 s. The light source is a halogen lamp of only 5 W.
5.
Results and Discussion
5.1
Change in Spectral Shape in the Second Derivative Spectra with Differencein Wavelength Resolution
Figure 1-10 shows the second-derivative spectra of talc with wavelength resolution of 1, 5, and 10 nm. It yields a sharp peak at 1392 nm owing to the first overtone stretching mode of the OH group.18 The second-derivative spectrum with 1-nm wavelength resolution measured by P-NIRs shows a narrow band shape, but the second-derivative spectrum with 5 nm and 10 nm wavelength resolution show a broad band shape. Moreover, in the second-derivative spectrum with 10 nm wavelength resolution, the peak intensity decreased to one half of that of obtained with 1-nm wavelength resolution.
It has been found that the low wavelength resolution exerts a large influence on the band separation performance. Thus, it has been confirmed that high wavelength resolution is very effective for the band separation in certain application. And, it has been shown that the wavelength resolution of the newly developed P-NIRs is sufficiently high. In general, NIR spectral measurements do not require as high a spectral resolution as that required by IR and Raman spectral measurements. However, in the case of pharmaceutical applications high wavelength resolution is needed because pharmaceutical industry requests high precision analysis and high precision discrimination of raw materials. Moreover, DR method often needs a pretreatment such as second derivative, where wavelength resolution controls analysis performance as shown in Figure 1-10. Therefore, NIR spectrometers for PAT should have high wavelength resolution, and P-NIRs is equipped with a high wavelength resolution required for PAT application.
5.2
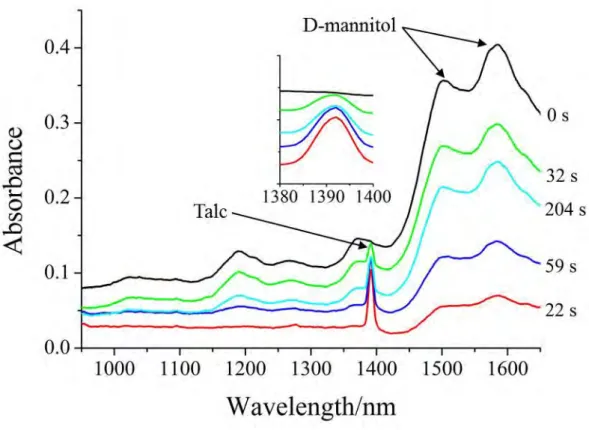
Blending Process Monitoring Test of the Modeling TabletFigure 1-11 shows some DR-NIR spectra of the D-mannitol and talc mixture, measured during rotation mixing. Because of high speed of P-NIRs, we could obtain spectral data at each rotation. The spectrum at 0 s reflects D-mannitol only, and the
bands at 1495 and 1580 nm are owing to the first overtones of the OH and CH stretching vibration modes. As spectral variations during rotation mixing, both the change in spectral shape and the baseline drift were observed. In general, baseline drift in DR-NIR spectra during powder mixing is mainly caused by the mean particle size and surface condition. Therefore, it is considered that the baseline fluctuation reflects change in the mean particle size of mixture powder at the irradiated area.
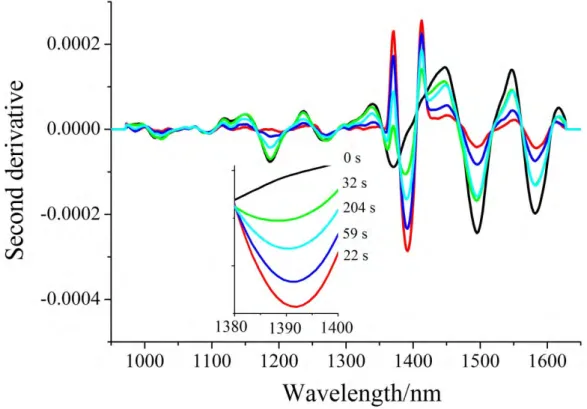
Figure 1-12 shows the second-derivative of the spectra shown in Figure 11. These spectra were subjected to the second-derivative treatment by the Savitzky-Golay method (smoothing point: 31 point). In the original spectra baseline changed largely, while in the second-derivative spectra were observed relative intensity changes between the band at 1392 nm due to talc and those at 1495, 1580 nm arising from D-mannitol. After the mixing for 200 s, the variation of the baseline of the original spectra converged. Also, the variation of second-derivative of 1392, 1495 and 1580 nm converged.
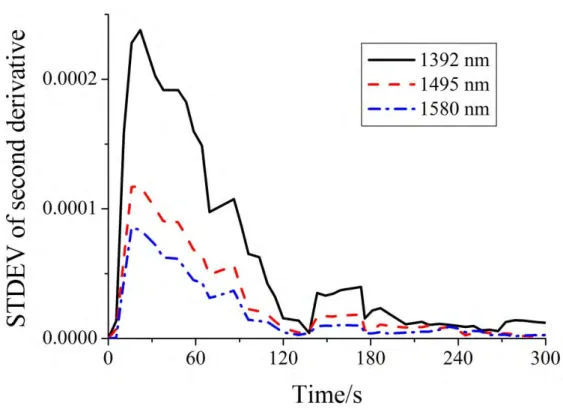
Figure 1-13 shows a plot of a 5 point moving block standard deviation of peak intensities at 1392, 1495, and 1580 nm in the second-derivative spectra versus time. During the initial stage of mixing, the power sample in the bottle is inhomogeneous, and therefore, the spectra, in which bands mainly due to either D-mannitol or talc are dominant, are detected at every measurement, causing a high standard deviation value.
As mixing proceeds, the sample becomes homogeneous; then, the spectra of the mixtures of D-mannitol and talc as the mixing ratio are detected, and thus, the variation of absorbance decreases, yielding a low standard deviation value. The results shown in Fig. 13 that the standard deviation gives a constant value of 200 s after the start of rotation mixing. Thus, it is very likely that the sample in the bottle becomes homogeneous after 200 s. The sample homogeneity was confirmed by an existing method carried out for a sample taken from a bottle by offline measurement, and it is found that the developed P-NIRs enables in-line monitoring of mixing samples. These results demonstrate that this P-NIRs has high speed and sufficiently compact for realizing in-line monitoring in pharmaceutical processes.
6.
Conclusion
We have developed one of the world’s highest density and high-sensitivity array detector to realize a compact, high-resolution, high-sensitivity, and high-speed polychromator-type NIR spectrometer. The P-NIRs shows improved wavelength resolution and high sensitivity by the use of the newly developed PDA detector with 640 elements. Existing NIR spectrometers have PDA detector with at most 512 elements, and thus their wavelength resolution is at best 1.56 nm. However, the developed novel
PDA detector has allowed one to reach wavelength resolution of 1.25 nm or even better. Moreover, the combined use of the PDA detector with the developed charge-amplifier array has shortened the measurement time from ca. 3 s to below 10 ms.
Through a mechanical investigation and prototyping of a remote DR detection mechanism required for in-line monitoring of the pharmaceutical process, introduction of high-speed data processing, and addition of functions such as a wireless interface, we have developed a prototype model of a high-speed spectrometer for in-line use and confirmed its performance. In PAT, where one must monitor timely quality parameters and functional properties of pharmaceuticals during their manufacturing process, P-NIRs having high speed is a very suitable NIR spectrometer. Moreover, because of its small size, it is very easy to set it up at various pharmaceutical process lines. We have confirmed that P-NIRs have achieved high speed, high sensitivity and high resolution by measuring the DR-NIR spectra of D-mannitol and talc in the powder state.. Moreover, we have shown that P-NIRs can be used to evaluate the homogeneity of the mixed powder samples through the in-line monitoring of the mixed states of the powder samples.
7.
References
1. U.S. Food Drug AdministrationDA, Guidance for Industry, PAT: A Framework for
Innovative Pharmaceutical Development, Manufacturing, and Quality Assurance
(U.S. Food and Drug Administration, Maryland, 2004).
2. K. A. Bakeev, Process Analytical Technology (Blackwell publishing Ltd., Oxford, 2005), p.13-38.
3. Y. Ozaki and T. Amari, Near-Infrared Spectroscopy in Chemical Process Analysis (Sheffield Academic Press, Sheffield, 2000), p.53-95.
4. T. L. Threlfall and J. M. Chalmers, Handbook of Vibrational Spectroscopy, vol. 5 (John Wiley & Sons, New York, 2002), p.423–435.
5. U. Hoffmann and N. Zanier-Szydlowski, J. Near Infrared Spectrosc. 7, 33 (1999). 6. Y. Wu, Y. Jin, Y. Li, D. Sun, X. Liu, and Y. Chen, Vib. Spectrosc.58, 109 (2012). 7. Y. Ozaki and S. Morita, Encyclopedia of Applied Spectroscopy (John Wiley & Sons,
Weinheim, 2009), p.872-886.
8. F. A. DeThomas and P. J. Brimmer, Handbook of Vibrational Spectroscopy, vol. 1 (John Wiley & Sons, New York, 2002), p.383–392.
9. E. W. Stark, Handbook of Vibrational Spectroscopy, vol. 1 ( John Wiley & Sons, New York, 2002), p.393–417.
10. Y. Ozaki, Anal. Sci., 28, 545 (2012).
11. K. Sakakibara, Y. Sanpei, and A. Miura, Japan Patent 4165785 (Aug. 8, 2008). 12. M. Wada, and K. Sakakibara, Japan Patent Kokai 2002-319696 (Oct. 31, 2002). 13. M. Komiyama, Y. Sanpei, A. Miura, K. Sakakibara, T. Yakihara, T. Fujita, S.
Kobayashi, S. Oka and Y. Akasaka, USPatent 6,552,325 B1 (Apr. 22, 2003). 14. A. Savitky and M. J. E. Golay, Anal. Chem. 36, 1627 (1964).
15. S. S. Sekulic, H. W. Ward, II, D. R. Brannegan, E. D. Stanley, C. L. Evans, S. T. Sciavolino, P. A. Hailey, and P. K. Aldridge, Anal. Chem. 68, 509 (1996).
16. O. Berntsson, L. -G. Danielsson, B. Lagerholm, and S. Folestad, Powder Technol.
123, 185 (2002).
17. Y. Roggo, P. Chalus, L. Maurer, C. Lema-Martinez, A. Edmond, and N. Jent, J. Pharmaceut. Biomed. Anal. 44, 683 (2007).
18. S. Petit, A. Decarreau, F. Martin, and R. Buchet, Phys. Chem. Miner. 31, 585 (2004).
Figure 1-2 Block diagram of PDA: (A) 320-element charge amplifier array, (B) sample hold circuit, (C) shift registor circuit, and (D) timing generator circuit.
Figure 1-6 Direct interface model of P-NIRs. (A) Optical window through which the irradiating and the diffuse reflected light are transmitted.
Figure 1-7 Spectroscopic analyzer configuration: (A) spectroscope with a PDA detector, (B) internal optical source, (C) 18-bit analog/digital convertor for signal conversion and CPU, (D) data interface, (E) power supply (battery and external source), and (F) optical fiber probe.
Table 1-1 Specification of P-NIRs
Item Fiber-Interface model Direct-Interface model Spectral range 900 ‒ 1700 nm
Wavelength resolution 1.25 nm Wavelength accuracy < 0.1 nm Absorbance noise level < 0.1 mAbs.
Sampling time Min. 1 ms/spectrum Measurement interval Min. 10 ms Number of PD elements 640 elements
Optical interface Optical fiber input Direct: through an optical window
Data interface Serial communication: RS232C, USB Wireless LAN: 802.11b
Size 120 mm×220 mm×200 mm 160 mm×220 mm×200 mm Weight < 6 kg < 7 kg
Power supply AC / DC, battery Typ. 15 W Operating temperature +5 – 45ºC
Figure 1-8 Spectro-engine of P-NIRs: (A) collimator lens, (B) diffraction grating, (C)
Figure 1-13 Plots for standard deviation of the second-derivative absorbance at 1392, 1495, and 1580 nm versus time.
Chapter 2
Feasibility Study of Diffuse Reflectance and
Transmittance Near-Infrared Spectroscopy for
Rapid Analysis of Ascorbic-Acid Concentration
in Bilayer Tablets using High-speed
Polychromator-type Spectrometer
Abstract
Feasibility of real-time release testing of bilayer tablets was investigated using near-infrared (NIR) spectroscopy. The newly developed polychromator-type NIR spectrometer was used to compare the diffuse reflectance (DR) and transmittance (Tr) NIR spectroscopic techniques. This spectrometer not only performs highly sensitive NIR measurements but also affords the NIR spectra of an intact tablet in a millisecond (ms)-time scale; i.e., 500 ms for the DR-NIR measurements and 400 ms for the Tr-NIR measurements. The bilayer tablets were prepared with the first layer comprising 0–10% ascorbic acid (AsA), 20% corn starch, 5% talc, 30% microcrystalline cellulose, and 45– 35% lactose, and second layer comprising 20% corn starch, 5% talc, 30% microcrystalline cellulose, and 45% lactose; their DR- and Tr-NIR spectra were acquired from both the sides of the tablet. With the help of the obtained spectra, the feasibility of DR- and Tr-NIR spectroscopy for the quantitative analysis of AsA in the bilayer tablets was compared. The DR- and Tr-NIR spectra of the bilayer tablets and their second derivative spectra were studied. The AsA bands were not identified in the DR- and Tr-NIR spectra. However, the AsA bands at 995 and 1458 nm were observed in the second-derivative spectra. All the developed regression models predicted the AsA concentration and regression vectors indicated that the prediction was based on the AsA
bands. In addition, the model using the Tr-NIR spectra could predict the AsA concentration, even when the bilayer tablet was flipped.
1.
Introduction
Since the introduction of process analytical technology (PAT) by the United States Food and Drug Administration,1 near-infrared (NIR) spectroscopy has been attracting attention as a powerful PAT tool.2-5 The advantages of NIR spectroscopy, such as nondestructive and in situ analysis and analysis using an optic fiber,5 are suitable for the implementation of NIR measurements in industrial plants. Owing to the increased focus on NIR spectroscopy, novel and unique NIR spectrometers and their applications in PAT have been developed recently.6-11 Genkawa et al. developed an online NIR and mid-infrared (online NIR/mid-IR) dual-region spectrometer, which enables the sequential acquisition of the NIR and mid-IR spectra (10,000–1200 cm-1).6 Monitoring of fermentation processes and band assignment of water and liquid oleic acid were performed with the online NIR/mid-IR spectrometer.6,7 Murayama et al. developed a high-sensitivity and high-resolution photodiode array (PDA) detector and a high-speed polychromator-type NIR spectrometer (P-NIRs).8 Ishikawa et al. combined an imaging unit with the P-NIRs for the development of a compact NIR-imaging device with high speed and high portability (D-NIRs).9,10
In this study, the rapid analysis of ascorbic acid (AsA) concentration in a bilayer tablet was investigated using P-NIRs. The P-NIRs was used to investigate the feasibility
of the real-time tablet release, namely 100% inspection, during the tablet-making process, which is one of the most important goals of PAT using NIR spectroscopy.
Extensive research has been conducted on the qualitative and quantitative analyses of active pharmaceutical ingredients (APIs) in intact tablets using NIR spectroscopy.11-28 The advantages of diffuse reflectance (DR) and transmittance (Tr) spectral-acquisition methods were reported.18-25 The advantages and disadvantages of both the methods are summarized as follows: The DR-NIR method is robust against sample positioning errors, which is advantageous for online NIR measurements. For the analysis of tablets, the DR-NIR spectra allows the utilization of a wide region of wavelength, while the spectral range with wavelengths greater than 1400 nm are unavailable in the Tr-NIR spectra. On the other hand, the Tr-NIR spectra reveal information about the entire tablet, whereas the DR-NIR spectra reveal information only about limited regions on the tablet surface. At low API concentrations, the prediction precision of the Tr-NIR method is better than that of the DR-NIR method.
Hence, the DR- or Tr-NIR method can be chosen based on the distribution of analytes in the tablet. For example, the DR-NIR method is desirable when the API is homogeneously distributed in the tablet. On the other hand, the Tr-NIR method may be applied when the API is heterogeneously distributed in the tablet such as a bilayer tablet.