Characterization of the SlHSP70-1 Functions by
Gene-to-gene Co-expression Analysis to Uncover
Relationships of SlHSP70-1, SlIAA9 and SlDELLA
in the Tomato Correlation Networks
著者(英)
TUAN NAM VU
year
2019
その他のタイトル
トマト相関ネットワーク内のSlHSP70-1、SlIAA9お
よびSlDELLAにおける相関関係に着目した遺伝子間
共発現解析によるSlHSP70-1の機能解析
学位授与大学
筑波大学 (University of Tsukuba)
学位授与年度
2019
報告番号
12102甲第9281号
URL
http://doi.org/10.15068/00158019
i
Characterization of the SlHSP70-1 Functions by Gene-to-gene Co-expression Analysis to Uncover Relationships of SlHSP70-1, SlIAA9 and SlDELLA in the
Tomato Correlation Networks
July 2019
i
Characterization of the SlHSP70-1 Functions by Gene-to-gene Co-expression Analysis to Uncover Relationships of SlHSP70-1, SlIAA9 and SlDELLA in the
Tomato Correlation Networks
A Dissertation Submitted to
the Graduate School of Life and Environmental Sciences, the University of Tsukuba
in Partial Fulfillment of the Requirements
for the Degree of Doctor of Philosophy in Agricultural Science (Doctoral Program in Biosphere Resource Science and Technology)
ii
Table of Contents
Abbreviations ... vi
List of Tables ... vii
List of Figures ... viii
Chapter I. General introduction ... 1
1.1. General introduction ... 1
1.1.1. Role of tomato as a vegetable and a model plant ... 1
1.1.2. Improving tomato growth, development and fruit production ... 1
1.1.3. Role of SlIAA9 and SlDELLA genes in tomato growth, development and fruit set . 3 1.1.4. Gene co-expression analysis for tomato growth and development ... 4
1.2. Hypothesis of this study ... 5
1.3. The objective of this study ... 6
Chapter 2. Gene to gene co-expression to discover genes directed connection to SlIAA9 and SlDELLA ... 8
2.1. Introduction ... 8
2.1.1. Role of SlIAA9 and SlDELLA in tomato growth and development including fruit set ... 8
2.1.2. Introduction of the co-expression analysis in gene functions discovery and investigation of tomato ... 9
2.1.3. Objective of this study ... 9
2.2. Materials and methods ... 10
2.2.1. Construction of gene co-expression networks ... 10
2.2.2. Drawing network diagram, GO analysis and distance measurement ... 10
2.3. Results ... 10
2.3.1. Gene-to-gene correlation networks using publicly available microarray data .... 10
iii
2.4. Discussion ... 12
Figure 2. 1. Co-expression network of SlIAA9 neighbouring genes ... 20
Figure 2. 2. Co-expression network of SlDELLA gene neighbouring genes ... 21
Chapter 3. Genome-wide identification, structure characterization, phylogeny and expression patterns of tomato SlHSP70 genes ... 22
3.1. Introduction ... 22
3.1.1. Introduction of heat shock protein HSP70 ... 22
3.1.2. HSP70 genes in plants ... 22
3.1.3. The objectives of this study ... 23
3.2. Materials and methods ... 23
3.2.1. Identification and annotation of SlHSP70 genes in tomato ... 23
3.2.2. Chromosomal localization and prediction of the duplication event of SlHSP70 .. 24
3.2.3. Analysis of the protein features of the SlHSP70 ... 24
3.2.4. Phylogeny tree construction ... 25
3.2.5. Expression analysis of the SlHSP70 genes in different tissues of tomato... 25
3.3. Results ... 25
3.3.1. Molecular characterization of the SlHSP70 genes on the tomato genome ... 25
3.3.2. Chromosomal localization and prediction of the duplication events of SlHSP70 genes ... 26
3.3.3. Phylogenetic analysis-based on amino acid sequences ... 27
3.3.4. Transcript patterns of the SlHSP70 genes in major organs of tomato plants during growth and development ... 28
3.4. Discussion ... 29
Chapter 4: Over expression of SlHSP70-1 gene and phenotypic characterization... 43
4.1. Introduction ... 43
4.1.1. Roles of tomato as a model plant ... 43 4.1.2. Function of SlIAA9 and SlDELLA in tomato growth, development, and fruit set . 43
iv
4.1.3. The objective of this study ... 44
4.2. Materials and Methods ... 45
4.2.1. Plasmid construction and Agrobacterium introduction ... 45
4.2.2. Transformation ... 45
4.2.3. Plant growth conditions ... 46
4.2.4. Genotyping ... 46
4.2.5. RNA isolation and Real-time quantitative PCR analysis ... 46
4.2.6. Phenotyping ... 47
4.2.7. Statistical analysis ... 48
4.3. Results ... 48
4.3.1. SlHSP70-1 gene transformation into tomato plants ... 48
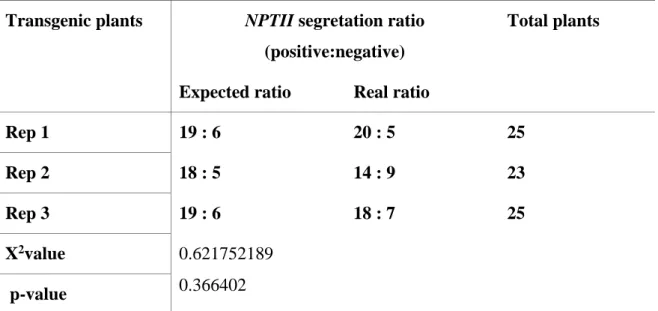
4.3.2. Copy number analysis and homozygous screening transgenic plants for phenotyping ... 48
4.3.3. Over-expression of the SlHSP70-1 promoted tomato internode elongation, but not made effects for leaf phenotypes ... 49
4.3.4. The SlHSP70-1 showed no effects toward fruit set, formation and development .. 50
4.3.5. Relationship analysis of SlIAA9, SlDELLA and SlHSP70-1 ... 51
4.4. Discussion ... 52
Chapter 5. Screening EMS mutations of tomato SlHSP70-1 by TILLING and phenotypic characterization ... 73
5.1. Introduction ... 73
5.1.1. Tomato is a model system for reverse genetics analysis ... 73
5.1.2. Application of TILLING in reverse genetic analysis of tomato ... 74
5.1.3. The objective of this study ... 74
5.2. Materials and methods ... 74
5.2.1. Screening Slhsp70-1 mutant allele by TILLING technology ... 74
v
5.2.3. Genomic DNA Extraction ... 75
5.2.4. Sequencing validation ... 76
5.2.5. Phenotyping ... 76
5.2.6. Statistical analysis ... 76
5.3. Results ... 77
5.3.1. Isolation of the Slhsp70-1 mutants from the mutant population ... 77
5.3.2. Slhsp70-1 mutants were not affected to tomato growth and development ... 77
5.3.3. Slhsp70-1 mutants were not affected to tomato fruit set and enlargement ... 78
5.4. Discussion ... 80
5.4.1. Tomato missense mutant of Slhsp70-1 may be not effective to phenotype changes ... 80
5.4.2. Gene duplication may recover the lost function of a gene ... 81
Chapter 6. General discussion ... 96
Summary ... 100
Acknowledgments ... 102
vi Abbreviations
HSP70 Heat shock protein 70
OE Over Expression
Az Azygous
WT Wild type
MS medium Murashige and Skoog medium
UBQ Ubiquitin
AA Amino acid
TILLING Targeting Induced Local Lesions IN Genome
IAA Indole-3-acetic acid
NBRP National BioResource Project
EMS Ethyl Methane Sulfonate
CDS Coding DNA Sequence
mW Molecular weight
pI Isoelectric point
vii List of Tables
Table 2. 1. List of genes in the nearest neighbouring gene group of SlIAA9 ... 14
Table 2. 2. Nearest neighbour gene group of SlDELLA gene... 16
Table 2. 3. The distance from SlHSP70-1 to SlIAA9 and SlDELLA in their co-expression network ... 17
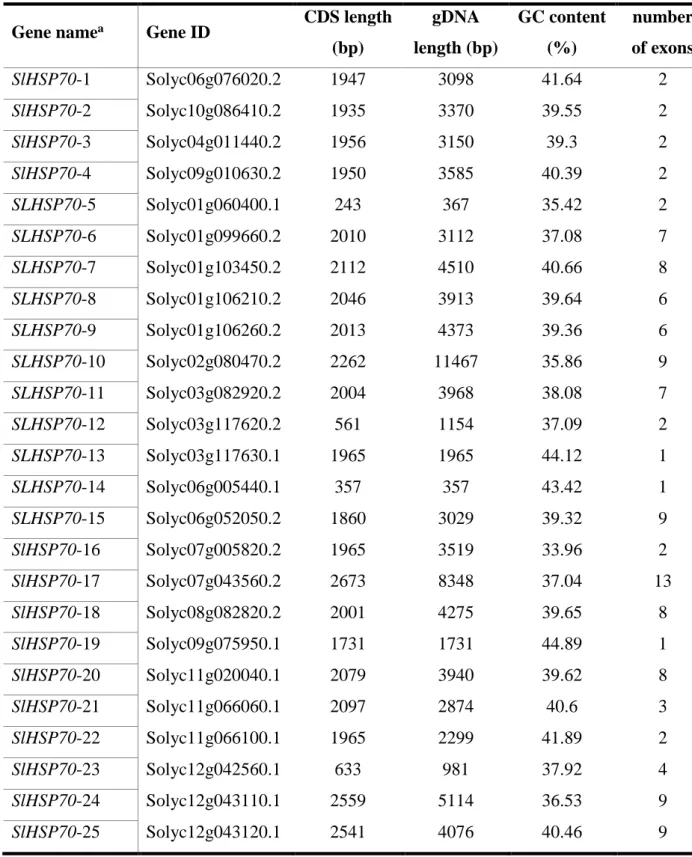
Table 3. 1. List of HSP70 genes identified in tomato genome and their general characteristics ... 32
Table 3. 2. General features of the identified SlHSP70 genes ... 35
Table 3. 3. Protein feature of the identified SlHSP70 amino acids ... 36
Table 3. 4. Prediction of duplication events among the identified SlHSP70 genes in tomato ... 38
Table 4. 1. Primer list for PCR and real time PCR ... 54
Table 4. 2. Segregation of selective gene NPTII in T2 transgenic tomato ... 54
Table 4. 3. Gene expression level of targeted SlHSP70-1 in each tissue of tomato S. lycopersicum M82 and S. pennellii ... 55
Table 5. 1. List of primers for amplifying the HSP70-1 gene in TILLING ... 82
Table 5. 2. List of Slhsp70-1 mutations in TOMATOMA mutant collection database ... 82
Table 5. 3. List of primers for Sanger sequencing validation of HSP70-1 mutations ... 83
viii List of Figures
Figure 2. 1. Co-expression network of SlIAA9 neighbouring genes ... 20
Figure 2. 2. Co-expression network of SlDELLA gene neighbouring genes ... 21
Figure 3. 1. Chromosomal localization of 25 identified SlHSP70 genes in the tomato genome ... 39
Figure 3. 2. Phylogenetic and structural analysis of identified SlHSP70 member’s family in tomato ... 40
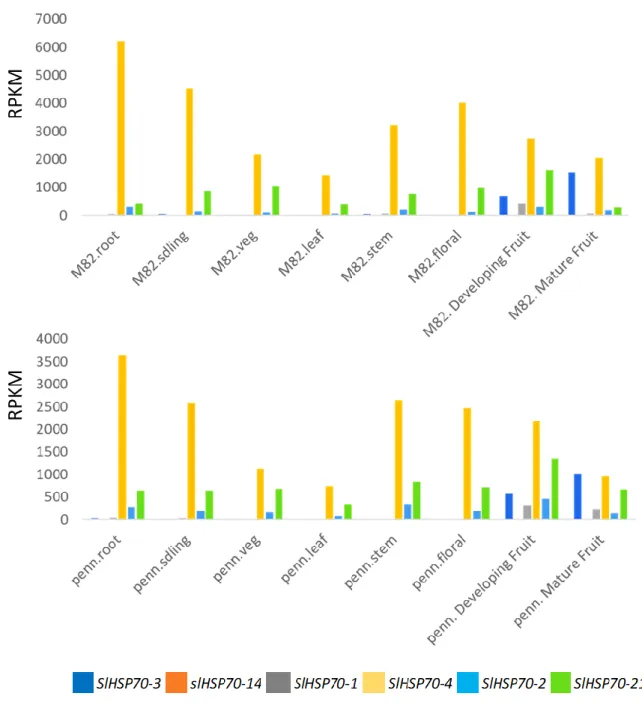
Figure 3. 3. Gene expression level of SlHSP70 genes in each tissues of tomato S. lycopersicum M82 and S. pennelli ... 41
Figure 3. 4. Comparison of expression pattern of SlHSP70-1 and its duplications in HSP70 family gene by tissue of tomato S. lycopersicum var. M82 (A) and S. pennellii (B). ... 42
Figure 4. 1. Vector map of SlHSP70-1 gene transformation into tomato ... 56
Figure 4. 2. Screening positive line of tomato transgenic plants T0 generation ... 57
Figure 4. 3. Flow-cytometer test for polyploid analysis of transgenic tomatoes... 58
Figure 4. 4. Relative expression level of SlHSP70-1 gene in ovaries of T0 generation of transgenic plants. ... 59
Figure 4. 5. Screening of T1 generation of transgenic tomato ... 60
Figure 4. 6. Screening T2 generation of transgenic tomato... 60
Figure 4. 7. The SlHSP70-OE plant S13 ... 61
Figure 4. 8. The SlHSP70-OE plant S10 ... 62
Figure 4. 9. Internode length’s comparison of SlHSP70-OE S13 and WT ... 63
Figure 4. 10. Internode length’s comparison of SlHSP70-OE S10 and WT ... 64
Figure 4. 11. Plant height comparison of SlHSP70-OE, Sliaa9 mutant and WT ... 65
Figure 4. 12. Comparison of leaves description between SlHSP70-OE S13 tomato and WT ... 66
Figure 4. 13. Comparison of leaves description between SlHSP70-OE S10 tomato and WT ... 67
Figure 4.14. Reproductive development of SlHSP70-OE tomato comparing to WT ... 68
Figure 4.15. Fruit development of SlHSP70-OE tomato ... 69
Figure 4.16. Parthenocarpy fruit set capacity of SlHSP70-1-OE transgenic plants……….71
ix
Figure 4. 18. Gene expression level of targeted SlHSP70 in each tissues of tomato S.
lycopersicum M82 and S. pennellii ... 72
Figure 5. 1. TILLING second screening result of SlHSP70-1 mutations from EMS library ... 85
Figure 5.2. TILLING second screening result of SlHSP70-1 mutations from EMS library (continue) ... 86
Figure 5.3. Nucleotide alignment revealed SlHSP70-1 point mutations………...……87
Figure 5.4. Amino acid alignment revealed impact of SlHSP70-1 point mutations ... 88
Figure 5.5. Germination rate of Slhsp70-1 mutant comparing to WT and Az line ... 89
Figure 5.6. Comparison plant height of tomato Slhsp70-1 mutant lines to WT and Az lines ... 90
Figure 5.7. Comparison of leaf morphology of tomato Slhsp70-1 mutant, WT and Az lines ... 91
Figure 5.8. Comparison of first flowering timing between Slhsp70-1 mutant,WT and Az lines ... 92
Figure 5.9. Comparison of flowers number of Slhsp70-1 mutant, WT and Az lines ... 93
Figure 5.10. Comparison of fruit set rate of Slhsp70-1 mutant, WT and Az lines ... 94
1
Chapter I. General introduction
1.1. General introduction
1.1.1. Role of tomato as a vegetable and a model plant
Tomato (Solanum lycopersicum) is a valuable vegetable plant of the Solanaceae family; it is a good source of nutrients because it is rich in vitamins and antioxidants. In addition, its specific flavor makes it a valuable material for the food processing industry (Meissner et al., 1997; Giovannucci, 1999; Chalabi et al., 2004; Etminan et al., 2004; Jian et al., 2005; Consortium, 2012). From a scientific viewpoint, S. lycopersicum is a model organism for studying plant molecular biology as it has a small genome, short life cycle, small body size, and prolific seed production ability. The tomato genome is sequenced as 12 chromosomes with a size of approximately 950 Mb coding for agricultural traits, DNA markers, a large collection of mutants and expressed sequence tags (ESTs) (Tanksley et al., 1992; Menda et al., 2004; Yamamoto et al., 2005). Most recent studies used Micro-Tom, a tomato cultivar that contains most characteristics of a typical model of tomato (Meissner et al., 1997). Tomatoes represent fleshy fruit plants with a complete set of characteristics (from flowering to ripening) that cannot be studied in other model systems such as Arabidopsis or rice (Bertin, 2005; Mintz-Oron et al., 2008). Owing to the large number of species of this family (1000–2000 species), a more detailed understanding of the principle and dynamics of molecular plant physiology can be achieved to help create new valuable traits for vegetable and fruit plants (Aoki et al., 2013).
1.1.2. Improving tomato growth, development and fruit production
Tomatoes are one of the most valuable vegetables that are cultivated and consumed widely in the world. Several cultivation methods have been applied to enhance the growth, development, and fruit production of tomatoes. Based on the physiological characterizations of tomatoes, optimizing farming conditions for tomatoes might be the first alternative. A temperature range of 22–25°C was considered as being optimal temperature for plant growth and development, as well as fruit set. However, temperatures below 18°C or above 30°C were considered suboptimal as they had adverse effects on both the plant growth rate and productivity (Mulholland et al., 2003; Bertin, 2005). Greenhouse technology has been
2
developed to optimize most conditions required for the stable growth of tomatoes, including temperature, lighting duration and density, nutrients, and CO2 application (Vanthoor et al., 2011).
Agronomic methods such as adding fertilizers and optimizing the growth environment for tomatoes have reached their limits. However, several choices as the application of exogenous hormones have been used effectively to improve fruit formation and development of tomatoes (Delph et al., 1997; Gorguet et al., 2005). Phytohormones such as auxin, gibberellin, and cytokinin have often been used for improving the fruit set. Auxins have been reported to have a strong effect on cell division, while gibberellin contributes to cell expansion. A conventional method of combinational application of auxin and gibberellin can produce fruits of the same shape and size as those of the pollinated fruits. This shows that the cell division and cell expansion of fruits are controlled by interactions between these hormones (de Jong et al., 2009a). Cytokinin was less commonly used as compared to the use of auxin and gibberellin. However, it has been reported that cytokinin plays an important role in the growth and development of tomatoes (Matsuo et al., 2012). The application of exogenous hormones during fruit formation may result in parthenocarpy—a phenomenon of the development of ovary to a fruit without pollination and/or fertilization resulting in a seedless fruit (Spena and Rotino, 2001; de Jong et al., 2009a). This approach of crop production is not only less dependent on environmental conditions but also a favorable trait of tomato fruit, which was a focus of study in the recent years (Martinelli et al., 2009; Pandolfini, 2009). Individual or combinational applications of auxin and gibberellin had positive effects on parthenocarpic fruit development. In addition, the application of exogenous cytokinins produced similar effects (Matsuo et al., 2012; Ding et al., 2013).
Advancement in genetic technology has discovered genes that promotes the growth, development, and formation of fruits by involving in cell division and expansion or hormone signaling. Any increase or decrease in the expression of CELL CYCLE SWITCH 52 (CCS52A) causing a reduction in the size of the pericarp cells that results in the reduction of fruit size (Mathieu-Rivet et al., 2010a; Mathieu-Rivet et al., 2010b). In addition, a fruit weight 2.2 gene (fw2.2) has been reported to be involved in cell cycle signals. Low levels of mRNA in fw2.2 resulted in larger fruit sizes, suggesting that this gene can participate in complexes inhibiting cell division (Cong and Tanksley, 2006). The analysis of hormone-related genes such as auxin and gibberellin revealed their role in the growth and development
3
of tomatoes. IAA9—a member of the IAA gene family —is considered to inhibit the transcription of auxin-responsive genes. The downregulation of the IAA9 expression level was shown to stimulate cell division, which resulted in an increase in the size of tomatoes; this was attributed to the interaction of IAA9 with auxin response factors (ARF) genes (Wang et al., 2005; de Jong et al., 2009b). In tomatoes, two genes of the ARF family, SlARF7 and SlARF8, play a role in the initiation and the development of parthenocarpic fruit (Goetz et al., 2007; de Jong et al., 2009b). In addition, many genes associated with the synthesis of gibberellins (GAs) were studied. Two genes—GA1 and GA4—associated with gibberellin biosynthesis were investigated for their role in the growth of tomatoes; GA1 efficiently stimulated fruit initiation, whereas GA4 promoted seed germination (Serrani et al., 2007; Nakaune et al., 2012). Further, it was shown that GA biosynthesis is closely related to the regulation of GA 20-oxidase (GA20ox) genes (Serrani et al., 2007). The downregulation of GA20ox1 resulted in short plants, reduced pollen survival, and deformed leaves. Other GA20ox family members such as GA20ox2 and GA20ox3 were shown to play a major role in the ovaries and fruits. However, overlapping functions of GA20ox1, GA20ox2, or GA20ox3 were reported, so that required silencing of all three GA20ox genes to evaluate their effect on fruit initiation and development (Xiao et al., 2006). Other studies showed that the mutation of gib1, gib2, and gib3 genes caused a deficiency in GA resulting in the inhibition of fruit formation. This defect was overcome when the exogenous GA was applied, indicating that GIB1, GIB2 and GIB3 participated in the process of endogenous GA synthesis (Bensen and Zeevaart, 1990).
1.1.3. Role of SlIAA9 and SlDELLA genes in tomato growth, development and fruit set
SlIAA9 and SlDELLA are two genes that play a key role in the plant growth, development, and fruit production of tomato (Wang et al., 2005; de Jong et al., 2009a). SlIAA9 is a transcriptional factor that controls the auxin-related genes involved in the plant growth, leaf structure, and formation and development of fruits. A decrease in the SlIAA9 expression makes the auxin response genes more sensitive to auxin signals, which leads to different phenotypes resulting in the development of fruits (Wang et al., 2005). The SlIAA9 expression conserves domains interacting with the specific regions of ARF genes, which control the activity of ARF dependent genes. It was shown that, in tomatoes, SlARF7 and SlIAA9 helped regulate the fruit set; while the homolog of SlARF7gene in Arabidopsis was AtARF8 (Goetz et al., 2007; de Jong et al., 2009b). Downregulation of SlIAA9 or SIARF7
4
led to the development of parthenocarpic fruits in tomatoes, indicating that both SIIAA9 and SlARF7 were negative transcription factors for the tomato fruit set. SlARF8 sometimes works as a partner of SlIAA9, regulated by the SlTIR1 (Transport Inhibitor Response 1) gene. In the absence of SlIAA9, the initiation of fruit set may be activated by the stimulation of SlARF8 to auxin response genes. TIR1 is an auxin receptor that plays important functions in fruit set initiation through positive regulatory mechanisms (El-Sharkawy et al., 2016). The over expression of SlTIR1 was found to degrade the Aux/IAA protein SlIAA9, exhibit altered leaf morphology, and parthenocarpy, in a study on tomatoes. The simplification of leaf complexity, increase in leaf length and width, petiole diameter, and the promotion of parthenocarpy were caused by the overexpression of SlTIR1, which was attributed to the downregulation of SlIAA9 (Ren et al., 2011).
Although IAA9 is a transcription factor that plays a role in controlling the activity of ancillary signalling genes, DELLA was considered a growth repressor that binds to transcription factors to control plant growth related to the gibberellin signaling response with their DNA binding domain (Harberd, 2003). DELLAs gene are members of the GRAS regulatory protein family (Bolle, 2004) that consist of five known-DELLA genes in Arabidopsis; however, it has only one single gene in tomatoes (Marti et al., 2007). In Arabidopsis, AtDELLA proteins repressed the growth of stigma, styles, and gynoecium (Fuentes et al., 2012). The downregulation of AtDELLA induced parthenocarpy, petiole elongation, and hypocotyl development, and it increased the light sensitivity of Arabidopsis plant (Djakovic-Petrovic et al., 2007). The pro mutant of SlDELLA in tomato induced internode elongation and promoted parthenocarpic fruit development (Martí et al., 2007; (Livne et al., 2015). SlDELLA could interact with SlARF7 in specific regions to regulate fruit development. SlDELLA and SlARF7/SlIAA9 built a complex mediated crosstalk between GA and auxin signaling during tomato fruit initiation (Hu et al., 2018).
1.1.4. Gene co-expression analysis for tomato growth and development
The genome sequences of tomatoes and some other model organisms were fully decoded with a complete list of genes and their corresponding IDs. It was reported that the 125-megabase (Mb) genome of Arabidopsis contains 25,498 genes, whereas the 950 Mb genome of tomatoes contains 34,727 genes distributed in 12 chromosomes (Cao et al., 2011; Consortium, 2012). There was great challenge to elucidate the genes functions because many genes were still not fully uncovered their role during the life of plant. Rapid advancement in
5
biotechnology with the introduction of microarray and RNA sequencing has provided valuable information from thousands of single or multiple experimental conditions. The use of gene expression data for biological studies has become popular (Horvath et al., 2003; Wang et al., 2009; Schadt et al., 2010). In addition to evaluating the expression of a large number of genes, the analysis of the microarray data has helped discover the functions of these genes. Microarray data obtained from different studies were collected and made available in a large public database. This database was useful for gene co-expression analysis to predict and identify gene functions (Saito et al., 2008). There are two approaches for co-expression network analysis (Aoki et al., 2007). The first method uses a pre-selected gene as the core part of the network, which is comprehended in some biological processes or pathways, and other genes that appear in the network and are related to the specific processes or pathways involving the core gene. In contrast, another approach is to construct a network of all those genes using all the available data of genes. This analysis does not target a specific goal to analyze a wide range of genomes and important connections that will be extracted from that overall network (Ma et al., 2007). Co-expression analysis can be used to identify potential candidate genes associated with plant growth and development (Piya et al., 2014; Harris Amrine et al., 2015; Li et al., 2015; Lin et al., 2017). For example, gene co-expression network analysis was utilized to discover genes in the enriched co-expression module(s) in the pathway of the flavonoid biosynthetic and modules of metabolites during fruit ripening (Kurabayashi et al., 2010; DiLeo et al., 2011). Further, the creation of the Tomato Functional Genomics Database (TFGD) provided not only a fundamental database for functional genomics research but also a huge resource of microarray, metabolite, and sRNA data sets for co-expression analysis based on computational applications (Fei et al., 2011).
1.2. Hypothesis of this study
Gene co-expression networks could be utilized to analyze a large DNA microarray or RNA sequencing dataset for several purposes such as discovering new candidate genes with specific function in a biological process, functional annotation, and identification of regulating elements (van Dam et al., 2017). Based on the correlation between genes, gene co-expression analysis can be used to determine the role of a large number of genes under the same biological conditions. Depending on different objectives, many internet-based-packages were built to analyze the gene co-expression (Zhang and Horvath, 2005; Langfelder and Horvath, 2008; Liu et al., 2010). In tomatoes, the microarray data of IAA9
6
and DELLA was established and published; the roles of auxin and gibberellin in the growth and development of phytohormone signaling were also explained, respectively (Wang et al., 2005; de Jong et al., 2009a). However, IAA9 and DELLA genes were only concentrated in the process of fruit initiation as they improve production and yield. Other genes controlling tomato growth and development in connection with IAA9 and DELLA were not identified. Thus, in this study, MRNet package was applied to analyze the co-expression network of SlIAA9 and SlDELLA from a public microarray dataset. To find out the downstream of SlIAA9 and SlDELLA, networks genes around SlIAA9 and SlDELLA were built using publicly available microarray data to extract genes directly connected to nodes SlIAA9 and SlDELLA, respectively. A potential candidate gene can be extracted from the genes directly connected to SlIAA9 and SlDELLA. The gene Solyc06g076020.2.1 was selected as the candidate gene as it appeared in both networks of SlIAA9 and SlDELLA.
To obtain insights involved in tomato growth, development, and fruit set of candidate genes, in this study, we attempted to clarify the function of the targeted gene to tomato through popular genetic approaches. In one approach, we attempted to upregulate the target gene by transferring one copy of this gene into the tomato Micro-Tom wild type through an Agrobacterium system. On another approach, we applied reverse genetics to find the function of the target gene by phenotyping its mutant screened from the mutation library of National BioResource Project (NBRP) Tomato by the TILLING (Targeting Induced Local Lesions in Genomes) technique. The overexpression (OE) and mutant lines would then be cultivated under a no stress condition for phenotyping. The combination of phenotypic analysis from the OE line and mutant lines of the targeted gene would give us insight into the HSP70 functions in tomato growth and development.
1.3. The objective of this study
The objectives of this study were investigating the function of the candidate gene in tomato growth, development, and fruit set.
(1) We constructed a network of SlIAA9 and SlDELLA to extract the candidate gene SlHSP70.
(2) We characterized the family gene descriptions based on their genomic sequences, coding DNA sequences (CDS), and amino acids sequences.
7
(3) We then attempted to determine the effects of the targeted gene in the case where the gene was overexpressed by transforming one copy of this gene into tomato host plant.
(4) Finally, we characterized the phenotypes of the HSP70 mutant from the Mutation Library of the National BioResource Project (NBRP) Tomato by the applied TILLING technique.
8
Chapter 2. Gene to gene co-expression to discover genes directed connection to SlIAA9 and SlDELLA
2.1. Introduction
2.1.1. Role of SlIAA9 and SlDELLA in tomato growth and development including fruit set
Tomato was a highly economical vegetable which has cultivated and consumed widely used in the world. In tomato cultivation, several plant hormones such as auxin and gibberellin were applied to tomato to increase yield and production. One of the most striking effects of the exogenous hormone applying was the stimulation of the formation and development of parthenocarpy, a desired trait of tomato that ovary can develop fruit, come over the pollination and fertilization. Relating to phytohormone signalling, Aux/INDOLE‐ 3‐ACETIC ACID 9 (SlIAA9) and SlDELLA were important genes for plant growth and development through cell division and cell expansion. Tomato Aux/IAA9 acted as a negative regulator of the auxin response involved in controlling of fruit set which repressing the transcription of the auxin responsive and fruit developmental genes through the interaction with Auxin response factor 7 (ARF7) (de Jong et al., 2009b). Downregulation in the transcript level of SlIAA9 could simplify leaf shape and elongate shoot parts, leading change in plant height. The downregulation also induced parthenocarpy (Wang et al., 2005; Okabe et al., 2011; Mazzucato et al., 2015). Meanwhile, SlDELLA was a negative regulator of gibberellin signaling through the combination with gibberellin receptor GID1 (Yoshida et al., 2014). DELLA has been suggested to function as a transcriptional activator and the fundamental components of the gibberellin‐ GID1-DELLA signalling pathway. Procera, a Sldella mutant, showed morphological changes in plant elongation, branching architect and reproductive organ development and promoted parthenocarpy (Marti et al., 2007; Bassel et al., 2008; Carrera et al., 2012). The parthenocarpy development in both Sliaa9 and Sldella mutants has elucidated by their downstream activities that stimulates phytohormone-related fruit development through their direct or indirect crosstalk (Hu et al., 2018). Changes of plant architecture in these mutants were investigated. However, these mechanisms remained unknown.
9
2.1.2. Introduction of the co-expression analysis in gene functions discovery and investigation of tomato
Tomato was considered a great model tree for fleshy climacteric fruit studies. The whole tomato genome had sequenced thank to the advances in biology sequencing technology but the functions of many genes were still unknown. However, the functional status of a gene can now be identified due to the development of high-throughput technologies such as microarrays and RNA sequencing (RNA-seq). The Sol Genomics Network (SGN) was a huge information network that gathers a genetic database of plants belonging to the Solanaceae family (Fernandez-Pozo et al., 2015). Tomato Functional Genomics Database (TFGD) provided not only fundamental database for functional genomics research but also a huge resource of microarray, metabolite and sRNA data sets for co-expression analysis based on computational application (Fei et al., 2011). The Gene Expression Omnibus (GEO) database of the National Centre for Biotechnology Information (NCBI) which obtained available GeneChip data from individual experiments provided a valuable resource of publicly materials for building new hypothesis and knowledge of gene functions based on gene co-expression network analysis (Toro-Domínguez et al., 2018). Co-expression gene networks could support predicting and improving the understanding of function of potential candidate genes in a biological process or pathway (Aoki et al., 2007). In the gene co-expression analysis, the differences in genes expression tendency including unknown functions gene among analytical samples might suggest the role of unknown genes in specific biological pathways. For instance, it is possible to suggest the role of candidate genes as a gene regulator if this gene appears in a transcription pathway. In co-expression analysis, gene expression views can help clearly present the tendency of differential gene expression between samples. Consequently, co-expression networks with expression views can be used to associate genes of unknown function with biological processes, to discern gene transcriptional regulatory mechanisms to prioritize candidate regulatory genes. The increase in the number of reports on co-expression gene networks indicated the power of this tool in predicting and annotating gene function (D’Haeseleer et al., 2000; Aoki et al., 2007; Usadel et al., 2009; Morenorisueno et al., 2010; Li et al., 2015; Serin et al., 2016). 2.1.3. Objective of this study
In this study, we applied the gene-to-gene co-expression network analysis based on the publicly available microarray data. Potential candidate genes which were directly connected with SlIAA9 and SlDELLA were investigated. The relationship distance level
10
between potential targeted gene with SlIAA9 and SlDELLA may suggest the potential functions of candidate gene for the tomato growth and developmenpt in relation with SlIAA9 and SlDELLA genes.
2.2. Materials and methods
2.2.1. Construction of gene co-expression networks
Affymetrix 307 GeneChips data obtained from GEO, ArrayExpress, and TFGD was used (Fukushima et al., 2012). To make networks, a Comprehensive R Archive Network (CRAN ver. 3.5.1) was used. The method of normalization and probe sets removal was conducted as in Fukushima et al, (2012). For the ID conversion of Affymetrix microarray’s probeset-ID and ITAG ID, we used information in Sol Genomics Network. (ftp://ftp.solgenomics.net/genomes/Solanum_lycopersicum/micro-arrays_mapping/A-
AFFY-87_AffyGeneChipTomatoGenome.compositeelements-_ITAG2.3-GeneID_mapping.txt). From this conversion, IDs with one-to-one correspondence were extracted, and a total of 5228 genes were used for network construction. The mrnet function package was used for the construction and the threshold was set to 0.05 (Meyer et al., 2008). MRNet generated a network using a feature selection method called minimum Redundancy Maximum Relevance (mRMR).
2.2.2. Drawing network diagram, GO analysis and distance measurement
Cytoscape ver. 3.7.0 was used for network diagram. BiNGO ver. 3.0.3, an application of Cytoscape, was used for GO analysis of the neighboring genes (Maere et al., 2005). Pesca ver. 3.0, a Cytoscape application, was used to measure the distances between each gene in the network. Product name of each gene was acquired using Panther (http://pantherdb.org/) (Thomas et al., 2003; Muruganujan et al., 2012).
2.3. Results
2.3.1. Gene-to-gene correlation networks using publicly available microarray data
SlIAA9 and SlDELLA are two key genes for the auxin and gibberellin signalling. These genes play important roles in the growth and development of tomato (Wang et al., 2005; de Jong et al., 2009a). A co-expression network has been set up from 5228 genes, in which, we focused on the sub network where two key genes SlIAA9 and SlDELLA played as core gene. To find out the up- or downstream of SlIAA9 and SlDELLA, networks around SlIAA9 and SlDELLA were cut out from each network constructed by public available microarray data (Figure 2.1, Figure 2.2). The gene-to-gene co-expression network comprised 26 genes were
11
directly connected to SlIAA9 as a main hub (Figure 2.1), while the network of SlDELLA had direct connection with seven different genes (Figure 2. 2).
2.3.2. GO enrichment analysis of neighbouring genes of SlIAA9 and SlDELLA
We investigated neighbouring genes of SlIAA9 and SlDELLA, respectively. Genes directly connected with SlIAA9 and SlDELLA in the co-expression networks were listed in Table 2.1 and Table 2.2, respectively. Among 26 neighbouring genes in the SlIAA9 network, nine genes have characterized by their functions. The most prominent one is the gene coding SlAGAMOUS-LIKE 11 (AGL11) transcription factor, also known as a member of MADS box transcription factors that plays an important role in the process of plant growth and development, particularly for timing of flowering and fruit development (Becker and Theißen, 2003; Smaczniak et al., 2012; Puranik et al., 2014). In tomato, overexpressing SlAGL11 has revealed abnormal stamens with poorly viable pollen (Daminato et al., 2014). The gene coding for Ubiquitin-conjugating enzyme E2 8 (UBC8) was reported participating to protein modification process in the pathway of protein ubiquitination (Kraft et al., 2005), while other two genes involved in sugar metabolism in tomato (Wong et al., 1990; Cai et al., 2018).
On the other hand, analysis of neighbouring genes in the SlDELLA network exhibited seven genes that were directly connected to SlDELLA node. The gene SAMDC coding for S-adenosylmethionine decarboxylase proenzyme (EC 4.1.1.50) is vital for biosynthesis of polyamines in the S-adenosylmethionine biosynthesis pathway (Majumdar et al., 2017). The gene coding constitutive photomorphogenesis 9 (COP9) signalosome complex subunit 4, a component of the COP9 signalosome complex, is involved in various cellular and developmental processes relating to phytohormone auxin responses (Wang et al., 2003). The gene Solyc06g076020.2.1 that was annotated as heat shock protein 70 SlHSP70-1 was appeared the direct connection with SlDELLA. In general, genes of HSP70 family often express in the response to stress growth conditions such as heat or drought stresses (Zhang et al., 2015b). The directed connection between SlHSP70-1 and SlDELLA gave a new hypothesis that SlHSP70-1 might be involved in tomato plant growth and development in a relationship with SlDELLA.
Next, we investigated distance between the targeted SlHSP70-1 and SlIAA9 and between that and SlDELLA, respectively. SlDELLA was directly connected to the
SlHSP70-12
1 gene, while distance from SlIAA9 to SlHSP70-1 were three hops (Table 2.3). Also, the distance from SlIAA9 to SlDELLA were three hops. As average of gene-to-gene distance in the network was 2.615 in this network, distance between SlHSP70-1 and SlDELLA was greater than the connectivity of SlHSP70-1 and SlIAA9 and SlIAA9 and SlHSP70-1. Besides, the overlaying the SlLAA9 and SlDELLA networks could extract the SlHSP70-1 that would have potential because this was the only gene to show direct connection with SlDELLA within other SlHSP70 on the microarray chip (Table 2.3). We thus focused on the SlHSP70-1 gene for further analysis.
The results of gene ontology (GO) enrichment analysis showed the over-presented GO terms of linked to SlIAA9 neighbouring genes were involved in various functions (Table 2.4). In the SlDELLA neighbouring genes, GO terms such as protein binding and proteasome complex were over-represented (Table 2.5).
2.4. Discussion
Gene co-expression networks can be utilized to analyse a big dataset of DNA microarray or RNA sequencing for abundant purposes such as discovering new candidate genes that have specific functions in a biological process, functional annotation and identify the regulating elements (van Dam et al., 2017). Therefore, gene co-expression networks are often used to clarify individual objectives for various plant species (Wisecaver et al., 2017; Tai et al., 2018; Rao et al., 2019). Depending on different objective, many internet-based packages were built to analyse the gene co-expression data (Langfelder and Horvath, 2008; Liu et al., 2010).
In this study, minet package was applied to construct the co-expression network of SlIAA9 and SlDELLA from public microarray dataset. MRNet utilized a method of maximum relevance/minimum redundancy feature selection to decide candidate genes based on its highly relevant to selection criterion (Meyer et al., 2007). GO enrichment analysis showed that genes connecting to SlIAA9 and to SlDELLA have GO terms related to plant growth and development functions in both networks. The greater number of correlated genes with SlIAA9 in the SlIAA9 network than that of the SlDELLA indicated that SlIAA9 may participate in more biological processes at the transcript levels than SlDELLA. As the complex SlIAA9 network contained many uncharacterized genes, it made difficulty to find out which candidate gene(s) should be chosen for further analysis (Figure 1). On the other hand, association between the targeted SlHSP70-1 and SlDELLA with directed connection
13
gave us an idea that SlHSP70-1 might have tight correlation relationships with SlDELLA that act as a hub in the SlDELLA network (Figure 2). The integrated analysis of the networks of SlIAA9 and SlDELLA could highlight the SlHSP70-1 as a potential target for further analysis. Because the targeted the SlHPS70 gene was directly connected with SlDELLA. As we mentioned above, the SlIAA9 network showed complex connections. The integrated network approach described here has a possibility to find candidate genes that may act as key genes with phytohormones in tomato (He and Maslov, 2016; Serin et al., 2016; Obayashi et al., 2017).
14
Table 2. 1. List of genes in the nearest neighbouring gene group of SlIAA9
Mapped ID Gene Name / Gene
Symbol
PANTHER Family/Subfamily PANTHER Protein Class
Solyc12g056840 Uncharacterized protein Phosphopantothenate--cysteine ligase (pthr12290: sf2) Ligase (PC00142)
Solyc03g019730 Uncharacterized protein Sumo-activating enzyme subunit 1 (pthr10953: sf162) Ligase (PC00142)
transfer/carrier protein (PC00219)
Solyc03g098730 Uncharacterized protein Cysteine protease inhibitor wscp-related (pthr33107: sf11) protease inhibitor (PC00191)
Solyc10g084920 PRA1 family protein Pra1 family protein (pthr12859: sf0) Amino acid transporter (PC00046)
Solyc11g011910 Transmembrane 9
superfamily member
Transmembrane 9 superfamily member-related (pthr10766: sf14) Transporter (PC00227)
Solyc09g075000 Uncharacterized protein Wd repeat-containing protein 89 (pthr22889: sf0)
Solyc11g017300 Uncharacterized protein Cop9 signalosome complex subunit 5 (pthr10410: sf6) Metalloprotease (PC00153)
Solyc09g083150 Uncharacterized protein Nad(p)h-quinone oxidoreductase subunit n Chloroplastic (PTHR35515:SF1)
Solyc04g077970 Uncharacterized protein Adenine phosphoribosyltransferase 1 Chloroplastic (PTHR11776:SF8)
Solyc02g062680 Anaphase-promoting
complex subunit 10
Anaphase-promoting complex subunit 10 (pthr12936: sf0) Enzyme modulator (PC00095) Ligase (PC00142)
Solyc05g018410 Uncharacterized protein 3-hydroxyisobutyryl-coa hydrolase-like protein 3 Mitochondrial-related (PTHR43176:SF5) Acetyltransferase (PC00038) Acyltransferase (PC00042) Dehydrogenase (PC00092) Epimerase/Racemase (PC00096) Hydratase (PC00120) Ligase (PC00142)
15
Solyc04g081770 Uncharacterized protein Gdsl esterase/lipase exl1-related (pthr45642: sf25) Solyc01g005470 Uncharacterized protein Plac8-like protein 1 (pthr15907: sf21)
Solyc04g078850 Protein DCL Ortholog DCL Protein (DUF3223)
(PTHR33415:SF2)
Solyc02g085500 Uncharacterized protein Transcription repressor ofp10-related (pthr33057: sf68) Solyc02g030300 Uncharacterized protein Subfamily not named (pthr27002: sf359)
Solyc05g049950 Small nuclear
ribonucleoprotein-associated protein
Small nuclear ribonucleoprotein-associated protein b' (pthr10701: sf0)
mRNA splicing factor (PC00148)
Solyc04g076850 Auxin-responsive
protein
Subfamily not named (pthr31734: sf18)
Solyc08g028690 Uncharacterized protein Subfamily not named (pthr43180: sf1)
Solyc05g009390 Uncharacterized protein Alpha/beta-hydrolases superfamily protein (pthr11614: sf94) Phospholipase (PC00186) serine protease (PC00203)
Solyc02g081160
Pyrophosphate--fructose 6-phosphate 1-phosphotransferase subunit beta
Pyrophosphate--fructose 6-phosphate 1-phosphotransferase subunit beta 1-related (pthr43650: sf1)
carbohydrate kinase (PC00065)
Solyc10g083570 Fructose-bisphosphate
aldolase
Subfamily not named (pthr11627: sf41)
Solyc11g028020 TAGL11 transcription
factor
Agamous-like mads-box protein agl11 (pthr11945: sf170) MADS box transcription factor (PC00250)
Solyc12g056100 UBC8 Ubiquitin-conjugating enzyme e2 29-related (pthr24068: sf78)
Solyc06g064840 Uncharacterized protein Agamous-like mads-box protein agl11 (pthr11945: sf170) MADS box transcription factor (PC00250)
Solyc07g041970 Uncharacterized protein Subtilisin-like protease sbt1.8 (pthr10795: sf335) protease inhibitor (PC00191) serine protease (PC00203)
16
Table 2. 2. Nearest neighbour gene group of SlDELLA gene
Mapped ID Gene Name / Gene Symbol PANTHER Family/Subfamily
Solyc03g006820 Uncharacterized protein Fi16820p1-related (PTHR10869:SF123)
Solyc09g014280 Uncharacterized protein Subfamily not named (PTHR31896:SF5)
Solyc05g010420 S-adenosylmethionine
decarboxylase proenzyme
S-Adenosylmethionine Decarboxylase Proenzyme 3 (PTHR11570:SF15)
Solyc11g011260 DELLA protein GAI DELLA protein RGL1-related (PTHR31636:SF47)
Solyc03g111330 Uncharacterized protein Subfamily not named (PTHR47525:SF1)
Solyc06g076020 (SlHSP70-1)
Uncharacterized protein Subfamily not named (PTHR19375:SF255)
17
Table 2. 3. The distance from SlHSP70-1 to SlIAA9 and SlDELLA in their co-expression network
Gene ID Gene name Shortest distance to SlIAA9
(Solyc04g076850.2)
Shortest distance to SlDELLA (Solyc11g011260.1) Solyc10g086410.2 SlHSP70-2 3 2 Solyc06g076020.2 SlHSP70-1 3 1 Solyc07g043560.2 SlHSP70-17 3 3 Solyc01g106260.2 SlHSP70-9 2 3 Solyc01g106210.2 SlHSP70-8 2 2 Solyc09g010630.2 SlHSP70-4 3 3 Solyc11g066100.1 SlHSP70-22 3 3 Solyc08g082820.2 SlHSP70-18 3 3 Solyc09g075950.1 SlHSP70-19 3 3
18
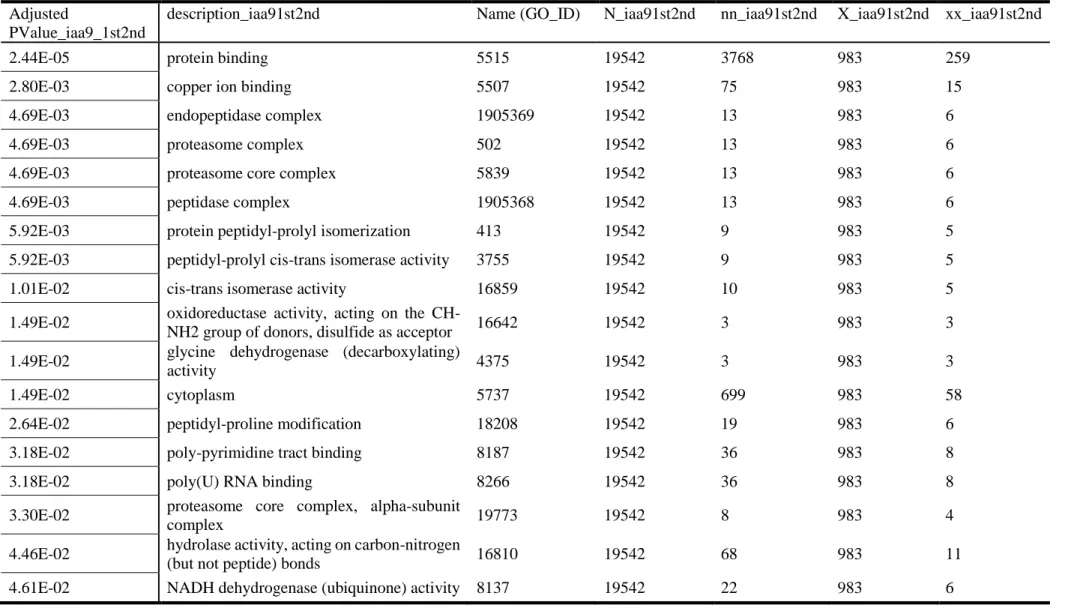
Table 2. 4. GO enrichment analysis of SlIAA9 gene on the network. (p < 0.05 adjusted by FDR) Adjusted
PValue_iaa9_1st2nd
description_iaa91st2nd Name (GO_ID) N_iaa91st2nd nn_iaa91st2nd X_iaa91st2nd xx_iaa91st2nd
2.44E-05 protein binding 5515 19542 3768 983 259
2.80E-03 copper ion binding 5507 19542 75 983 15
4.69E-03 endopeptidase complex 1905369 19542 13 983 6
4.69E-03 proteasome complex 502 19542 13 983 6
4.69E-03 proteasome core complex 5839 19542 13 983 6
4.69E-03 peptidase complex 1905368 19542 13 983 6
5.92E-03 protein peptidyl-prolyl isomerization 413 19542 9 983 5
5.92E-03 peptidyl-prolyl cis-trans isomerase activity 3755 19542 9 983 5
1.01E-02 cis-trans isomerase activity 16859 19542 10 983 5
1.49E-02 oxidoreductase activity, acting on the
CH-NH2 group of donors, disulfide as acceptor 16642 19542 3 983 3 1.49E-02 glycine dehydrogenase (decarboxylating)
activity 4375 19542 3 983 3
1.49E-02 cytoplasm 5737 19542 699 983 58
2.64E-02 peptidyl-proline modification 18208 19542 19 983 6
3.18E-02 poly-pyrimidine tract binding 8187 19542 36 983 8
3.18E-02 poly(U) RNA binding 8266 19542 36 983 8
3.30E-02 proteasome core complex, alpha-subunit
complex 19773 19542 8 983 4
4.46E-02 hydrolase activity, acting on carbon-nitrogen
(but not peptide) bonds 16810 19542 68 983 11
19
Table 2.5. GO enrichment analysis of SlDELLA gene on the network. (p < 0.05 adjusted by FDR)
Adjusted
PValue_della1st2nd
description_della1st2nd Name (GO_ID) N_della1st2nd nn_della1st2nd X_della1st2nd xx_della1st2nd
3.04E-05 endopeptidase complex 1905369 19542 13 216 5
3.04E-05 proteasome complex 502 19542 13 216 5
3.04E-05 proteasome core complex 5839 19542 13 216 5
3.04E-05 peptidase complex 1905368 19542 13 216 5
s4.05E-03 unfolded protein binding 51082 19542 55 216 6
9.10E-03 protein binding 5515 19542 3768 216 65
2.92E-02 protein
N-acetylglucosaminyltransferase activity
16262 19542 3 216 2
2.92E-02 soluble NSF attachment protein activity
20 Figure 2. 1. Co-expression network of SlIAA9 neighbouring genes
A) The first and second neighbouring genes of SlIAA9 (Solyc04g076850.2.1) are drawn. B) The nearest neighbour genes of SlIAA9 were extracted and drawn. SlIAA9 (Solyc04g076850.2.1) is located at the bottom of network with yellow color
21
Figure 2. 2. Co-expression network of SlDELLA gene neighbouring genes
Co-expression network of SlDELLA gene and its neighbouring genes. The conditions of neighbouring genes and network drawing are the same as those of SlIAA9.
22
Chapter 3. Genome-wide identification, structure characterization, phylogeny and expression patterns of tomato SlHSP70 genes
3.1. Introduction
3.1.1. Introduction of heat shock protein HSP70
Heat shock protein (HSP) are a family of proteins that respond to heat stress conditions and different types of cell stress in most organisms (De Maio, 1999). In plants, HSPs help resist adverse conditions caused by abiotic factors as temperature, drought, and salinity (Zou et al., 2012; Zhang et al., 2014; Augustine et al., 2015) and biotic factors such as virus or bacteria (Maimbo et al., 2007) in the growth, development and adaptation to environmental conditions. HSPs were divided into different families based on their molecular weight, in which five family genes were classified as HSP70, HSP90, HSP60, HSP100, and small weights heat shock protein (sHSP) (Wang et al., 2004). Of these, the HSP70 family was the largest group that regulated plant growth processes and functions during heat stress (Sung et al., 2001a). HSP70 contributes to the formation of a new protein and helps stabilize the structure of the protein against the effect of stress and unfavorable conditions (Xu, 2018). HSP70 consists of two distinct functional domains: the ATPase domain (~44 kDa) and the peptide binding domain (~30 kDa), which is similar in several organisms (Sung et al., 2001a; Sharma and Masison, 2009; Smock et al., 2010). HSP70 was also identified in most organelles, showing the importance of this gene to the survival and development of the organism (Sung et al., 2001b).
3.1.2. HSP70 genes in plants
Plants are organisms that cannot move themselves throughout their lifecycle, and therefore, they are greatly influenced by habitat conditions, especially those detrimental to survival and growth. In order to adapt to environmental conditions, plants developed a defense system that allows them to survive and grow under adverse conditions. HSP70 shares high similarity in its gene structure and protein characteristics among different species. Besides, the redundancy effect has made the number of member genes in each species relatively abundant. There were 22 HSP70 genes identified in Saccharomyces cerevisiae while only 3 genes were identified in E. coli (Walsh et al., 2004). In Arabidopsis, there were at least 18 members in the HSP70 superfamily, of which there were 14 genes in the HSP70
23
family, and four other genes belonging to the HSP110 family (Lin et al., 2001). Spinach had at least 12 genes identified in the HSP70 family while rice had 32 members of this gene family that provided the functional relevance of the HSP70 component of the HSP70/J proteins bi-chaperone machine of rice (Guy and Li, 1998; Sarkar et al., 2013). However, no investigation of the HSP70 gene family in tomato plants has been conducted so far. Although the tomato genome has been completely decoded into 12 chromosomes with more than 950 Mb, the knowledge of this gene family in tomatoes is very limited and separated.
3.1.3. The objectives of this study
In this chapter, we identified HSP70 homologs in tomato based on the genomic and protein's sequences from the public database. Comparing with references on the database using free computational tools, we collected the potential genes of tomatoes HSP70 family, characterized the gene and protein structure, and analyzed the relationship between these genes in the family. The objective of this work was establishing a list of tomato HSP70 genes and enhancing the basic understanding of this gene family in tomato.
3.2. Materials and methods
3.2.1. Identification and annotation of SlHSP70 genes in tomato
For the molecular description and phylogeny analysis of the SlHSP70 gene, the genomic and amino acid sequences of the target gene were downloaded from Phytozome database ver.12.1 (available on https://phytozome.jgi.doe.gov/pz/portal.html) using a search tool with the keyword “HSP70” for the targeted gene and “tomato” for species. The amino acid of each gene was uploaded to InterPro database (https://www.ebi.ac.uk/interpro/) for protein sequence analysis, classification, and functional annotation on Pfam database (https://pfam.xfam.org/). Only proteins containing the domain of SlHSP70 family were collected for in silico identification and structure characterization. The general gene annotation features, including gene identifier, locus identifier, genomic sequence, CDS sequence, amino acid sequence, and chromosomal distribution of each gene were obtained from the Phytozome database. Each gene ID was then searched against the Plant Genome
and Systems Biology (PGSB)
(http://pgsb.helmholtz-muenchen.de/plant/tomato/searchjsp/index.jsp) to determine the number of exons, and the position of the gene in the chromosome.
24
SlHSP70 gene features were visualized with intron, exon and UTR compositions using a Gene Structure Display Server 2.0 (GSDS) (Guo et al., 2014),
http://gsds.cbi.pku.edu.cn/).
3.2.2. Chromosomal localization and prediction of the duplication event of SlHSP70
Gene duplication events occur when a part or whole CDS of a gene is duplicated during gene evolution. The duplication of the SlHSP70 genes was analyzed by identifying their CDSs via alignment using the ClustalX (v. 2.1) (Larkin et al., 2007) with greater than 50% identity at the nucleotide level. The segmental duplication events were examined for the duplicated SlHSP70 genes to determine if they distributed on different chromosomes. If duplicated SlHSP70 genes localized on the same chromosome, they set a tandem duplication event (Feng et al., 2015).
In order to predict the duplication of the SlHSP70 genes during gene evolution under the pressure of natural selection, we calculated the ratio of Ka/Ks using the DnaSP (v. 5.0) software (Librado and Rozas, 2009); Ks and Ka represent the values of synonymous substitutions per synonymous site and non-synonymous substitutions per non-synonymous site, respectively. The ratio Ka/Ks indicates the conservation level of the gene. If Ka/Ks > 1, it indicates that the examined protein tends to divert after time, and the opposite case is suggested for a conserved protein (Hurst, 2002). The approximate time of the duplication events expressed in “million years ago’ “Mya) is estimated using T = Ks/2λ, with the mean value of clock-like rates (λ) of synonymous substitution. In tomato, λ = 1.5×10⁻⁸ substitutions per synonymous site per year (Liu et al., 2014).
3.2.3. Analysis of the protein features of the SlHSP70
Information on the general characteristics of the SlHSP70 proteins, including their molecular weight (mW, kDa) and theoretical isoelectric point (pI), was explored using the ExPASy-Compute pI/Mw tool (https://web.expasy.org/compute_pi/) (Gasteiger et al., 2003). The subcellular localization of SlHSP70 proteins were predicted using the TargetP online tool (http://www.cbs.dtu.dk/services/TargetP/) (Emanuelsson et al., 2007).
25 3.2.4. Phylogeny tree construction
Multiple sequence alignments were performed for amino acids using ClustalW (https://www.genome.jp/tools-bin/clustalw) (Thompson et al., 2003). The phylogeny analysis was inferred using the neighbor joining method (Nei and Saitou, 1987), and the phylogeny tree was constructed by MEGA7 software, with 1000 replicates for bootstrap testing (Kumar et al., 2016).
3.2.5. Expression analysis of the SlHSP70 genes in different tissues of tomato
The SlHSP70 transcript patterns in eight major organs of two tomato species S. lycopersicum var. M82 and S. pennellii were determined using the expression data obtained from the tomato eFP browse database (http://bar.utoronto.ca/efp_tomato/cgi-bin/efpWeb.cgi). The tomatoes were germinated and grown at 22°C under a mixture light of cool-white and far-red fluorescent light. The seedlings were collected three days after sowing on the plate. The shoot and the roots tissue were collected from the seedling 10 days after sowing on the plates. Vegetative meristems were collected when the third leaf reached 1 mm (30–37 days post germination). The stem between the 4th and 5th leaves and inflorescent meristem were collected at 50 days after germination for S. lycopersicum var. M82 and 56 days after germination for S. pennellii. Young green fruits and mature fruits were collected from plants in the greenhouse (Koenig et al., 2013).
3.3. Results
3.3.1. Molecular characterization of the SlHSP70 genes on the tomato genome
Based on the genetic sequence of the tomato, obtained from the Phytozome database (https://phytozome.jgi.doe.gov/pz/portal.html), 25 genes were collected for tomato HSP70 (SlHSP70), including 21 genes containing Interpro domain IPR013126 for HSP70 and 4 genes contained Interpro domain IPR012725 for DnaK chaperone, an overlapping homologous subfamily of HSP70, which is often expressed in bacteria (Genevaux et al., 2007). Most of the 25 genes were uncharacterized (Table 3.1). To define the structural features of the SlHSP70 genes in tomatoes, the exon/intron organization of the SlHSP70 genes was investigated by aligning their CDSs and related genomic sequences using the gene structure display server (GSDS) tool (Hu et al., 2015). There were 22
26
SlHSP70 genes were divided to several groups that shared similar genomic structures. There was, for instance, a group of genes comprising seven genes with two exons in the gene structure, while another group including three genes with six exons. Nine SlHSP70 genes contained more than six exons, of which, two genes had seven exons, three gene had eight exons, and four genes had nine exons. In particular, one gene consisted of 13 exons while there were three intronless genes. The genomic features of the SlHSP70 family gene are shown in Figure 3.2B and listed in Table 3.2. Multiple exon/intron gene organizations suggested a diverse structure for the SlHSP70 gene observed in tomatoes. It has been well-established that introns are known to be essential entities to achieve an eukaryotic gene structure with numerous functions such as in exon shuffling, alteration of the gene expression, and regulation of the evolutionary rate of genes (Fedorova and Fedorov, 2003). The distinction in gene composition has shown the potential functions of intron in tomatoes in the development of the SlHSP70 gene family.
We next obtained detailed information on the typical characteristics of all identified SlHSP70 genes, which included protein length, molecular weight (mW), theoretical isoelectric point (pI), and subcellular localization, by subjecting their full-length protein sequence to the Expasy web-based tool for an analysis. Our data indicated that the SlHSP70 genes possess a protein length between 80–890 amino-acid residues, as long as they brought the specific domain of the HSP70 protein. The molecular weight of SlHSP70 were recorded from 8.68–93.88 kDa, and their pI values varied from acidic (pI = 4.32) to basic (pI = 9.3). The subcellular localization prediction showed that 25 SlHSP70 protein encoded for 2 chloroplast, 2 mitochondria, 1 plasma membrane, 4 endoplasmic reticulum, 1 nucleus, 11 cytoplasm, and 4 other proteins may localize in one or more organelles above. Some proteins showed similar descriptions of length, molecular weight (mW), and theoretical isoelectric point (pI), while their coding genes were similar in the gene structure. All gene features and protein characterizations are listed in Table 3. 3.
3.3.2. Chromosomal localization and prediction of the duplication events of SlHSP70 genes
The chromosomal distributions of the identified SlHSP70 genes were assessed based on the currently available information of each gene in the chromosome. Twenty-five genes were localized in 11 different chromosomes; in particular, no gene localized in chromosome 5, while chromosome 1 shared the highest number of SlHSP70 genes with
27
five members, and it occupied 20 percent of all genes. Each chromosome 3, 6, 11, and 12 carried 3 SlHSP70 genes, while chromosomes 7 and 9 shared 2 genes. Chromosomes of 2, 4, 8, and 10 contained one SlHSP70 gene each. The overall distribution of the mapped SlHSP70 genes on the annotated genome is shown in Figure 3.1. According to the chromosomal distribution of each SlHSP70 gene, we named 25 mapped genes with their SolycID of each gene (Table 3. 1).
Further, we assessed the occurrences of duplication among the SlHSP70 genes. According to our pre-set criteria for this analysis, 12 duplicated events with only 10 genes were detected (Table 3.4 and Figure 3.1). One duplicated event (1 and SlHSP70-14) was a tandem duplication event caused by localization within the chromosome while all other duplication events were determined as segmental type. Our assessment indicated that segmental duplication occurrences may play a major role in the development of the tomato gene family SlHSP70.
The most frequently duplication was identified with the SlHSP70-1 gene. The gene SlHSP70-1 was duplicated with 4 other genes, of which, only one tandem duplication event of a pair gene SlHSP70-1/SlHSP70-14 was predicted in the family. The gene SlHSP70-2 was duplicated with two genes while SlHSP70-3 was duplicated with three genes. The approximate time of the duplication events expressed that the pairs of SlHSP70-2/HSP70-3 and SlHSP70-1/SlHSP70-21 were segregated last, which indicate they were latest separated during gene evolution. This claim is supported by the highest similarity when comparing the CDS sequences between the two genes (>85% identity). Meanwhile, the pair of HSP70-3/SlHSP70-14 was earliest dissociations leads to the least sharing in their CDS sequences with only 50.9% between them. The abundant duplication of the SlHSP70 genes suggested the important role of these genes in the growth, development, and stress resistance of tomato.
In terms of chromosome localization, genes on chromosome 6 tend to repeat with most genes. All three genes on chromosome 6 were replicated with others, whereas chromosome 3 replicates 2 genes, while chromosomes 4, 8, 9, 10, 11, and 12 share 1 gene with repetition. In particular, chromosome 1 carries the most genes (5 genes); however, it cannot predict gene duplication and the repeating genes are identified, similar to chromosomes 2 and 7. 3.3.3. Phylogenetic analysis-based on amino acid sequences
To characterize the phylogenetic relationship of the identified SlHSP70 genes, the full-length protein sequences of 25 SlHSP70 were aligned, and an unrooted tree was
28
created using the neighbor joining method (Figure 3.2A). The results indicated that a closed relationship in the group of genes SlHSP70-1, SlHSP70-2, SlHSP70-3, SlHSP70-4, and SlHSP70-21 when they were placed together in one cluster of the phylogeny tree. The protein of the targeted gene (SlHSP70-1) showed similarity with the other three genes SlHSP70-2, SlHSP70-4, and SlHSP70-21. The structure of the four genes has the same number of introns, exons, and similar length (Figure 3.2B). This suggests that they might share biological functions though the functions of these genes are still uncharacterized. The genes mentioned above and some other genes SlHSP70-13, SlHSP70-22, and SlHSP70-23 together form a phylogenetic cluster, including the family of genes that shares high structural similarity with little exon. The next cluster includes genes SlHSP70-6, SlHSP70-11, SlHSP70-15, and SlHSP70-19. This is group of multiple exons that are very similar in terms of the genomic structure. Another cluster of multiple exons consists of genes SlHSP70-7, SlHSP70-8, SlHSP70-9, and SlHSP70-20. Two these clusters are separated by the last phylogenetic multi-exon genes cluster that consists of genes SlHSP70-10, SlHSP70-24, SlHSP70-25, and SlHSP70-17 localized far away in the genome structure. Four phylogenetic clusters were found based on genomics and amino acid sequences in the family gene HSP70. With elevated genetic similarity and protein characterization, it can be suggested that this gene shares biological functions during the physiological development of the tomato. 3.3.4. Transcript patterns of the SlHSP70 genes in major organs of tomato plants during growth and development
Organ/tissue-specific transcription patterns can suggest the role of a gene in a specific organ or tissue (Pontes et al. 2013). In this study, the transcriptome data publicly available in the Tomato eFP browser (Koenig et al., 2013) was used to explore the expression profiles of 25 SlHSP70 genes in various tomato organs under normal growth conditions. Among 25 genes of SlHSP70 family, gene SlHSP70-15 had no available expression information from the transcriptome database (Figure 3.3); 24 remaining SlHSP70 genes were differentially expressed in the examined organs. Five genes (SlHSP70-5, SlHSP70-12, SlHSP70-14, SlHSP70-15 and SlHSP70-23) were expressed at very low levels in all major organs. On the contrary, genes SlHSP70-7, SlHSP70-8, SlHSP70-11, SlHSP70-18, SlHSP70-21, SlHSP70-25, SlHSP70-2, and SlHSP70-4 were highly expressed in most tissues that were checked; in particular, gene SlHSP70-4 was expressed at the highest level compared to other genes in the family for all tissues, and it was followed by the couple of SlHSP70-7 and SlHSP70-21 genes in the same tissues. A