Shibaura Institute of Technology
Ph.D. ThesisAn analysis of drying
characteristics of Polish lignite
in superheated steam atmosphere
Marcin Zakrzewski
Supervisors:
Professor Shinji Kimijima
Professor Janusz S. Szmyd
iii
Acknowledgments
I would like to convey my sincere gratefulness to Professor Shinji Kimijima for his invaluable support during the preparation of this thesis as well as for the benevolence, enthusiasm and welcoming atmosphere provided during my stay at his laboratory at Shibaura Institute of Technology.
It is my pleasure to express my appreciation towards Professor Janusz S. Szmyd for the research opportunities he offered me, for the inspiration to unceasingly enhance knowledge, for his invaluable academic guidance as well as for the time and attention he has been giving me throughout my doctoral studies at AGH University of Science and Technology.
I would like to acknowledge Professor Shozo Kaneko, who kindly accepted me in his research group at The University of Tokyo. His visionary ideas, splendiferous knowledge and willingness to share them with people deserve the highest recognition.
I do express my honest gratitude to Dr. Anna Ściążko and Dr. Yosuke Komatsu for the collaboration during the research that preceded the formulation of this dissertation. Their relentless efforts, good will, patience and professionalism cannot be overestimated in regard to raising the quality of this work.
iv
I am very grateful to the people who personally contributed to performing the experimental studies of lignite drying in superheated steam at The University of Tokyo: Professor Akira Hashimoto for his brilliant advice, Mr. Taro Akiyama, Mr. Kohei Fukuda and Mr. Komei Tanaka for direct cooperation in experimental attempts.
Finally, I would like to express my wholehearted gratefulness to my Wife and Family, who have been supporting me in an invaluable manner during my research visits to Japan and throughout the entire process of preparation of this thesis. I am also pleased to convey warm regards to my Friends for their encouragement in my efforts.
The research presented in this work was conducted under the Joint Doctoral Diploma Program between Shibaura Institute of Technology in Japan and AGH University of Science and Technology in Poland. Therefore I would like to acknowledge Professor Akito Takasaki, former Director of the Center for International Programs and current Dean of Graduate School of Engineering and Science at SIT for laying foundations for excellent cooperation between the two research institutions.
v
Contents
Acknowledgments ... iii
Contents ... v
Nomenclature... xi
Table captions ... xvii
Figure captions ... xix
CHAPTER 1 Introduction ... 1
1.1 Role of lignite in global economy ... 1
1.2 Lignite industry in Poland ... 5
CHAPTER 2 Technology of coal drying ... 11
2.1 Moisture in lignite ...11
2.1.1 Structural and thermodynamic classification ...11
2.1.2 Technological aspects ... 13
2.2 Available methods of coal drying ... 16
2.2.1 Evaporative drying ... 17
2.2.2 Non-evaporative dewatering ... 20
2.3 Superheated steam drying ... 22
2.4 Modelling of coal drying ... 26
vi
CHAPTER 4 Methodology of experimental procedure of lignite drying in superheated
steam ... 33 4.1 Lignite samples... 33 4.1.1 Sample of 30 mm ... 34 4.1.2 Sample of 10 mm ... 35 4.1.3 Sample of 5 mm ... 35 4.1.4 Sample of 2.5 mm ... 36
4.1.5 Variability of the samples ... 38
4.2 Experimental setup ... 40
4.3 Procedure of superheated steam drying ... 45
CHAPTER 5 Experimental analysis of lignite drying in superheated steam ... 47
5.1 Comprehensive analysis of the general drying characteristics of lignite exposed to superheated steam ... 47
5.1.1 Preheating period ... 49
5.1.2 Constant drying rate period (CDRP) ... 49
5.1.3 Decreasing drying rate period 1 (DDRP 1) ... 50
5.1.4 Decreasing drying rate period 2 (DDRP 2) ... 50
5.1.5 Final drying period ... 51
5.2 Analysis of superheated steam drying characteristics obtained at various experimental conditions ... 51
5.3 Observation of lignite appearance during superheated steam drying ... 63
5.4 The influence of the structural features of lignite on the properties related to superheated steam drying ... 70
5.4.1 Geological origin and contents of coal from Belchatow and Turow lignite mines . 70 5.4.2 Effect of geological structure on initial moisture and density of lignite ... 74
5.4.3 Effect of ash contamination on the drying behavior ... 76
5.4.4 Sensitivity analysis of physical properties of lignite on the drying parameters ... 79
vii
CHAPTER 6 Mathematical model of lignite drying in superheated steam ... 85
6.1 Physical model ... 85 6.2 Mathematical formulation ... 87 6.2.1 Heat transfer ... 87 6.2.2 Mass transfer ... 88 6.3 Numerical model ... 89 6.3.1 Discretization scheme ... 89 6.3.1.1 Heat transfer ... 89 6.3.1.2 Mass transfer ... 91
6.3.2 Particular discretization assumptions ... 92
6.3.3 Specificity of particular drying stages ... 94
6.3.3.1 Condensation of water on the surface ... 94
6.3.3.2 Evaporation of water from the surface ... 95
6.3.3.3 Evaporation of free water ... 95
6.3.3.4 Evaporation of bound water ... 96
6.3.3.5 Change of sample size due to shrinkage ... 97
CHAPTER 7 Numerical analysis of lignite drying in superheated steam ... 99
7.1 Comparison of empirical and numerical results of single-particle drying ... 99
7.2 Prediction of temperature dependence on the drying performance ... 108
7.3 Quantitative verification of computed values ... 111
7.4 Visualization of temperature field within the lignite sphere during superheated steam drying ...115
7.5 Influence of variability of fundamental parameters of superheated steam drying process on the drying kinetics ... 121
7.5.1 Simulated drying kinetics of lignite from various deposits ... 121
7.5.2 Sensitivity analysis of the drying kinetics in regard to process parameters ... 126
7.6 Simulation of multi-particle drying ... 135
viii
7.7.1 Assumptions ... 139
7.7.2 Influence of input coal assortment on calorific value of lignite ... 145
7.7.3 Influence of process parameters variability on calorific value of lignite ... 146
CHAPTER 8 Summary... 151
8.1 Conclusions ... 151
8.2 Recommendations ... 153
References ... 157
Appendix A Determination of thermal conductivity coefficient ... 171
A.1. Experimental setup and procedure ... 171
A.2. Assumptions of the simulation ... 172
A.3. Function of the objective ... 173
Appendix B Determination of heat transfer coefficient ... 175
B.1. Derivation from experimental drying kinetics ... 175
B.2. Derivation with a linearized radiation equation ... 176
Appendix C Optimization of model segmentation ... 181
C.1. Assumptions ... 181
Appendix D Unsteady state heat transfer in lignite by means of conduction ... 185
D.1. Assumptions ... 185
D.2. Analytical solution ... 185
D.3. Numerical solution ... 188
D.4. Comparison ... 189
Appendix E Coal temperature data processing utility ... 193
E.1. Assumptions ... 193
E.2. Schematics of data transformation ... 194
ix
Appendix F Computational algorithm of superheated steam drying ... 203
F.1. Assumptions ... 203
F.2. Flowchart diagram ... 204
F.2.1 Initial calculations ... 204
F.2.2 Condensation stage ... 205
F.2.3 Surface evaporation stage ... 206
F.2.4 Drying 1 stage – free water occurring ... 207
F.2.5 Drying 2 stage – no free water occurring ... 208
xi
Nomenclature
Symbols
A – area [m2]b – half of layer’s thickness [m] c – specific heat [J kg-1 K-1]
B – uniformity constant for coal particle distribution equation [-]
CDRP – constant drying rate period
C% – carbon content [mass%]
{CO2_kg} – unit emission of carbon dioxide per mass unit [kg kg-1]
{CO2_kWh} – unit emission of carbon dioxide per electricity unit [kg kWh-1]
d – diameter [m]
D – apparent diffusion coefficient of free water [m2 s-1] DBC – dry base coal
DDRP – decreasing drying rate period
DR – drying rate [s-1]
DT – number of simulation steps [-]
E_kg – electricity generation per fuel mass unit [kWh kg-1]
F – analytical solution equation coefficient h – heat transfer coefficient [W m-2 K-1]
xii
HHV – higher heating value [J kg-1]
∆H – enthalpy change of bound water evaporation [J kg-1
]
I – number of iterations of the simulation
k – parameter of equilibrium moisture content function L – latent heat of free water evaporation [J kg-1]
LHV – lower heating value [J kg-1]
m – mass [kg]
n – normal vector
N – number of layers within a spherical model NMAE – normalized mean absolute error [-] p – pressure [Pa]
q̇ –heat flux [W m-2
]
Q̇ – rate of heat flow [W]
∆Q – heat input/consumption [J] r – radius [m]
R – characteristic linear dimension [m]
RMSE – root-mean squared error of temperature [oC]
t – time [s] ∆t – time step [s] T – temperature [oC] ∆T – change/difference of temperature [o C] V – volume [m3]
xiii
Greek letters
α – thermal diffusivity [m2
s-1]
xiv
Subscripts
1 – referring to the first layer (surface) a – superheated steam b – bulk ad – air-dried coal apr – approximated avg – average c – dry coal cent – center cond – condensation cons – consumption conv – convective
CDRP – referring to constant drying rate period dry – drying
e – characteristic (particle diameter)
exp – experimental eq – equilibrium
evap – evaporated water free – free water removal in – entering the layer int – interface
m – sequence of roots of the characteristic equation index
max – maximum mid – midpoint
xv
out – leaving the layer r – relative
rad – radiative
raw – as-received coal s – water vapor
sim – simulated surf – surface sw – swelling water trans – water transfer
V – volumetric
w – water
Superscripts
+ – superscript of dimensionless radius 0 – initial
xvii
Table captions
Table 1.1 Countries possessing largest lignite reserves (as of 2015) ... 3
Table 1.2 Countries possessing largest lignite resources (as of 2015) ... 3
Table 1.3 Leading lignite producers in 2015 ... 4
Table 1.4 Lignite mines founded on present territory of Poland in the 19th century ... 5
Table 1.5 Utilization of lignite in Poland on selected years between 1945 and 1990 ... 7
Table 1.6 Electricity generation in Poland ... 8
Table 1.7 Polish lignite mines and power plants ... 9
Table 2.1 Classification of water in brown coal ... 13
Table 2.2 Characteristic features of superheated steam drying ... 26
Table 4.1 Dimensions of samples used in the experiment ... 34
Table 4.2 Initial values of density and water percentage ... 40
Table 4.3 Commercial resources used for drying or measurement... 41
Table 5.1 Experimental time of drying for samples of 30 mm ... 62
Table 5.2 Experimental time of drying for samples of 10 mm ... 62
Table 5.3 Experimental time of drying for samples of 5 mm ... 62
Table 5.4 Experimental time of drying for samples of 5 mm ... 63
Table 5.5 Average total volumetric shrinkage of lignite ... 67
Table 5.6 Proximate and ultimate analyses for the lignite samples from Belchatow and Turow mines ... 73
Table 5.7 Selected drying indicators of exemplary T1 samples ... 78
Table 6.1 Selected properties of coal applied in the simulation ...86
Table 7.1 Indicators applied for drying performance evaluation ... 108
Table 7.2 Predicted values of drying indicators for 30 mm sample ... 109
xviii
Table 7.4 Predicted values of drying indicators for 5 mm sample ... 109
Table 7.5 Predicted values of drying indicators for 2.5 mm sample ... 110
Table 7.6 Accuracy of two proposed models of drying time approximation ... 114
Table 7.7 Selected material properties of Belchatow and Turow lignites ... 122
Table 7.8 Comparison of main simulation indicators for 10 mm samples of different coal types dried at 150 oC ... 124
Table 7.9 Parameters used in sensitivity analysis of the numerical model ... 127
Table 7.10 Representative diameters of particle groups in various lignite assortments ... 137
Table 7.11 Components of B2013 lignite relevant to evaluation of calorific value ... 140
Table 7.12 Reference cases applied to CO2 reduction analysis ... 144
Table B.1 Properties and dimensionless numbers used in derivation of hconv ... 177
Table C.1 Absolute and relative values of both optimization criteria... 183
Table D.1 Parameters used for the analytical solution of lignite heating... 186
xix
Figure captions
Figure 1.1 Global share of leading lignite producers in 2015 ... 4
Figure 1.2 Deposits of fossil fuels in Poland ... 6
Figure 2.1 Types of water in lignite... 12
Figure 2.2 Evaporation heat demand in regard to water types ... 14
Figure 2.3 Proposed classification of coal drying techniques ... 16
Figure 2.4 Scheme of WTA technology of superheated steam drying ... 24
Figure 2.5 Simplified scheme of latent heat recovery ... 25
Figure 4.1 Scheme of preparation of the experimental samples ... 33
Figure 4.2 Lignite samples of A) 30 mm, B) 10 mm, C) 5 mm, D) 2.5 mm in diameter ... 37
Figure 4.3 Sample of 10 mm ready for the test. ... 38
Figure 4.4 Correlation between density and initial water percentage of the samples ... 39
Figure 4.5 Scheme of experimental setup ... 41
Figure 4.6 Side view on thermography measurement devices ... 43
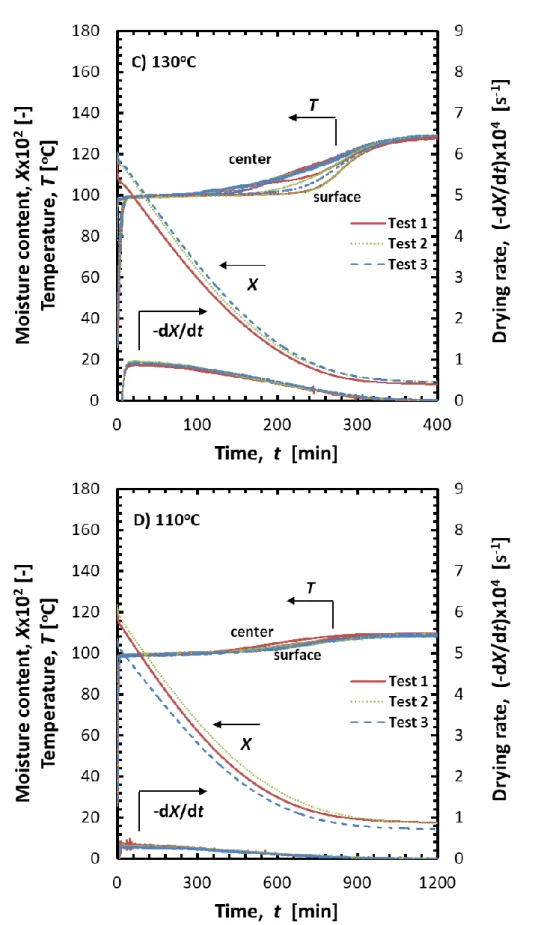
Figure 5.1 Drying behavior of 5 mm sample at 170 oC, in relation to: A) changes of drying indicators in time, B) changes in object’s appearance, C) stages of water removal, D) changes of drying indicators in the function of moisture content. ... 48
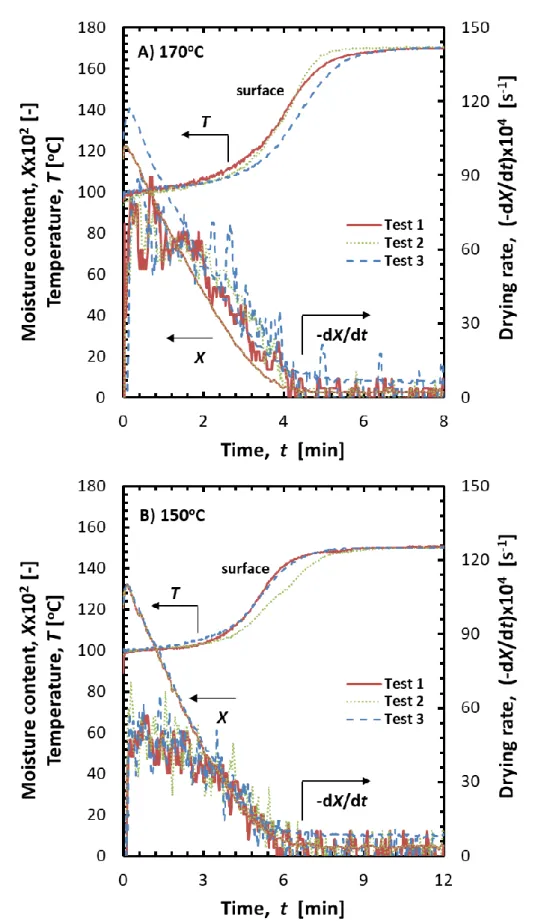
Figure 5.2.1 Experimentally obtained drying characteristics of 2.5 mm sample at test temperatures of A) 170 oC, B) 150 oC ... 53
Figure 5.2.2 Experimentally obtained drying characteristics of 2.5 mm sample at test temperatures of C) 130 oC, D) 110 oC ... 54
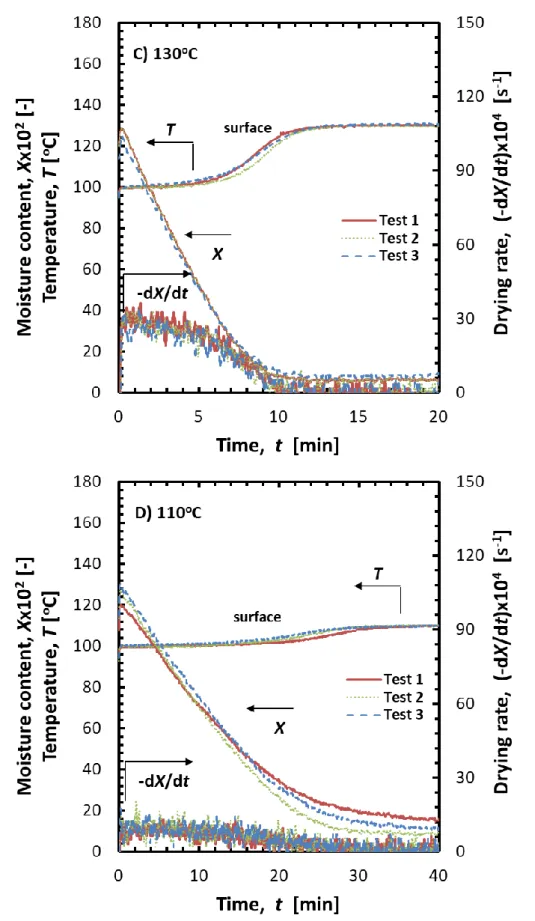
Figure 5.3.1 Experimentally obtained drying characteristics of 5 mm sample at test temperatures of A) 170 oC, B) 150 oC ... 55
Figure 5.3.2 Experimentally obtained drying characteristics of 5 mm sample at test temperatures of C) 130 oC, D) 110 oC ... 56
xx
Figure 5.4.2 Experimentally obtained drying characteristics of 10 mm sample at test
temperatures of C) 130 oC, D) 110 oC ... 58
Figure 5.5.1 Experimentally obtained drying characteristics of 30 mm sample at test temperatures of A) 170 oC, B) 150 oC ... 59
Figure 5.5.2 Experimentally obtained drying characteristics of 30 mm sample at test temperatures of C) 130 oC, D) 110 oC ... 60
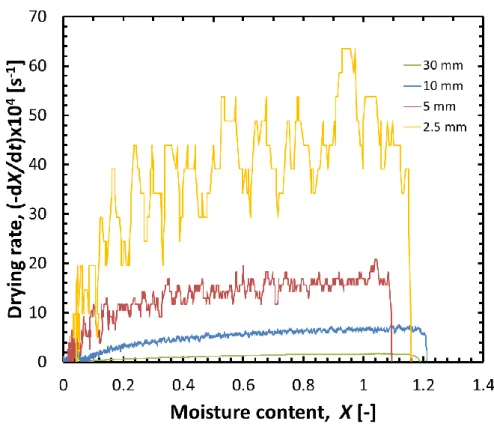
Figure 5.6 Experimentally obtained correlation of drying rate and moisture content for drying at 150 oC of samples of various diameters ... 61
Figure 5.7 Experimentally obtained correlation of drying rate and moisture content for drying of 10 mm sample at various steam temperatures ... 61
Figure 5.8 Photograph of the set of 2.5 mm lignite samples prepared for the test ... 63
Figure 5.9 Observation of 10 mm sample dried at A) 170, B) 150, C) 130 and D) 110 oC ... 64
Figure 5.10 Observation of A) 30, B) 10 and C) 5 mm sample dried at 150 oC ... 66
Figure 5.11 Average shrinkage of the samples in the drying process ... 68
Figure 5.12 Falling of water droplets in the initial drying period of 30 mm sample ... 69
Figure 5.13 Map and cross section of Belchatow lignite mine and its surroundings ... 71
Figure 5.14 Map and cross section of Turow lignite mine and its surroundings ... 72
Figure 5.15 Representative cases of A) xylitic and B) detritic coal ... 74
Figure 5.16 Correlation between initial density and water share for coal batches A) T1, B) T2, C) T3, combined with D) general observations ... 76
Figure 5.17 Exemplary drying characteristics of 10 mm samples made from T1 lignite, dried at 150 oC: A) mass, B) temperature profile, C) moisture content, D) drying rate ... 77
Figure 5.18 Impact of initial water share and density of lignite on the drying rate ... 80
Figure 5.19 Impact of dry bulk density of lignite and particle size on the drying rate ... 81
Figure 5.20 Impact of dry bulk density and steam temperature on the drying rate ... 81
Figure 5.21 Comparison of equilibrium moisture content for Belchatow and Turow lignite with different lignite types and other materials. ... 84
Figure 6.1 Distribution of elements within a lignite sphere ... 94
Figure 7.1.1 Comparison of experimentally and numerically obtained drying characteristics of 2.5 mm sample at test temperatures of A) 170 oC, B) 150 oC ... 100
Figure 7.1.2 Comparison of experimentally and numerically obtained drying characteristics of 2.5 mm sample at test temperatures of C) 130 oC, D) 110 oC ... 101
Figure 7.2.1 Comparison of experimentally and numerically obtained drying characteristics of 5 mm sample at test temperatures of A) 170 oC, B) 150 oC ... 102
xxi
Figure 7.3.1 Comparison of experimentally and numerically obtained drying characteristics of
10 mm sample at test temperatures of A) 170 oC, B) 150 oC ...104
Figure 7.3.2 Comparison of experimentally and numerically obtained drying characteristics of 10 mm sample at test temperatures of C) 130 oC, D) 110 oC ... 105
Figure 7.4.1 Comparison of experimentally and numerically obtained drying characteristics of 30 mm sample at test temperatures of A) 170 oC, B) 150 oC ... 106
Figure 7.4.2 Comparison of experimentally and numerically obtained drying characteristics of 30 mm sample at test temperatures of C) 130 oC, D) 110 oC ... 107
Figure 7.5 Maximum values of drying rate obtained from the experiment, the approximation formula and the numerical simulation ...112
Figure 7.6 Drying time values obtained from the experiment, the approximation formula and the numerical simulation ...114
Figure 7.7.1 Simulated temperature field in 30 mm object dried at 150 oC (part one) ...116
Figure 7.7.2 Simulated temperature field in 30 mm object dried at 150 oC (part two) ...117
Figure 7.8.1 Simulated temperature field in 10 mm object dried at 150 oC (part one) ...118
Figure 7.8.2 Simulated temperature field in 10 mm object dried at 150 oC (part two) ...119
Figure 7.9 Simulated temperature difference between surface and center of 10 mm and 30 mm samples dried at 150 oC ... 120
Figure 7.10 Drying behavior of 10 mm sample at test temperature of 150 oC obtained numerically for lignite batches from Belchatow (A-C) and Turow (D-F) mines ... 123
Figure 7.11 Comparison of drying characteristics of 10 mm sample at 150 oC obtained numerically and experimentally for A) B3, B) T1 lignite batches ... 125
Figure 7.12 Numerically obtained correlation of drying rate and moisture content for 10 mm samples of Turow and Belchatow lignite dried at test temperature of 150 oC ... 126
Figure 7.13.1 Numerical simulation of drying parametrized for: A) density ... 130
Figure 7.13.2 Numerical simulation of drying parametrized for: B) initial water share, C) thermal conductivity ... 131
Figure 7.13.3 Numerical simulation of drying parametrized for: D) specific heat, E) apparent water transfer coefficient ... 132
Figure 7.14.1 Numerical simulation of drying parametrized for: A) sample diameter ... 134
Figure 7.14.2 Numerical simulation of drying parametrized for: B) superheated steam temperature... 135
Figure 7.15 Size distribution of particles in lignite groups (dmax=80 mm) ... 137
Figure 7.16 Individual and collective drying curves (medium lignite) ... 138
Figure 7.17 Simulated increase in calorific value of lignite due to drying at 150 oC ... 143
Figure 7.18 Dependence between carbon dioxide emission rate and thermal efficiency of exemplary power plants operating on fossil fuels ... 143
xxii
150 oC ... 146
Figure 7.20 Simulated increase of lower heating value for variable dry base coal density ... 147 Figure 7.21 Simulated increase of lower heating value for variable initial water share ... 148 Figure 7.22 Simulated increase of lower heating value for variable sample diameter ... 149
Figure A.1 Scheme of thermal conductivity measurement setup ... 172 Figure A.2 Illustration of exemplary minimization of the function of the objective ... 174
Figure B.1 Correlation of the heat transfer coefficient derived from exact and approximated
equations ... 178
Figure C.1 Relation between number of layers and the number of simulation iterations ... 182 Figure C.2 Relation between number of layers and the time required for simulation... 182 Figure C.3 Minimization of the function of the objective ... 183
Figure D.1 Surface temperature of heated dry coal sphere determined in two methods ... 190 Figure D.2 Midpoint temperature of heated dry coal sphere determined in two methods ... 190 Figure D.3 Center temperature of heated dry coal sphere determined in two methods... 191
Figure E.1 Scheme of simulation results (source file) and output files applied for graphical
representation of temperature distribution within lignite sphere ... 194
Figure E.2 Graphical scheme of operation and data organization in temperature data processing
utility ... 195
Figure E.3 Scheme of input and output data on the circular mesh (ParaView) ... 197
Figure F.1 Examples of the components used in the flowchart diagram of numerical algorithm
1
1.
CHAPTER 1
Introduction
1.1 Role of lignite in global economy
The name “coal” describes the general category of solid-state fossil fuels of significant hydrocarbon content. Although there are many classifications, from an economical point of view, two major groups of this fuel are distinguished: hard coal and lignite, also known as brown coal. Besides arbitrary and vague threshold of lower heating value, which can vary from 16.5 MJ kg-1 [1] to 28.7 MJ kg-1 [2], the major difference is related to the specificity of production and utilization of those two categories of coal.
The deliberation on structural and technological properties of coal ranks is summarized by the Hilt’s Law, which states In a vertical sequence, at any one locality
in a coalfield, the rank of the coal seams rises with increasing depth [3,4]. Hard coal is
2
vulnerability to spontaneous combustion while being stored on a stockpiles [4].
For the reasons stated above, over 95% of lignite production in particular countries is consumed domestically [1], with a prevailing model of lignite-fueled power plant situated next to or surrounded by the deposits. That specificity brings about the economic contradistinction of hard coal as an international and lignite as a regional commodity, because the price of the former is much more prone on the global trends. For instance, production cut-backs in China, the largest producer, in 2016 caused the significant increase of the spot price of hard coal after a 5-year period of steady decline of average price level on export coals [1]. Lignite is not immune to the international events in the field of economy and politics, as for example cap and trade introduced by the European Union to reduce the carbon dioxide emissions, still the local circumstances play a greater role in shaping of its market position. Among these, one can list the ownership and geographical location of the lignite complex within a domestic power system, the current level of domestic reserves or the cost of mining [5]. The relatively low value of the latter in the case of lignite, makes it an important compound of energy mixes in countries that possess its deposits.
In 2015, lignite accounted for 1.7% of primary energy consumption worldwide (the corresponding value for hard coal was 27.5%) with a cumulated value of 9.9×10¹⁸
3
Table 1.1 Countries possessing largest lignite reserves (as of 2015) [1] rank country reserves [Gt] share [%]
1 Russia* 90.7 28.6% 2 Australia 76.5 24.2% 3 Germany 36.2 11.4% 4 USA 30.2 9.5% 5 Turkey 11.0 3.5% 6 Indonesia 8.2 2.6% 7 China 7.7 2.4% 8 Serbia 7.1 2.2% 9 New Zealand 6.8 2.1% 10 Poland 5.5 1.7% - others 36.9 11.7% - total 316.8 100%
*including subbituminous coal reserves
Table 1.2 Countries possessing largest lignite resources (as of 2015) [1] rank country resources [Gt] share [%]
1 USA 1368.0 30.9% 2 Russia* 1288.9 29.1% 3 Australia 403.4 9.1% 4 China 324.9 7.3% 5 Poland 222.4 5.0% 6 Vietnam 199.9 4.5% 7 Pakistan 176.7 4.0% 8 Mongolia* 119.4 2.7% 9 Canada 118.3 2.7% 10 India 38.1 0.9% - others 162.3 3.7% - total 4422.2 100%
*including subbituminous coal resources
4
potential of the countries. The major lignite producers are pointed out in Tab. 1.3, and their share in global production is illustrated by Fig. 1.1.
Table 1.3 Leading lignite producers in 2015 [1]
rank country production [Mt] share [%]
1 Germany 178.1 17.6% 2 China 140.0 13.8% 3 Russia* 73.2 7.2% 4 USA 64.7 6.4% 5 Poland 63.1 6.2% 6 Australia 63.0 6.2% 7 Indonesia 60.0 5.9% 8 Turkey 50.4 5.0% 9 Greece 46.0 4.5% 10 India 43.9 4.3% - others 228.8 22.5% - total 1011.2 100%
*including subbituminous coal resources
5
1.2 Lignite industry in Poland
The origin of brown coal exploitation in the area of present-day Poland dates back to the 18th century. There were several mines established since 1740 in Turoszow region and 1770 became the milestone for beginning of industrial scale exploitation [6]. In the entire 19th century the lignite-abundant territories of present-day central and western Poland were under control of Prussia (Germany). The Prussian government put efforts to take advantage of available resources, founding a number of lignite mines, listed in Tab. 1.4.
Table 1.4 Lignite mines founded on present territory of Poland in the 19th century [6] name former name
(German) location established
Conrad - Witoszyn 1877
Cybinka Bach Cybinka 1864
Dzialoszyn Edward Dzialoszyn mid 19th c.
Henryk Lohser Werke Kunice Zarskie 1889
Jadwiga Gluckstern Kunice Zarskie 1890
Luban Gluckauf Zareba Gorna late 19th c.
Pustkowie Max Bodzew 1844
Sieniawa Emiliensgluck Sieniawa 1873
Slone Grunterberger
Gruben Zielona Gora 1840
Smogory Oskar Smogory 1886
Teresa - Kunice Zarskie 1897
Turow Hirschfelde Bogatynia 1836
Wiktor - Buczyce 1898
Zapomniana Joseph Hermann Trojca 1875
6
in the previous century. The major part of lignite production in the first decade after war was covered by Turow lignite mine (see Fig. 1.2), followed by several deep and opencast mines in Konin region. However, there was no power generation relying on lignite. Significant share of production was assigned to briquetting facilities or exported to German Democratic Republic, due to proximity of Turow mine to the western border.
Figure 1.2 Deposits of fossil fuels in Poland (lignite mines marked)
7
of lignite exceeded exported tonnage [7]. In 1967, Patnow power plant (1200 MW) was synchronized, constituting the Patnow-Adamow-Konin complex of three lignite-fueled plants. The second part of this triad was decommissioned in January 2018.
A remarkable step in Polish lignite industry was taken in 1980, when first batches of lignite were sent from Belchatow mine to nearby power plant. This complex shortly achieved the leading position among lignite production sites due to strategic location for domestic power system (geographical center of Poland), as well as abundant deposits. In 1988, the annual target production capacity of Belchatow mine was reached (38,5 Mt) what contributed to setting the all-time record of domestic lignite industry at 73,5 Mt [8]. In 2011 a new unit of 858 MW was appended to Belchatow power plant, what totalled its installed capacity to over 5400 MW. Due to that fact it is the largest power plant in Poland, satisfying around 20% of domestic electricity demand, and the second largest coal power plant in the world (following Taichung in Taiwan). The selected annual statistics of lignite production and its impact on power generation during the post-war era in Poland are gathered in Tab. 1.5.
Table 1.5 Utilization of lignite in Poland on selected years between 1945 and 1990 [7]
8
After the fall of communism in Eastern Europe accompanied by economic transformation of 1989, lignite retained its important role in Polish energy mix. Still, due to overall changes in domestic industry, Poland was able to overfulfill the commitments of Kyoto Protocol, achieving 30% decrease of greenhouse gases emission on the period of 1990 – 2008, having been committed to one fifth of this value [9]. Over the last couple of years the share of lignite in Poland’s electricity generation has been slightly declining, what also concerns hard coal. In 2016, out of total 164.6 TWh of consumed electricity, 51.2 TWh was covered by domestic generation in lignite power plants. The major cause for decline in coal role in the energy mix is the increasing share of renewable energy sources, what is forced by regulations of the European Union aiming at further reduction of carbon intensity. That trend does not concern another fossil fuel – natural gas. The reasons might be connected with commissioning of LNG terminal in Swinoujscie in 2015, what reduced the dependence on import from Russia, and the necessity of increasing the flexibility of the system that increases the share of unstable renewable energy sources.
Table 1.6 Electricity generation in Poland [10]
category 2014 2015 2016
total production 98.6% 100.2% 98.8%
professional power plants 88.4% 87.9% 85.5%
water 1.6% 1.4% 1.5%
conventional heat 86.8% 86.5% 84.0%
hard coal 50.6% 50.7% 49.4%
lignite 34.2% 33.2% 31.1%
gas 2.1% 2.6% 3.5%
wind power plants and other renewables 4.6% 6.3% 7.1%
industrial power plants 5.7% 6.0% 6.2%
transborder exchange 1.4% -0.2% 1.2%
total consumption [% / GWh] 100.0% 100.0% 100.0%
9
The details of lignite production and its influence on power generation in Poland are given in Tab. 1.7. It includes the list of Polish lignite mines, matched with the power plants that are fueled with their output. Out of 60 million tons extracted in Poland in 2016, Belchatow mine accounts for roughly 2/3 of the total value. It is followed by Konin opencast mine which supplies fuel to three surrounding plants: Konin, Patnow I and Patnow II. Together with Adamow power plant, that ended operation in January 2018, they belong to Zespol Elektrowni Patnow-Adamow-Konin S.A (ZE PAK) company. Meanwhile, Belchatow and Turow are owned by the largest Polish power company, Polska Grupa Energetyczna S.A. (PGE) which besides production of electricity is active in the field of distribution and trade. Note that lignite-fueled power plants scored in 2016 the highest capacity utilization rate among various types of power generation industries of average 5400 hours per annum. Meanwhile, power plants fueled with hard coal attained the mean result of 4200 hours per annum and combined heat and power plants worked for average of 3900 hours during the entire 2016 [11].
Table 1.7 Polish lignite mines and power plants [11–14]
mines power plants
11
2.
CHAPTER 2
Technology of coal drying
2.1 Moisture in lignite
2.1.1 Structural and thermodynamic classification
As indicated in the previous chapter, lignite has an important position in energy mixes of numerous countries. Still, due to elevated content of water (30-70% of a raw mass), its utilization is undermined in terms of economical calculation and environmental impact. To overcome this obstacle, drying of brown coal is frequently applied. The design or selection of the drying system appropriate for the particular material should rely on the knowledge about the nature of moisture stored within coal structure as well as its interactions with the solid matter of the fuel.
According to various research [15–17], several types of water may be distinguished in lignite, regarding to the circumstances of their structural occurrence, and therefore, manners of their removal. The desorption of each type depends on relative vapor pressure next to the surface of moisture layer. One of possible moisture classifications is presented in Tab. 2.1.
12
with bulk water is subject to an uninhibited desorption at a certain constant value of latent heat of evaporation. For the purposes of this study, moisture satisfying this criterion is classified in general as free water.
Figure 2.1 Types of water in lignite
13
stabilized layers is classified in this study as bound water, which contains also partially water stored in narrow capillaries. Some researchers also mentioned moisture held in a closed pores which can only be removed following the destruction of surrounding structures [21] or so-called non-freezing water which does not turn to solid phase during coal analysis by means of differential scanning calorimetry (DSC) [22] or nuclear magnetic resonance [23]. The simplified chart of water types from Tab. 2.1, relating to classification used in this study is shown in Fig. 2.2.
Table 2.1 Classification of water in brown coal [15]
water type relative vapor pressure range p/p0 approximate
classification share description
bulk 0.96 to 1.0 free water 63.7%
regular liquid condensed on or between coal particles capillary 0.5 to 0.96 free/bound water 27.5% moisture condensed in capillaries
multilayer 0.1 to 0.5 bound water 4.8%
weakly
hydrogen-bounded water on the monolayer surface
monolayer below 0.1 bound water 4.0%
water on interior coal surface, constituted
relying on strong hydrogen-oxygen bonds
2.1.2 Technological aspects
14
Figure 2.2 Evaporation heat demand in regard to water types (data from [15] included)
The negative influence of considerable moisture content is observable as soon as during the storage and transportation of mined fuel. In countries, where temperatures below 0 oC are reported, the problem of freezing arises. Not only does it hinder the fragmentation of coal into transportable batches, but due to volumetric expansion accompanying ice formation, the devices serving to bring coal from the excavation site to the power generation unit may be subject to damage [20].
15
condensation and wetting processes release self-heat in coal, what leads to increase in its temperature and consequently to growth of oxidation rate [15].
The processes of fuel preparation are also undermined by water in coal, which decreases the friability of the rock. Thus, the efficiency of coal grinding prior to further utilization is reduced, making the preparation workload higher [18].
The major concern, however, related to significant water share in lignite is connected with calorific value. Both sensible and latent heat of water diminish the energy output from the fuel by 20-25% [26]. As a consequence, higher fuel input is required to generate a certain value of electricity, comparing to bituminous coal. As a consequence, more flue gas is produced, increasing the atmospheric concentration of carbon dioxide. According to some studies, reduction in water share from 60% to 40% may entail decline in CO2 emission per generated electricity by 30% [27]. This matter is
especially important for the national power systems, which recently are often obliged to keep up with the emission caps set for greenhouse gases by international organizations, such as the European Union or United Nations [28,29].
16
2.2 Available methods of coal drying
As it was justified in section 2.1.2, moisture in brown coal poses a vital threat for its applicability in the power generation industry. Among different methods of lignite upgrading, dewatering and drying are frequently used as primary fuel preparation or preliminary treatment before advanced coal utilization such as liquefaction, gasification, briquetting etc. In Fig. 2.3, the selected major methods of drying are presented within the classification of coal upgrading.
17
Note that particular techniques may be applied in a combined manner for the sake of the optimized effectiveness. The technology of dewatering is adjusted to the type of the input (slurry, lumps, fine coal) and the further step of utilization (combustion, gasification etc.).
2.2.1 Evaporative drying
Rotary drying is a developed technology and the most commonly used for low-rank coal upgrading. This method is used in rotary-tube and rotary-drum dryers. The latter utilizes a direct heat transfer, where a hot flue gas, at over 350 oC, flows through coal or an indirect heating scheme, in which a central chamber is surrounded by a concentric pipes of heat exchanger. Due to lack of interaction of gaseous medium and coal, various fluids, for instance hot steam, may be applied in this scheme. The typical consumption of heat for drying is around 3.7 MJ per kilogram of wet material [18]. Rotary-tube dryer uses steam of temperature below 200 oC. Due to improved exchange of heat, the heat transfer coefficient may be 2-3 times larger than in case of rotary-drum solution [20]. What is more, its heat consumption is around 3 MJ kg-1 [18]. Rotary drying system usually operate on coal particles of the size order of 10-1 - 10-2 m. In general, direct drying requires strict control and limitation on oxygen content within the drying medium to prevent the hazard of ignition [20].
18
budget. Around 3.1 MJ of heat input is required for drying of 1 kg of the material [18]. The basic feature of solar dryers relates to the general characteristics of renewable energy sources, to which solar energy can be assigned: it is free, but moderately foreseeable. Solar drying is in fact the ancient method of dewatering, applied from conservation of food to manufacturing of construction materials. The solar dryers applied in non-industrial drying of food or timber commonly and purposefully take advantage of the stack effect, thanks to which hot air is driven from the bottom to the top of the device, enhancing the convective heat transfer [31]. As to brown coal drying, the efforts were made in Latrobe Valley, Australia, to produce an aqueous slurry of fine (10 μm) grinded lignite, which was subsequently driven into a pond to dry in the sun. Due to slow drying accompanied with shrinkage, the compact hard lumps of brown coal were produced in that process [15].
19
microwave dewatering of coal, the increase of dried particle size enhanced the drying rate and contributed to reduction in the drying time, what is an inverse correlation, regarding those observed in traditional methods of convective drying [33].
When fragmentation of coal is required, what is often the case in electricity generation, mill drying is frequently applied to produce pulverized coal. In terms of dewatering, it utilizes the heat of friction combined with enthalpy of hot flue gas that is driven from the boiler. The mill dryers are relatively easy in construction and operation, often formed in cylindrical shape and grind coal using numerous metal balls (30-80 mm in diameter) or beaters (4-10 kg per each) [25]. Due to short residence time of coal in the dryer (order of seconds), the substantial moisture reduction is achieved when the particles are crushed to 1 mm or less [15]. The heat input of mill dryers operating on brown coal, ranges between 4 and 14 kWh per 1 Mg of fuel [25].
Hot oil drying is a technique, which bases on immersion of wet material in the oil bath of temperature higher than required for water evaporation. The occurrence of water boiling induces high turbulent flow along the material surface what contributes to the rapid removal of significant amount of both surface and inherent moisture. Due to alike mechanism of heat transfer, this technique is also known as “fry drying” [20]. Oil immersion drying was experimentally applied to Indonesian low-rank coals, resulting in reduction of water share from 32 to 2-3% and doubling of the initial heating value of 12.5 MJ kg-1 [34]. An interesting feature of oil drying is formation of the hydrophobic film within coal that reduces the readsorption of water during the storage. The absorption of oil in coal may increase its calorific value, however, it raises the costs of dryer operation, depleting the stock of drying medium [25].
20
particles of coal float on the upstream which prevents them from falling down. The available drying mediums blowing through this dynamic suspension are hot air, gaseous combustion products or steam. Incline in the fluidization velocity was found to enhance the speed of drying of Australian brown coal mined in Loy Yang [35]. Various aspects of the fluidized bed technique have been investigated in experimental and analytical studies for coals from numerous geographical locations, including USA, China, Greece or Poland [36–39]. In case of the latter, a study has been prepared recently for fluidized spouted bed operating on Belchatow lignite and supplied with low temperature heat source (50-60 oC), which produced the output fuel of water share at 15-20% [40]. The heat demand for drying of 1 kg fuel is in range of 3.1-4.0 MJ for fluidized bed drying [41]. This method of drying has been frequently combined with superheated steam as a drying medium. The latter will be discussed in separate section.
2.2.2 Non-evaporative dewatering
The methods of non-evaporative drying commonly apply increased pressure level in order to prevent moisture from evaporation and save its heat of vaporization. The pioneer of non-evaporative fuel drying was Hans Fleissner who invented the method, utilizing both high pressure and vacuum [42]. At first, highly-pressurized steam interacts with a lump of brown coal. As its temperature rises, the water is being expelled from the inside, due to the pressure, in the liquid state. When the water leaves, the lignite shrinks. When the pressure is decreased, an additional amount of moisture is removed by flash evaporation, which lowers the temperature of the lump. The method has been utilized and modified in many applications worldwide [15]. Its energy consumption per mass unit fuel using superheated steam is estimated even below 1.75 MJ kg-1 [41].
21
expression (MTE) technique, invented to lift the efficiency of German brown coal plants [43]. The idea of this method extends the Fleissner process. Lignite is fitted in the form, heated to around 200 oC and compressed by the hydraulic press, what drives the moisture out of the material to be collected by the output tanks. Final part of the process involves cooling, accompanied with flash evaporation. The optimal results of dewatering were obtained for pressure of 6 MPa. Mechanical thermal expression became in the range of interest of Australian government, considered appropriate for coal pre-drying in IGCC (integrated gasification combined cycle) [24].
Hot water drying (HWD) is a process of non-evaporative dewatering, product of which is a quasi-liquid fuel. The moisture is expelled from the internal structure of brown coal by carbon dioxide produced in decomposition of functional groups at temperatures of 240 oC and higher. Oils and tars from the decarboxylation mix with aqueous solvent on the surface of coal and are claimed to form a coating that limits the moisture readsorption after drying finishes. The method is applied to produce low-rank coal-water fuels (LRCWF) [25].
The very high reduction of water share, exceeding 90% of the initial level, can be obtained by solvent extraction method. In this technique, coal is placed within the stream of the solvent, which under the influence of increased temperature binds with the reactive compound and leaves the original rock. Several solvents has been tried, such as tetrahydronaphthalene, methylnaphthalene, supercritical carbon dioxide and liquefied dimethylether (DME) [44–47].
22
2.3 Superheated steam drying
Superheated steam drying (SSD) is classified as an evaporative thermal method of removing moisture from wet materials. The nature of vapor as a high temperature gas without free oxygen molecules and at the same time very easy to be produced (contrarily to e.g. nitrogen) brings about the supposition of the beneficial drying medium that reduce the spontaneous ignition hazard. However, probably due to the paradoxical idea of removing a form of water with another form of water, drying by means of steam was not under consideration until late 19th century.
In 1903, Hausbrand wrote a book, which German title might be translated as The
Drying with Air and Steam [50]. Wenzel and White in 1950s compared drying of
granular solid object with air and humidified air, coming to the conclusion that vapor in air not only does not affect the general characteristics of the drying process, but might be even beneficial, providing higher drying rate and thermal efficiency than in the case of pure air-blown conditions [51]. Studies of Yoshida and Hyodo supported this claim, proposing and validating the idea of the inversion point [52]. This term relates to the temperature above which, at the certain conditions (humidity, pressure, geometry), the drying rate for steam as a medium is higher than in the case of air. Kiiskinen and Edelmann [53] found that drying of paper with jet streams of superheated steam at 300
o
C is performed at 26% higher rate than in the case of air at the same temperature, however power output of the fans was higher by 150% for superheated steam. Though in general the dewatering rate is higher for air in low temperatures and for steam in high temperatures, the inversion point can be lowered to benefit from steam drying without large energy expenditures [54].
23
utilization of the latter in a combination with fluidized bed dryer was proposed with regard to coal upgrading by Potter et al. [56,57]. They obtained encouraging coefficients of heat transfer ranging around 300 W m-2 K-1 [58]. Such high values of superheated steam fluidized bed drying (SSFBD) promote the decline in the size of the drying equipment. Association of SSD with fluidized bed has been investigated by studies focusing on increasing lignite applicability in electricity generation operating on pressurized steam of temperature range 180-260 oC [59,60]. This studies also took issues of shrinkage and equilibrium moisture content into account. According to some research, which tested a fluidized bed drying of pulverized coal, the capital cost was reduced by 20% and the total energy by 15% when air was replaced by superheated steam [54]. Another study by the same authors claimed that for decreasing the water share of activated carbon pellets from 50 to 2% in fluidized bed might bring 40% cost reduction of SSFBD in comparison to conventional air drying [54]. According to Woods et al. who discussed steam drying of 1-13 mm coal particles, the residence time of drying does not affect the volatilization, unlike hot air drying. They found out that for SSD the period of constant drying rate is 6-7 times longer and the heat transfer rate 1.7-2 times higher than for drying in air atmosphere. This manner of drying might be suitable to deliver high quality fine-graded fuel to emerging power generation technologies, such as IGCC. Although it operates currently on the pulverized bituminous coal [61], the raise in calorific value, combined with significant volatile matter content which facilitates gasification, might contribute to some breakthrough in development of this highly efficient system of electricity generation.
24
and compress it, before directing it to the heat exchanger which supports the operation of the dryer. By that means not only the latent heat loss, but also sensible heat loss might be reduced. The idea of latent heat recuperation was also utilized in the industry. German power company RWE introduced a WTA (Wirbelschichttrocknung mit interner
Abwärmenutzung) technology that utilizes SSFBD to enhance the quality of brown coal
prior to its combustion [63]. The scheme of installation is presented in Fig. 2.4. The moisture expelled from the dried lignite is slightly superheated and compressed before turning back to the heat exchanger in the fluidized bed dryer. After depressurization, along with the hot condensate it also passes through the preheater, which is applied to increase the initial temperature of lignite prior to drying. With utilization of this technology, the water share in lignite is reduced from 55-60% to around 12% [18].
25
In Fig. 2.5 the general idea of latent heat recuperation is presented regarding to scheme from Fig. 2.4. The major benefit of such a configuration is utilization of the latent heat of the phase change in order to limit the energy input to the dryer. Also, some savings are made on the preheater which utilizes the heat of a condensate to raise the temperature of the raw coal.
Figure 2.5 Simplified scheme of latent heat recovery
26
SSD [65]. Power engineering also reached for the superheated steam drying models, what resulted in the numerical analysis of the combined heat and power plant fueled by corn ethanol [66] as well as the self-heat recuperative fluidized bed dryer of biomass, which consumed 95% less energy than conventional systems [67].
In Tab. 2.2, the benefits and drawbacks of superheated steam drying are listed. The characteristics refer especially to the system configured to recuperate heat of evaporation.
Table 2.2 Characteristic features of superheated steam drying [54]
advantages disadvantages
no hazard of oxidation or ignition
higher drying rate over the inversion point than for hot air drying
relatively low flow of the drying gas
possibility of latent heat recovery
high complexity of the system
necessity of leak control
considerable cost of auxiliary devices
2.4 Modelling of coal drying
27
The study described above, found a follow-up in another investigation performed by the same research group [69]. The content revolved around modelling the work of fluidized bed dryer. In the first paper, a mathematical model was developed for the drying of a single porous particle in steam. In the second one, the single particle model has been integrated with a two-phase hydrodynamic model to simulate the continuous drying of coal in a bed fluidized with superheated steam. Besides aspects related to engineering approach, such as variation in the superficial gas flow, inversion temperature or residence time, the model incorporated phenomena of initial condensation during the heating period and growth in temperature accompanied by decline in moisture content with residence time in drying bed. The authors conclude that “the most significant operating variables are the steam-tube duty and the initial moisture content of the wet coal”.
28
Olufemi and Udefiagbon [71] modified the kinetic parameters of the drying process. They also included deliberation on particle shrinkage. The experimental results of Victorian (Australia) lignite drying applied to validate the numerical model were taken from the study of Looi et al. [70]. The study also adapted receding core model with evaporation of water at the boundary of wet and dry regimes. However, the mathematical model involved also the term for shrinking volume of the particle. Description of the process by partial differential equation was solved numerically with the finite element analysis, as the opposition to previously applied finite difference analysis. The latter one relied on rectangular, while the former approximated the solution using triangular mesh. The geometry can be simplified to circular cross-section of the sphere. Approaching the numerical problem with triangular mesh in this case provides greater accuracy of the results, due to better matching of nodal points, especially on the sample surface. Although authors claim to have received perfect consistency between simulated and experimental results, the distribution of empirical data points assumed in this work might be misleading. The density of experimental measurements along the time scale is significantly lower than in the source of those data [70], making the imaginable shape of experimental curve somewhat different from the original. However, it should be noted that the reason might be related to imperfect experimental attempts rather than numerical solution.
29
simulated drying curve appeared less convex than the results obtained in the experimental part of the study.
Zhang and You [72] investigated drying of Chinese coarse lignite particles. They conducted empirical attempts using hot air at a velocity of 0.7 and 1.5 m s-1 and temperature of 100 and 140 oC. Simultaneously they derived a mathematical model of drying, assuming multiphase flow of air and water in the porous structure of coal, combining convection of the free water and diffusion of the bound water. The model was successfully validated with regard to experimental results and used to discuss the influence of such conditions as particle diameter, gas temperature, relative humidity and drying medium velocity on the drying characteristics.
31
3.
CHAPTER 3
Goal of the thesis
Lignite is the second most important source of primary energy for electricity generation in Poland, what was indicated in chapter 1. Despite the general tendency of reducing the share of fossil fuels in energy mixes of highly developed countries, the decline in coal use in Polish energy sector over the last years is very slow and no forecasts predict the acceleration of this gradual shift in the next decades [76]. Besides rich domestic reserves, relatively low potential of renewable energy sources [76] combined with prolonged and uncertain efforts to introduce nuclear power plant [77– 79], secure the leading position of coal in the Polish electricity generation.
However, due to ageing power stations [80] and international schemes of combating the CO2 emission [28,29], the demand on introducing highly efficient
industries operating on lignite is constantly rising. Effective dewatering of this moisture-abundant fuel is one of the preconditions for satisfying the need formulated in such a way. As mentioned in chapter 2, the application of superheated steam, especially in the configuration enabling the recovery of water-vapor phase change heat, emerges as an opportunity to raise the quality of coal and gain benefits in the fields of economy, environmental protection and energy security. Pikon and Mujumdar claimed that
32
drying conditions will need to be optimized for specific grades of coal and also the utilization of the product [25]. However, the literature concerning the drying properties
of lignite from Polish deposits is limited [39,40] and no extensive coverage had been reported so far. Hence, researching the fundamental properties related to superheated steam drying seems well grounded for prospective types of lignite to be upgraded using this branch of drying technology.
33
4.
CHAPTER 4
Methodology of experimental procedure of lignite drying in
superheated steam
4.1 Lignite samples
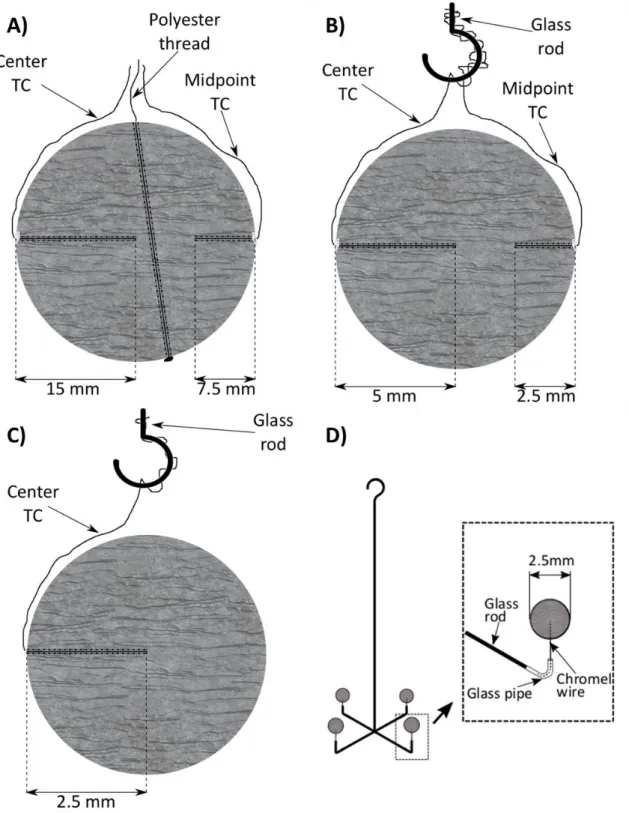
All lignite samples used in the experimental procedure were cut out by knife from a randomly chosen lignite block as a coarse particles and smoothed in order to obtain the required size. Accurate preparation was achieved by rolling the lignite on a metal plate with round holes of decreasing diameter (Fig. 4.1). The precise size of the holes was provided by cutting them in an electric discharged machining process.
Figure 4.1 Scheme of preparation of the experimental samples
34
Table 4.1 Dimensions of samples used in the experiment sample diameter relative diameter relative area relative volume relative mass (experimental average) d [mm] d/d2.5 A/A2.5 V/V2.5 m/m2.5 2.5 1 1 1 1 5 2 4 8 7.85 10 4 16 64 65.78 30 12 144 1728 1765.76
According to the relative values, the volume of samples can vary over three orders of magnitude. From the statistical point of view, taking averaged density as a factor, the mass relation should be analogical. They exhibit slight deviation from the expected relative value, though. Lignite belongs to organic-rich sedimentary rocks. Moreover, it is classified as a low-rank coal, which means the coalification processes did not progress as highly as in anthracite or even bituminous coal. Therefore, the structure of this fuel is strongly heterogeneous, with visible insertions of plant matter.
4.1.1 Sample of 30 mm
The initial weight of the particle of 30±0.05 mm in diameter was approximately 17-17.5 g. In the object prepared in the manner described two holes were made with a 0.3 mm drill: 15 mm and 7.5 mm in depth, respectively. Inside each drilling a K-type thermocouple was placed to allow for temperature measurement in the central point (referred to as “center”) as well as the halfway point between the surface and the center of the sample (“midpoint”). The thermocouples fulfilled the Japan Industrial Standard Class 2 with temperature deviation ±2.5 o
35
of the thermocouples, an adhesive ceramic agent was put near the orifice of both drillings to ensure a stable position for the wires inside the sample.
The polyester thread, passed through the sample interior and fixed by the knot on the bottom side, was used to suspend the sphere in the test chamber. Its hydrophobic properties prevented the water absorption which would disturb the measurement of the weight. The object prepared for the examination is visible in Fig. 4.2.A.
4.1.2 Sample of 10 mm
The result of polishing the coarse particle into 10±0.05 mm sphere was an object of around 0.6-0.7 g in weight. The drill used for the thermocouple installation was thinner: 0.2 mm. However, the idea of temperature measurement was realized in an analogical way: in the midpoint and center, which in that case lied 2.5 mm and 5 mm below the surface, respectively. The K-type thermocouples, prepared from chromel/alumel wires of 0.08 mm in diameter were insulated and fixed to the orifice in the same way as for the largest sample.
In case of 10 mm sample, the mass of the sample was low enough, not to require additional hanging thread – it was suspended on two thermocouples only. On the other hand, to stabilize the position of the particle inside the test chamber and reduce the impact of fluid flow on the weight measurement, the thermocouples were rolled on a thin glass rod, that carried the sample weight onto an electronic balance. The results of the preparation is visualized schematically in Fig. 4.2.B. Figure 4.3 presents the photograph of a 10 mm sample prepared for the examination.
4.1.3 Sample of 5 mm
36
thermocouple, which tip measured the temperature 2.5 mm inside the sphere, in the geometrical center of the particle. The wire was curved and inserted from side to the lignite. For the sake of low mass of the sample, no adhesive agent was needed to stabilize the connection between wire and coal.
Besides above-mentioned differences, the preparation of 5 mm object did not differ from 10 mm sphere. The particle ready for the experiment is shown in Fig. 4.2.C.
4.1.4 Sample of 2.5 mm
The sample of 2.5±0.0069 mm was characterized with by far the lowest mass of the entire set, around 0.01 g (10 mg). In order to neutralize influence of electronic balance sensitivity on the results (±0.1 mg), four samples were dried altogether, increasing the weight of the examined object.
37
38
Figure 4.3 Sample of 10 mm ready for the test (white adhesive agent visible on sides).
4.1.5 Variability of the samples
The natural diversity of lignite structure mentioned in section 4.1 was examined by gaining insight into the individual features of the samples used in the experiment. Over 120 drying tests conducted for each of 4 sizes were taken into consideration.
39 w 0 w i i c m WP m m (4.1)
Note that in certain cases of this work, an indicator of water share (WS) is used, which denominator refers to the present mass of the sample, thus, including the instantaneous mass of water: w w i i i c m WS m m (4.2)
Figure 4.4 Correlation between density and initial water percentage of the samples
40
picked lignite particles, which is vastly enhanced with a decline in the sphere size. Therefore, the investigation of large objects, as more representative for the specific coal seam, is substantiated.
In the case of 2.5 mm samples the tendency described above does not apply. Those samples were weighed and dried in groups of four, thus, statistically, the deviation of their parameters is neutralized.
Table 4.2 Initial values of density and water percentage
diameter
d [mm]
initial density
ρ0
[kg m-3]
initial water percentage
WP0 [mass%] average value RSD average value RSD 2.5 1.187 4.6% 51.18% 7.7% 5 1.167 10.2% 50.01% 9.6% 10 1.222 5.3% 51.39% 7.3% 30 1.215 2.5% 52.86% 5.9%
4.2 Experimental setup
41
Figure 4.5 Scheme of experimental setup
The supply of steam to the test section was realized through the water line, which started at the pure water tank. Water was transported by liquid delivery pump, which drew it out from the tank, passed through the degasser and driven to the evaporator. There it was turned to steam. The steam run through the pipe of the superheater, located over the test section. The evaporator was equipped with two heaters: one placed around its enclosure and the other inside the vessel core, while the superheater was wrapped by the heating wire along its entire length.
Table 4.3 Commercial resources used for drying or measurement
item producer/model
video camera HDRCX170, SONY
thermography camera R-300, NEC/Avio
black body spray THI-1B, Tasco Japan
polymethylpentene film Japanese Consumers’ Cooperative Union
electronic balance HR-200, A&D
degasser DGU-20A3, Shimadzu Co. Ltd.
42
The superheated steam was supplied into the top part of the test cylinder through a baffle plate. That solution aimed for a maximal possible dispersion of the steam in the entire volume of the vessel. At the bottom of the test chamber, a fan exhausted the gas from the drying system. Another fan was located next to the top of the cylinder in order to draw out the minor part of the steam (3-5% of the total amount) which was leaking through the orifice. Such implementation was applied in order to control the pressure inside the cylinder and thus, ensure the laminar flow and atmospheric condition. The orifice itself was used to pass the thread on which the sample was hanged into the test section.
During the experiment, the data on sample weight and temperature were continuously collected. Basing on this information, the drying characteristics were constructed.