Analysis of Mechanisms of Growth Suppression
by Inhibition of Stearoyl CoA Desaturase and
Glutamate Cysteine Ligase in Cancer Cells
内容記述
この博士論文は内容の要約のみの公開(または一部
非公開)になっています
year
2020
その他のタイトル
癌細胞においてステアロイルCoA不飽和化酵素又は
グルタミン酸システインリガーゼの阻害により誘導
される増殖抑制の作用機序の解析
学位授与大学
筑波大学 (University of Tsukuba)
学位授与年度
2019
報告番号
12102甲第9462号
URL
http://hdl.handle.net/2241/00160453
Analysis of Mechanisms of Growth Suppression by Inhibition of Stearoyl CoA Desaturase and Glutamate Cysteine Ligase in Cancer Cells
January 2020
Analysis of Mechanisms of Growth Suppression by Inhibition of Stearoyl CoA Desaturase and Glutamate Cysteine Ligase in Cancer Cells
A Dissertation Submitted to
the Graduate School of Life and Environmental Sciences, the University of Tsukuba
in Partial Fulfillment of the Requirements
for the Degree of Doctor of Philosophy in Biological Science (Doctoral Program in Biological Sciences)
i Table of contents Abstract ... 1 Abbreviations ... 5 General Introduction ... 9 Figures ... 17 Part II ... 20 Abstract ... 21 Introduction ... 22
Materials and Methods ... 24
Results ... 31 Discussion ... 33 Tables ... 37 Figures ... 42 General Discussion ... 50 Figures ... 60 Acknowledgements ... 62 References ... 64
2
Human stearoyl CoA desaturase (SCD), that converts saturated fatty acids (SFAs) to monosaturated fatty acids (MUFAs), has been reported to be a target of anti-cancer therapy. The clinical benefits of SCD inhibitors in cancer treatment, however, have not yet been shown in clinical studies. Although reduction of desaturation of several free fatty acids by SCD inhibition has been reported, a comprehensive analysis of changes in the ratios of unsaturated/saturated fatty acids and the mechanism by which SCD inhibition induces the suppression of growth of cancer cells have not been fully investigated. In addition, the potential of a novel small molecule SCD inhibitor T-3764518 in SCD enzyme inhibition and tumor growth suppression has not been fully reported.
Glutathione is one of the anti-reactive oxygen species (ROS). The rate-limiting enzyme in the glutathione biosynthesis pathway is glutamate-cysteine ligase (GCL). A GCL inhibitor, buthionine sulfoximine (BSO), has been tested in a clinical study, however, its benefits have not been proven. The types of cancer that are sensitive to GCL inhibitors and indexes for the stratification of the sensitive population have not been identified. Moreover, the effects of GCL inhibition on cancer cell survival and the undergoing mechanisms have not been fully understood. In this thesis, I have elucidated the effects of inhibition of SCD and GCL on cancer cell survival and the undergoing mechanisms.
In part I of this thesis, I conducted in vitro and in vivo analyses to elucidate the anti-tumor potential of T-3764518 and the effects of SCD inhibition on cancer cell survival. In the colorectal cancer cell line, HCT-116, growth suppression by T-3764518 was observed with the IC50 values of 1−2 nM indicating in vitro
SFA itself suppressed the growth and MUFA attenuated the effects of SCD inhibition indicating an imbalance between SFAs and MUFAs in form of excessive SFAs and too few MUFAs is critical for growth inhibition by SCD inhibition. After oral administration of 0.3 mg/kg of T-3764518 twice in HCT-116 xenograft model, the compound was found to be distributed in the tumors at concentrations of > 100-fold of the IC50 values of
in vitro growth inhibition. In this model, T-3764518 showed significant anti-tumor efficacy at a dose of no less than 0.1 mg/kg indicating its in vivo anti-cancer potential. Comprehensive analysis of the changes of unsaturated/saturated fatty acid ratios by SCD inhibition in vitro along with a xenograft model revealed that the ratios of lipid species, such as phosphatidylcholine constituting plasma membrane were decreased.
In part II of the thesis, I analyzed the effects of GCL inhibition on cancer cell survival and its mechanisms. BSO inhibited the cellular generation of glutathione and cell proliferation in a concentration-dependent manner. The effects of growth inhibition by BSO were attenuated by N-acetylcysteine, which provides cysteine to the cells, and a derivative of glutathione indicating that the growth inhibitory effects were induced by the suppression of cellular glutathione. The mechanism analysis of the growth inhibition using pancreatic cancer Panc-1 cells revealed that lipid peroxidation was induced by GCL inhibition and the growth inhibition was enhanced by the addition of iron and attenuated by ferrostatin-1. This signified that GCL inhibition induces non-apoptotic and non-necrotic cell death, ferroptosis.
Kidney and pancreatic cancer were sensitive in the cell panel study using 21 cancer cell lines. Analysis of the correlation between cellular GSH and BSO sensitivity showed that the cancer cells with lower glutathione levels tended to show higher GCL sensitivity suggesting that cellular glutathione might be a
4 sensitivity marker of a GCL inhibitor.
Taken together, these results of the studies in the thesis indicate that qualitative maintenance of lipids in terms of oxidation and desaturation plays critical roles in cancer cell survival.
6
ACC acetyl CoA carboxylase
ATF-4 activating transcription factor 4; eIF2α, eukaryotic initiation factor 2α
ATP adenosine triphosphate
BiP immunoglobulin heavy chain-binding protein
BODIPY boron dipyrromethene
BSA bovine serum albumin
BSO buthionine sulfoximine
cDNA complementary deoxyribonucleic acid
CHOP CCAAT-enhancer-binding protein homologous protein
DG Diacylglycerol
ER endoplasmic reticulum
FAC ammonium ferric citrate
FASN fatty acid synthase
GAPDH glyceraldehyde 3-phosphate dehydrogenase
GCL glutamate-cysteine ligase
GCLC glutamate-cysteine ligase catalytic subunit
GCLM glutamate-cysteine ligase modifier subunit
GSH reduced glutathione
GSS glutathione synthase
GSSG glutathione disulfide
KD knockdown
IC50 half-maximal inhibitory concentration
mRNA messenger ribonucleic acid
MUFA monounsaturated fatty acid
NAC N-acetyl cysteine
OA oleic acid
p.o. per os
PA palmitic acid
PARP1 poly (ADP-ribose) polymerase 1
PC phosphatidylcholine
PERK protein kinase RNA-like endoplasmic reticulum kinase
POA palmitoleic acid
PRX Peroxiredoxins
PUFA polyunsaturated fatty acid
ROS reactive oxygen species
SA stearic acid
8 SCD5 stearoyl-CoA desaturase-5
SFA saturated fatty acid
10
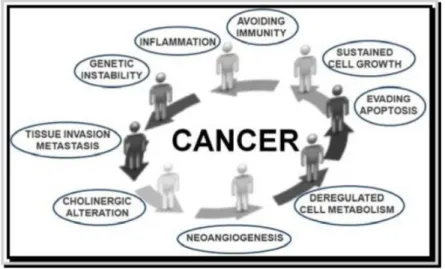
Metabolic alterations in various diseases including immune-related diseases, chronic kidney disease, and cardiac diseases have been reported (Ettcheto et al.,2019; Sudhakaran et al., 2018; Aldana, 2019; Viola et al., 2019; Smolders et al. 2019). These metabolic alterations in addition to angiogenesis, genomic instability/mutation, cell death, growth signal are thought to be the hallmarks of cancer (Figure 1) (Russo et al., 2015). Glycolysis, glutamic acid metabolism, oxidative pentose phosphate pathway, and TCA cycles are classical cancer metabolic pathways (Boroughs et al., 2015). Recently, novel pathways including redox homeostasis, lipid metabolism, and micropinocytosis are receiving attention. In this thesis, I focus on the lipid metabolism pathway and redox homeostasis.
In the lipid metabolism pathway, lipid oxidation functions in the upstream of ATP generation and lipid biosynthesis pathways produce macromolecules consuming ATP (Figure 2). Both these pathways are reported to be upregulated in cancer. As mammalian cells are not able to produce PUFAs (Liu et al., 2015), they are obtained from the diet. Tumor cells are thought to be highly dependent on lipid biosynthesis (Gu et al., 2013). The major organs in mammals are provided with lipids through FFAs and lipoproteins (Gu et al., 2013). Among the C11-20 long-chain fatty acids, C16 and C18 lipids are the most abundant in the mammalian cells (Gu et al., 2013).
Lipid biosynthesis is upregulated in cancer (Mashima et al., 2009). The first step of the pathway is the conversion of acetyl-CoA to malonyl-CoA by acetyl CoA carboxylase (ACC) (Wolfgang et al., 2006). Malonyl-CoA is used by fatty acid synthase (FASN) to generate palmitic acid (Rui et al., 2014). The carbon chains of palmitic acid are elongated by elongation of very-long-chain fatty acids proteins (ELOVLs) to
generate long-chain fatty acids (>16 carbon-chains) (Rui et al., 2014). ACC and FASN in the lipid biosynthesis pathway have been reported as therapeutic targets of cancer. In this thesis, I focus on SCD that functions in the downstream of these enzymes.
There are two isoforms of SCD (SCD1 and SCD5) in humans, and both these isoforms are reported to be related to cancer (Sinner et al., 2012; Scaglia et al., 2008; Angelucci et al., 2018). Mice have five isoforms of SCD that are 60−80% identical to human SCD1/5 in terms of the amino acid sequences (Lengi et al., 2007).
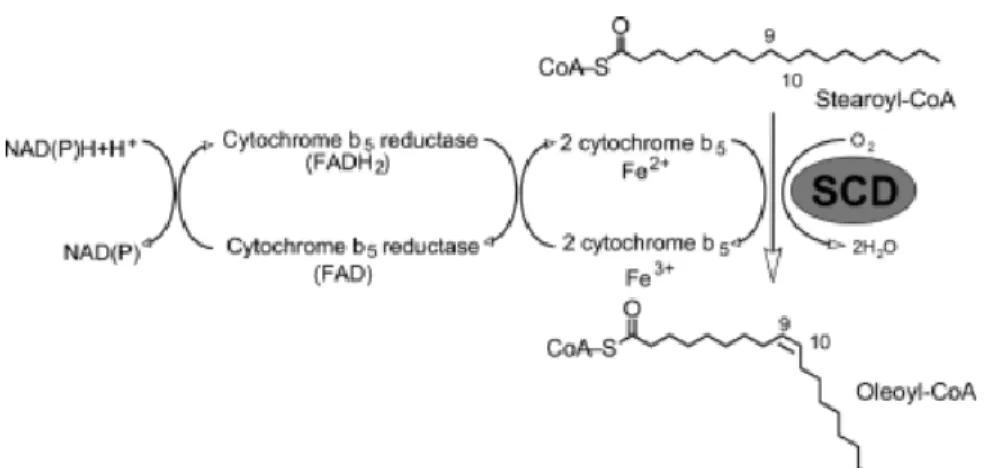
SCDs use palmitic acid as a substrate and convert it to a MUFA (Evans et al., 2002). SCDs add a cis double bond in the Δ9 position of an SFA (Nagao et al., 2019; Paton et al., 2009) (Figure 3). Ferrocytochrome-b5 functions as an electron carrier in the SCD reaction (Oshino et al., 1971). An enzyme that saturates MUFAs in mammalian cells has not been reported. SCDs have four transmembrane domains and are localized in the ER membrane (Nagao et al., 2019), while their catalytic sites face the cytoplasm.
The expression of SCDs and other enzymes in the lipid biosynthesis pathways including ACC and FASN are regulated by SREBP-1c (Strable et al., 2010; Du et al., 2012). SCD1 is highly expressed in adipose tissues in adults. Low-level SCD1 has also been detected in the liver, brain, heart, and pancreas. SCD5 is a specific isoform in primates and is expressed primarily in the brain, pancreas, heart, and lung (Sampath et al., 2004).
In animal models, the functions of SCD have been reported to be related to diabetes, obesity, atherosclerosis, and cancer (Ntambi et al., 2004.). Liver disease and Alzheimer’s disease are also related to SCD (Lounis et al., 2016; Astarita et al., 2011).
12
SCD1 expression has been found to correlate with poor prognosis in bladder cancer. The SCD inhibitor A939572 suppressed the proliferation of bladder cancer cells (Piao et al., 2019). Further, SCD1 knockdown (KD) suppressed the growth of xenografts of bladder cancer. SCD inhibition led to the saturation of fatty acids and also showed anti-tumor effects (Du et al., 2012). SCD KD induced the termination of cell cycle, growth inhibition, and apoptosis in human bladder cancer cells expressing constitutive active FGFR3 (Du et al., 2012). In lung cancer cells, stable KD of SCD suppressed the ratio of unsaturated fatty acids and SFAs. Furthermore, the anchorage-independent growth was suppressed and apoptosis was increased in the SCD1 deficient cells (Scaglia et al. 2008). Cancer stem cells (CSCs) depend on a large amount of MUFAs generated by SCD (Pisanu et al., 2018). Activated hepatic stellate cells (HSCs) were derived from patients, and HCC was found to highly express SCD. The expression of SCD and the survival of HCC patients was correlated (Lai et al., 2017). In prostate cancer cells, the overexpression of FASN and lack of SCD were observed indicating a frequent deficiency of SCD in patients with prostate cancer (Moore et al., 2005). Inflammation and tumorigenicity of the intestinal epithelial cells due to SCD deficiency are ameliorated by oleic acid obtained from the diet (Ducheix et al., 2018). In rodent HSC and tumor-initiating stem cell-like cells (TICs), SCD expression is regulated by Wnt-catenin signaling, which is enhanced through the stabilization of LRP5/6 mRNA by MUFA generated by SCD leading to liver fibrosis and tumor growth (Ducheix et al., 2018). SCD is required for the activation of the lipid-modified Wnt family proteins (Rios-Esteves et al., 2013). In vitro study showed SCD expression was induced by decrease of serum in media in cancer cells (Roongta et al., 2011).
Several SCD inhibitors have been reported for cancer therapy, however, none is effective in clinical studies. The reported SCD inhibitors include A939572 (von Roemeling et al., 2013), N-(2-hydroxy-2-phenylethyl)-6-[4-(2-methylbenzoyl)piperidin-1-yl]pyridazine-3-carboxamide (Kurikawa et al., 2013), MF-438, CVT-11127, CVT-12012, CAY10566, BZ36, SSI-4, SW208108, SW203668, SAR707, and pyrazolyltriazolone compound 17a (Tracz-Gaszewska et al., 2019). Although changes in the balance of several unsaturated and saturated fatty acids by SCD inhibition in cancer cells have been reported using different SCD inhibitors (Mohammadzadeh et al., 2014; Yee et al., 2013; Mason et al., 2012), the comprehensive changes in the unsaturated/saturated lipids balance have not been fully investigated. Antitumor effects of these compounds have been reported (Roongta et al.,2011; von Roemeling et al.,2013; Fritz et al.,2010; Von Roemeling et al.,2017). In part I of this thesis, I conducted the studies using the novel small molecule inhibitor of SCD, T-3764518 that is a 4, 4-disubstituted piperidine derivatives. T-3764518 was optimized from the lead compound A that binds to the catalytic center of SCD1 in similar mode to the natural ligand, stearoyl CoA (Imamura et al, 2017).
As the substrates of SCD accumulate due to SCD inhibition, the levels of SFAs, including palmitic acid, are thought to be increased. The levels and species of SFAs, MUFAs, and PUFAs affect fluidity and permeability of the membrane. The balance among SFAs, MUFAs, and PUFAs has an important role in regulating the function of the plasma membrane, including physiological responses (Ferreri et al., 2017).
It has been reported that saturated fatty acids such as palmitate induce cell death through activation of ER stress in cancer cells (Rojas et al., 2014). I analyzed the effects of SCD inhibition on the survival of cancer
14 cells and ER stress responses using T-3764518 in cancer cells.
In part II of this thesis, I focus on redox homeostasis that is kept balanced by the generation and elimination of ROS. In cancer, superoxide, hydrogen peroxide, and hydroxyl radicals have been well-studied (Liou et al., 2010). One of the cellular sources of ROS is thought to be mitochondria (Kong et al., 2018). ROS is increased by augmented metabolism, aberration of mitochondria and peroxisomes in cancer (Liou et
al., 2010).
There are glutathione system and thioredoxin (Trx)/peroxiredoxin (Prx) system for ROS defense (Figure 4) (Tomanek, 2015). In the glutathione system, GSH is used during the reduction of H2O2 to H2O by
glutathione peroxidase (GPX) and GSH is oxidized to glutathione disulfides (GSSG). GSSG is reduced to GSH by glutathione reductase (GR) (Tomanek, 2015) and H2O2 is reduced by the Trx/Prx pathway
(Ruiz-Negrón et al., 2019).
The levels of Prx (Nicolussi et al., 2017) and Trx (Karlenius et al., 2010) are increased in cancer. GSH is increased in renal and colorectal cancer (Hakimi et al., 2016). Glutathione with a molecular weight of 307.33Da is not able to efficiently permeate through the plasma membrane (Anderson et al., 1989).
Glutathione is generated from three amino acids (glutamate, glycine, and cysteine) in the glutathione biosynthesis pathway. In the first step, γ-glutamyl-cysteine (γGC) is generated from cysteine and glutamate by GCL, and glutathione synthetase (GSS) converts γGC and glycine to glutathione. GCL is constituted by the catalytic subunit GCLC and the regulatory subunit GCLM (Figure 5). Among the three amino acids, cysteine is imported into the cells through an antiporter system xc (xCT) for glutathione generation that
imports cystine and exports glutamate. Cystine is rapidly reduced to cysteine in the cells after imported into the cells (Shin et al. 2017). xCT has also been investigated as a cancer therapeutic target. In this thesis, I focus on GCL that functions as the rate-limiting enzyme, and I analyzed its function in survival of cancer cells.
GCLC proteins are expressed in the organs in the embryonic period (Díaz et al., 2002). Genetic polymorphisms in the gene promoter region of GCLC and GCLM are associated with risks of cardiovascular diseases (Franklin et al., 2009). Breast cancer (noninvasive lobular carcinoma) expresses GCLC/GCLM. GCLC expression has been correlated with favorable survival, however, no such correlation has been observed in patients who are not treated with chemotherapy (Soini et al., 2004). GCLC levels in the tumors were related to the survival of patients with early-stage HCC (Sun et al., 2019). The expression of GCLC has been reported to correlate with a favorable prognosis in cancer (Mougiakakos et al., 2012).
BSO is known as a GCLC inhibitor. The effect of the combination of BSO and melphalan (L-PAM) in a xenograft model of multiple myeloma was reported (Tagde et al., 2014). Early phase clinical studies with BSO in cancer patients have been conducted. Significant clinical benefits of BSO, however, have not been shown in these studies (Bailey et al., 1994). The identification of cancer patients who will be sensitive to treatment is becoming more critical to effectively proceed to clinical trials. Therefore, I analyzed the association of the sensitivity of cancer cells to GCL inhibition with the cellular glutathione level.
Roles of molecules in glutathione pathway other than GCL including xCT and GPXs have been also investigated in cancer cells. Inhibition of xCT or GPX4 leads to ferroptosis (Yang et al.,2016) that is a
non-16
apoptotic cell death dependent on iron (Yang et al., 2016). Knockdown of RIPK1/3 also induces ferroptosis indicating that ferroptosis is different from necroptosis (Yang et al., 2016). The induction of ferroptosis by GCL inhibition has not been, however, fully elucidated.
In part I, I comprehensively analyzed the changes in lipid composition by SCD inhibition in cancer cells and revealed the changes in the ratios of unsaturated:saturated fatty acids. Moreover, I elucidated that growth is suppressed through the imbalance between unsaturated/saturated fatty acids. I demonstrated the anticancer effects of the novel SCD inhibitor, T-3764518. In part II, I analyzed the mechanisms by which GCL inhibition suppresses the growth of cancer cells and revealed the induction of ferroptosis. In addition, I showed in a cancer cell panel study that kidney and pancreatic cancers are sensitive to GCL inhibition. I further analyzed the association between the sensitivity to GCL inhibition and cellular glutathione level in the cancer cells. Further studies on these two targets are expected to lead to the discovery and development of novel therapies in cancer.
Figures
Figure 1. Hallmarks of cancer.
Figure 2. Lipid metabolism pathways.
Fatty acid citrate acetyl CoA citrate TCA cycle acetyl CoA acyl CoA b io sy nt he si s Β-o xi d a tio n Fatty acid CD36 m ito c ho nd ria CPT1/2
18
Figure 3. Conversion reaction of Stearoyl-CoA to Oleoly-CoA by stearoyl CoA desaturase. SCDs add
a cis double bond in the Δ9 position of an SFA. PUFAs are not able to be produced in mammalian cells and provided from diets. SCD, stearoyl CoA desaturase; SFA, saturated fatty acid; MUFA, monounsaturated fatty acid; PUFA, polyunsaturated fatty acid.
Figure 5. Glutathione biosynthesis pathway.
Glutamate
γ Glutamyl-cysteine
Glutathione
Cysteine
Glycine
GCL
GSS
GCLM
GCLC
20 Part II
Analysis of Mechanisms of Growth Suppression by Inhibition of Glutamate Cysteine Ligase
Abstract
Previous metabolomic analyses of cancer have revealed elevated glutathione levels in tumors. An inhibitor of cystine uptake was identified to suppress glutathione biosynthesis, leading to ferroptosis, a novel iron-dependent form of cell death that differs from apoptosis and necrosis. Glutamate-cysteine ligase (GCL) is the rate-limiting enzyme in the glutathione biosynthesis pathway. Buthionine sulfoximine (BSO), a GCL inhibitor, has previously demonstrated limited clinical benefits. Therefore, selecting patients who respond well to the inhibitor is a key approach for successful future drug development. Ferroptosis induction by BSO has not been fully examined in prior studies. Therefore, the present study investigated the pharmacological effects of BSO and the association between basal intracellular glutathione levels and sensitivity to BSO in cultured cell lines derived from various types of cancer, including those of the kidney [769P, 786-O, A-498, A704, ACHN, Caki-1, Caki-2, G401, G402, RCC4 VHL(-/-), RCC4 VHL(+/+), SK-NEP-1 and SW156] and ovaries (A2780 and A2780/CDDP). BSO was demonstrated to suppress glutathione levels and induce lipid peroxidation, thereby inhibiting cell viability. The viability-reducing effects of BSO were attenuated by ferroptosis inhibition and enhanced by iron, indicating that BSO induced ferroptosis in cancer cells. The cell lines sensitive to BSO, including G402, tended to exhibit non-significantly lower levels of glutathione compared with the BSO-insensitive cell lines, including Caki-2 (P=0.08). Patient sample data indicated the
existence of a population of colorectal tumors with lower glutathione levels compared with those of matched
22
these data suggest that GCL inhibition leads to ferroptosis in cancer cells, and that low glutathione tumor
levels may be a patient selection marker for the use of GCL inhibitors in the treatment of tumors.
Introduction
Metabolic alterations in cancer cells can enhance cell growth and survival by promoting energy metabolism (Warburg, 1956; Vander Heiden et al., 2009; Cairns et al., 2011). In addition, previous metabolomic analyses of colorectal and kidney cancer cells have revealed increased levels of reduced glutathione (GSH) in tumors along with changes in glycolysis, amino acid metabolism and the tricarboxylic acid cycle (Hakimi et al., 2016; Denkert et al., 2008; Wang et al., 2013; Li et al., 2014). These observations suggest that the GSH-dependent defense system against reactive oxygen species (ROS) serves a critical role in these types of cancer. ROS were recently demonstrated to induce ferroptosis, which is an iron-dependent form of non-apoptotic and non-necrotic cell death (Dixon et al., 2012; Yang et al., 2014; Yang et al., 2016). Ferrostatin-1 has been identified as a compound that attenuates ferroptosis by blocking lipid peroxidation (Skouta et al., 2014; Xie et al., 2016). Erastin, a cystine uptake inhibitor, is hypothesized to induce ferroptosis by suppressing the synthesis of GSH, leading to lipid oxidation (Dixon et al., 2012).
Glutamate-cysteine ligase (GCL; EC 6.3.2.2), composed of a GCL catalytic subunit (GCLC) and GCL modifier subunit (GCLM), is the rate-limiting enzyme in GSH biosynthesis, and is responsible for converting glutamine and cysteine to γ-glutamylcysteine (Lu, 2013). Buthionine sulfoximine (BSO) is a GCLC inhibitor.
Ferroptosis induction by BSO in cancer cells has not been fully clarified. In an early clinical trial, BSO was identified to deplete tumor glutathione levels when administered by continuous infusion but did not demonstrate clinical benefits against cancer (Bailey et al., 1997). However, targeting sensitive cancer cell types that have been identified using markers for GCLC inhibitor-sensitivity may optimize the effects of these drugs. Therefore, the present study investigated whether BSO induced ferroptosis in cancer cells, and whether the cellular glutathione level may be a marker for GCLC inhibitor-sensitivity.
24 Materials and Methods
Cell-free GCLC enzymatic assay.
Expression of N-terminal His-tagged human GCLM was induced with 1 mM isopropyl-β-D-thiogalactoside (IPTG, Wako Pure Chemical Industries, Ltd., Osaka, Japan) at 30 ˚C for 5 h in Escherichia coli. Expression of C-terminal His-tagged human GCLC was induced with 1 mM IPTG at 16˚C for 16 h in Escherichia coli. GCLC and GCLM proteins were purified by Ni-NTA affinity chromatography (Qiagen, Hilden, Germany), followed by Superdex 200 gel filtration chromatography (GE Healthcare, Piscataway, NJ, USA), as previously described (Sakamoto et al., 2017). Following purification, the enzymes were used for the subsequent studies. 0.1, 1, 10, and 100 μM of BSO (Sigma-Aldrich; Merck KGaA, Darmstadt, Germany) was premixed with enzymes (10 nM for each) for 30 min prior to the addition of 200 μM adenosine triphosphate (ATP), 1.2 mM glutamic acid and 200 μM cysteine. Following incubation for 60 min, the reaction was terminated by adding 1% formic acid solution and the ATP and γ-glutamylcysteine levels were measured using RapidFire300 mass spectrometry (Agilent Technologies, Inc., Santa Clara, CA, USA) coupled with API4000 triple quadrupole mass spectrometer (AB Sciex, Framingham, MA, USA). The analytical data were integrated using RapidFire Integrator software (version 4.0; Agilent Technologies, Inc., CA, USA).
Cell lines.
The cell lines used in the present study were purchased from American Type Culture Collection (Manassas, VA, USA), DS Pharma Biomedical (Osaka, Japan), and Horizon Discovery Ltd. (Cambridge, UK). The cells were maintained at 37 ˚C in an atmosphere of 5 % CO2 in RPMI-medium 1640 (Thermo
Fisher Scientific, Inc., Waltham, MA, USA) with 10 % fetal bovine serum (FBS, Thermo Fisher Scientific, Inc.). All cell lines used are summarized in Table 3.
Viability assays and determination of cellular glutathione.
The cells were seeded at 1,000-3,000 cells/100 μl in each well of a 96-well plate. The following day, BSO, GSH monoethyl ester (GSHee; Bachem AG, Bubendorf, Switzerland), ferrostatin-1, N-acetylcysteine (NAC; both from Sigma-Aldrich, MO, USA; Merck KGaA, Darmstadt, Germany), cisplatin and ferric ammonium citrate (FAC; both from Wako Pure Chemical Industries, Ltd., Osaka, Japan) were added to the wells. After a 24-h incubation, the cellular total glutathione level [including GSH and glutathione disulphide (GSSG)] was determined using a GSH/GSSG-Glo Assay (Promega Corporation, Madison, WI, USA). Following a 3-day incubation, cell viability was assessed using a Cell Titer-Glo Luminescent Cell Viability Assay (Promega Corporation, WI, USA). To analyze the basal levels of total glutathione (GSH+GSSG) without BSO treatment, the total glutathione levels and cell viability were measured 2 days after the cells were plated.
26
Analysis of mutations and copy number of the von Hippel-Lindau tumor suppressor (VHL) gene in
cancer cell lines.
GSH is oxidized into GSSG when neutralizing ROS (Winterbourn et al., 1997). GSSG may be reduced into GSH by glutathione reductase using NADPH (Winkler et al., 1986) whose major source is pentose phosphate pathway (PPP) (Patra et al., 2014). PPP branches from glycolysis (Patra et al., 2014) that is known to be regulated by various cancer associated genes including hypoxia-inducible factor 1-α (Muñoz-Pinedo et al., 2012; Singh et al., 2015; Courtnay et al., 2015) whose expression is often upregulated by VHL deficiency (Haase et al., 2009). Therefore, VHL status is potentially associated with the regulation of the ROS defense system by GSH. In order to examine the association between VHL status and BSO sensitivity or glutathione levels, the VHL status of cancer cells were analyzed. VHL mutation data were downloaded from the Catalogue of Somatic Mutations in Cancer database, Cell Lines Project v79 (ftp://ftp.sanger.ac.uk/pub/CGP/cosmic). The copy number data for VHL were downloaded from the Cancer Cell Line Encyclopedia (http://www.broadinstitute.org/ccle).
Measurement of lipid peroxidation.
A total of 1x10⁶ PANC-1 cells were seeded in a 10-cm dish, treated with BSO on the following day, and
incubated for 24 h at 37˚C. Subsequently, the cells were stripped with 0.25 % trypsin at 37˚C. The cells were incubated with 5 μM BODIPY 581/591 C11 Lipid Peroxidation Sensor (Thermo Fisher Scientific, Inc., MA, USA) for 30 min. Following two washes with PBS, the cells were re-suspended in BD FACSflow sheath
fluid (BD Biosciences, San Jose, CA, USA). The lipid peroxidation level was assessed using FACSVerse™ system (BD Biosciences) and analyzed with FACSuite v1.0.5.3841 (BD Biosciences).
Metabolomic analysis of colorectal tumors and cell lines.
As described in the previous report (Satoh et al., 2017), all the experiments were conducted according to a study protocol approved by the Institutional Ethics Committee of Kagawa University (Heisei 24-040) upon obtaining informed consent from all subjects. The tumor and normal tissues were surgically obtained from 275 colorectal cancer patients who had not received any prior treatments in Kagawa University Hospital from January 2012 to December 2013 according to the methods of the previous report (Satoh et al., 2017). Of the 275 patients, 5 (1.8%), 2 (0.7%), 36 (13.1%), 102 (37.1%), 85 (30.9%), 45 (16.4%), had adenoma (median age, 77 years; range, 52-84 years, male/female, 1:4) and a clinical stage of 0 (median age, 73 years; range, 73-74 years, male/female, 1:1), I (median age, 70 years; range, 35-89 years, male/female, 22:14), II (median age, 73 years; range, 35-96 years, male/female, 64:38), III (median age, 70 years; range, 28-92 years, male/female, 42:43), IV (median age, 67 years; range, 37-88 years, male/female, 25:20), respectively. The absolute amounts of metabolites in clinical colorectal tumor samples (n=275), their matched normal tissues (n=275) (Satoh et al., 2017) and cell lines (RCC4 VHL-/- and RCC4 VHL+/+) were measured using capillary
electrophoresis-triple quadrupole/time-of-flight MS at Keio University, according to the method described previously(Yuan et al., 2012; Soga et al., 2000; Soga et al., 2003; Soga et al., 2009).
28 SDS-PAGE and western blotting.
The anti-heat-shock protein 90 antibody (cat no., CST4877; dilution, 1:2,000) for western blotting was purchased from Cell Signaling Technology, Inc. (Danvers, MA, USA). Antibodies against GCLC (cat no., ab190685; dilution, 1:5,000) and GSH synthetase (GSS; cat no., ab124811; dilution, 1:2000) were purchased from Abcam (Cambridge, MA, USA). Cells (DLD-1, HCT-116, MIA PaCa-2, PC-3, 769P, 786-O, A-498, A704, ACHN, Caki-1, Caki-2, G401, G402, RCC4 VHL-/-, RCC4 VHL+/+, SK-NEP-1, SW156) were lysed in
SDS sample buffer (Bio-Rad Laboratories, Inc., Hercules, CA, USA) and heated at 95˚C for 5 min. Cell lysates (3 μg) were separated using SDS-PAGE (7.5-15% gradient gel) and transferred onto Sequi-Blot™ polyvinylidene fluoride membranes (Bio-Rad Laboratories, Inc.). The membranes were blocked with StartingBlock™ T20 PBS Blocking Buffer (Thermo Fisher Scientific, Inc.) and probed overnight at 4˚C with the primary antibodies diluted with 10% Blocking Ace (DS Pharma Biomedical) in PBS containing 0.1% Tween-20. The membranes were subsequently washed with PBS containing 0.1% Tween-20 (Wako Pure Chemical Industries, Ltd.) and incubated for one hour at room temperature with horseradish peroxidase-labeled secondary antibody (Cell Signaling Technology; cat. no., 7074; dilution 1:3,000) diluted with Can Get Signal® immunoreaction enhancer solution II (Toyobo, Osaka, Japan). The membrane was washed with
PBS containing 0.1% Tween-20 three times for 10 min, and chemiluminescence was used to detect the antibody-labeled proteins using SuperSignal West Femto Maximum Sensitivity Substrate (Thermo Fisher Scientific, Inc.) and detected with the LAS-3000 Luminescent Image Analyzer (Fujifilm Holdings Corporation, Tokyo, Japan).
Gene expression analysis of tumors from patients with colorectal cancer.
The levels of gene expression of GCLC and GSS in colorectal tumors (n=41) and their matched normal tissues (n=39) were analyzed using the Agilent Expression Array SurePrint G3 Human Gene Expression v2 8x60K Microarray (Agilent Technologies, Inc.) at Keio University (Winterbourn et al., 1997).
Statistical analysis.
The half-maximal inhibitory concentration (IC50) values in the GCLC enzymatic assays were
determined using the XLfit software 5.4.0.8 (IDBS, Guildford, UK) or GraphPad Prism v.5.01 (GraphPad Software, Inc., La Jolla, CA, USA). The IC50 values of the viability studies were determined using a nonlinear
regression curve fitted using GraphPad Prism v.6.01 (GraphPad Software). Differences in cell viability and rescue assays between the control and treatment groups were analyzed using a Williams’ test, and the combination effects were evaluated using a two-way analysis of variance followed by a Tukey's test. Correlation between glutathione levels and growth inhibition by 100 μM of BSO in cancer cells was evaluated using Pearson correlation analysis. Correlations between basal glutathione levels and GCLC or GSS protein levels in cancer cells were determined by linear regression analysis. Correlation between log2(T/N) values of
GSH and total glutathione (GSH+GSSG) in tissue samples from patients with colorectal cancer was evaluated by Pearson correlation analysis. Correlations between total glutathione (GSH+GSSG) and GCLC or GSS mRNA levels (T/N) in tissue samples from patients with colorectal cancer were also evaluated by Pearson
30
correlation analysis. P<0.025 was considered to indicate a statistically significant difference in the statistical tests for rescue studies. In the rest of the statistical tests, P<0.05 was considered to indicate a statistically significant difference in all statistical tests other than the rescue studies.
Results
Pharmacological properties of BSO.
In the cell-free GCLC enzymatic assay, BSO inhibited the activity of GCLC with an IC50 of 570 nM
[95% confidence interval (CI) 429-757 nM; Figure 12A]. BSO reduced the total glutathione (GSH+GSSG) levels in PANC-1 cells (Figure 12B) and induced lipid peroxidation, which was attenuated by NAC and α-tocopherol (Figure 12C). In addition, BSO decreased the viability of PANC-1 cells (Figure 12D), and this effect was attenuated by the addition of a membrane-permeable GSH derivative, GSHee (Figure 12E), and NAC (Figure 12F). These results indicate that cell viability was inhibited by the suppression of intracellular glutathione and the subsequent lipid peroxidation.
BSO induces ferroptosis.
GSH reduction has been identified to induce ferroptosis, which can be reversed by ferrostatin-1 (Skouta et al., 2014; Xie et al., 2016). In the present study, the viability-reducing effect of BSO on PANC-1 cells was rescued by ferrostatin-1 (Figure 13A), indicating that BSO induces ferroptosis in cancer cells. In addition, ferroptosis is hypothesized to depend on intracellular iron concentration (Dixon, et al, 2012); therefore, the present study examined the effects of iron on BSO-induced inhibition. FAC synergistically enhanced the BSO-induced inhibition of PANC-1 (Figure 13B) and HT-29 (Figure 13C) cell viability. These results indicate that the inhibitory effects of BSO are iron-dependent. The BSO-induced inhibition of SW48 cell viability was attenuated by NAC (Figure 13D), but not ferrostatin-1 (Figure 13E).
32 Sensitivity of cancer cell lines to BSO.
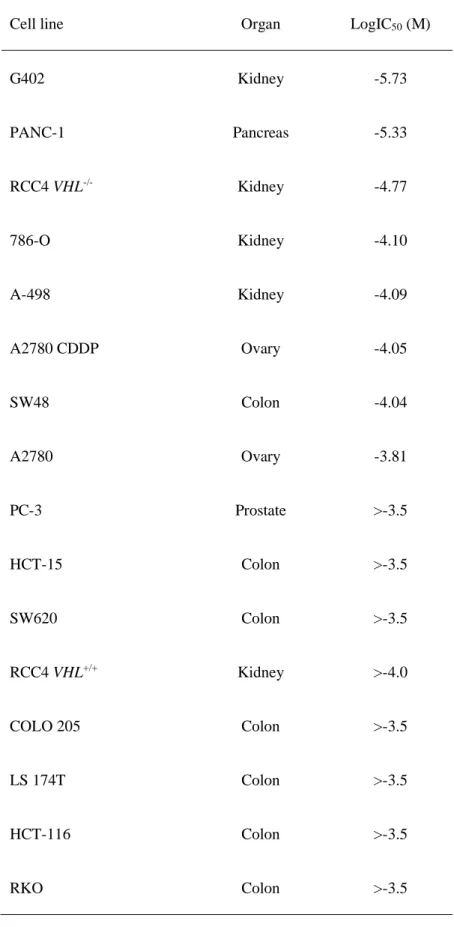
Cell panel viability assays were conducted, and various colorectal, kidney, pancreatic and ovarian cancer cell lines demonstrated high sensitivity to BSO (Table 4). To examine whether the glutathione levels may be a sensitivity marker for BSO, the correlation between the basal levels of total glutathione (GSH+GSSG) and sensitivity to BSO of cancer cells was investigated. BSO-sensitive cells (G402, RCC4 VHL-/-, and A-498)
tended to exhibit lower glutathione levels (P=0.08) compared with those of insensitive cells (RCC4 VHL+/+,
Caki-2, and HCT-116) (Figure 14A). GCLC inhibition suppresses cellular glutathione levels (Figure 12B); therefore, the differences in glutathione levels among cancer cells may be attributable to different protein levels of enzymes in the GSH biosynthesis pathway. The correlation between glutathione levels and the protein levels of GCLC or GSS were examined, and it was identified that GCLC protein and glutathione levels were positively correlated (r2=0.814, P= 0.04) in cancer cells (Figure 14B and C). By contrast, GSS
protein and glutathione levels were not correlated (r2=0.021, P=0.82; Figure 14B and C).
RCC4 plus vector (RCC4 VHL-/-) kidney cancer cells, which do not express VHL, were more
sensitive to BSO compared with isogenic RCC4 plus VHL [RCC4 VHL(+/+)] cells which do express VHL (logIC50, -4.77 vs. -4.0 M, respectively; Table 4). Total glutathione and GSH levels were lower in RCC4 VHL -/- cells compared with RCC4 VHL+/+ cells (Figure 14A and D). The association between VHL status, BSO
sensitivity and glutathione levels was additionally investigated using G402 (VHL wild-type), HCT-116 (VHL wild-type), VHL-deficient A498 (Table 5; Figure 14E) and VHL-mutant Caki-2 cells. However, no clear correlation was observed between the VHL status and sensitivity to BSO, or VHL status and glutathione levels
in these cancer cell lines (Table 4; Figure 14A).
Glutathione levels in tumors from patients with colorectal cancer.
To examine the occurrence of tumors in patients with low glutathione levels, the total glutathione and GSH levels in tumors and their matched normal tissues from the patients with colorectal cancer were measured. The glutathione level was upregulated in the majority of tumors compared with that in the matched normal tissues; however, ~15% (44/284) of the tumor samples demonstrated lower glutathione levels compared with those of the matched normal tissues (Figure 15A). Total glutathione and GSH levels were positively correlated (r2=0.669, P=8.18x10-66; Figure 15B). In addition, the correlation between GCLC and
GSS mRNA expression and glutathione levels was examined in tumors from patients with colorectal cancer, and no marked correlation was observed (Figure 15C).
Discussion
In clinical trials, BSO has been shown to deplete glutathione in tumors, but has not demonstrated substantial therapeutic benefits (Lu, 2013; Bailey et al., 1994). Thus, selecting sensitive cancer types and patients using sensitivity markers may enhance the clinical efficacy of anticancer therapies (Mehta et al., 2012; Dienstmann et al., 2013; Schmidt et al., 2016). However, sensitive cancer types and sensitivity markers for GCLC inhibitors remain incompletely characterized. Therefore, the present study investigated potentially
34
cells. In a cell viability assay, colorectal (SW48), kidney (G402, RCC4 VHL-/- and 786-O), pancreatic
(PANC-1), and ovarian (A2780 CDDP) cancer cells demonstrated sensitivity to BSO, suggesting that treatment with a GCLC inhibitor may be beneficial for these cancer types. The potential sensitivity of kidney cancer to GCLC inhibitors is supported by the present study, in which kidney cancer cell lines were identified to be vulnerable to erastin (Dixon et al., 2012). Subsequently, the association between basal intracellular glutathione levels and cellular sensitivity to BSO was investigated, and it was demonstrated that BSO-insensitive cell lines tended to exhibit lower glutathione levels compared with the sensitive cells. These results suggest that low glutathione tumor levels may be a sensitivity marker for GCLC inhibitors.
Furthermore, the analysis of tumors and their matched normal tissues from patients with colorectal cancer revealed that 15% of colorectal cancers exhibited lower glutathione tumor levels compared with those of the matched normal tissues. These low-glutathione-content tumor populations may be useful for examining the clinical benefits of GCLC inhibitors. Glutathione and GSH levels were correlated, suggesting that glutathione may be substituted with GSH. Furthermore, proton and carbon-13 nuclear magnetic resonance has been suggested to be able to detect GSH non-invasively (Terpstra et al., 2005). These technologies may be applied during the selection of patients for treatment with GCLC inhibitors. The differences in glutathione levels between cancer cell types may be caused by differences in GCLC protein levels. In the present study, protein levels of GCLC and glutathione were correlated among G-402, RCC4 VHL-/-, A-498, RCC4 VHL+/+, Caki-2,
and HCT-116 cells. By contrast, patient tumor samples did not demonstrate a significant correlation between glutathione and GCLC mRNA expression, and differences between GCLC protein levels and GCLC mRNA
expression levels may explain this result; however, additional studies are required to elucidate this. In addition, VHL status was examined as a potential regulator of glutathione levels. Although RCC4 VHL-/- cells demonstrated lower glutathione levels compared with those of RCC4 VHL+/+ cells, this
observation was consistent with the analyses of other cancer cell lines. Therefore, VHL is not likely to be correlated with glutathione levels. Other gene alterations may have obscured the effects of VHL status and, therefore, additional studies are required to clarify the association between VHL status and sensitivity to GCLC inhibitors.
Ferroptosis is a newly-identified type of ROS-induced cell death (Dixon et al., 2012; Yang et al., 2014;
Yang et al., 2016), which the cysteine-uptake inhibitor erastin has been shown to induce. However, whether
the inhibition of enzymes involved in GSH biosynthesis induces ferroptosis has not been fully determined.
This was addressed in the present study by inhibiting GCLC using BSO, which subsequently induced the
lipid peroxidation that is required for ferroptosis (Dixon et al., 2012). In addition, the BSO-induced decrease
in cell viability was attenuated by a ferroptosis inhibitor, ferrostatin-1. Furthermore, ferroptosis is dependent
on cellular iron (Dixon et al., 2012), and treatment with iron enhanced the BSO-induced reduction in viability
of PANC-1 cells, indicating its dependence on iron. These results demonstrated that the inhibition of GCLC
by BSO induced ferroptosis PANC-1 cells. Based on its iron-dependence, cancer with high iron levels may
be sensitive to GCLC inhibitors, and a combination therapy with iron may enhance the anticancer effects of GCLC inhibitors. By contrast, HT-29 cells demonstrated more marked combination effects of BSO and iron, although they were less sensitive to the treatment with BSO alone in comparison with PANC-1 cells. There
36
may have been differences in the intracellular iron concentration between PANC-1 and HT-29, which may
have caused the differences observed in their sensitivity to the treatment. Additional studies are required to
elucidate the mechanism underlying the differences in sensitivity. Notably, in SW48 cells, NAC exerted
rescue effects whereas ferrostatin-1 did not, indicating that BSO may induce cell death in this cell line by a ferroptosis-independent mechanism. In conclusion, the present study demonstrated that GCLC inhibition induces ferroptosis in cancer cells, and low glutathione tumor levels may be used as a sensitivity marker for
Tables
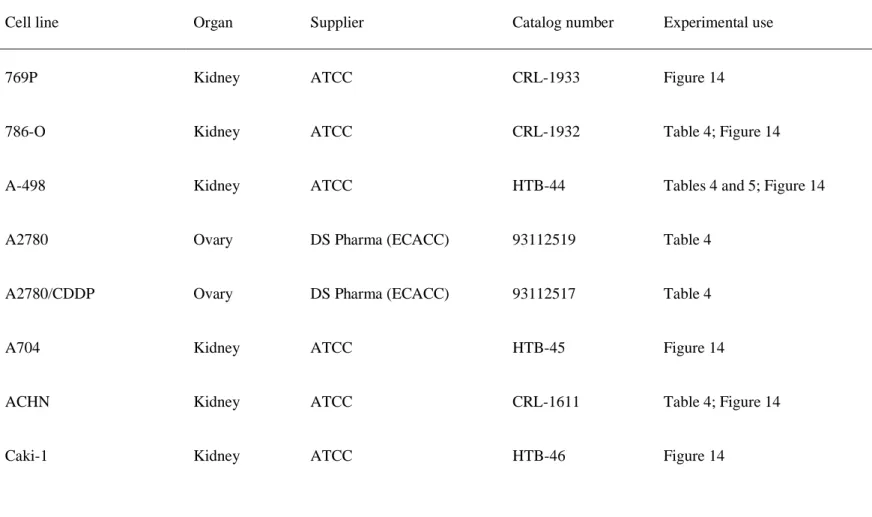
Table 3. All cancer cell lines used in the present study.
Cell line Organ Supplier Catalog number Experimental use
769P Kidney ATCC CRL-1933 Figure 14
786-O Kidney ATCC CRL-1932 Table 4; Figure 14
A-498 Kidney ATCC HTB-44 Tables 4 and 5; Figure 14
A2780 Ovary DS Pharma (ECACC) 93112519 Table 4
A2780/CDDP Ovary DS Pharma (ECACC) 93112517 Table 4
A704 Kidney ATCC HTB-45 Figure 14
ACHN Kidney ATCC CRL-1611 Table 4; Figure 14
38
Caki-2 Kidney ATCC HTB-47 Table 4; Figure 14
COLO 205 Colon ATCC CRL-222 Table 4
DLD-1 Colon Horizon Discovery HD PAR-086 Figure 14
DU 145 Prostate ATCC HTB-81 Table 4
G401 Kidney ATCC CRL-1441 Figure 14
G402 Kidney ATCC CRL-1440 Tables 4 and 5; Figure 14
HCT-116 Colon ATCC CCL-247 Tables 4 and 5; Figure 14
HCT-15 Colon ATCC CCL-225 Table 4
HT-29 Colon ATCC HTB-38 Table 4; Figure 13
LS 174T Colon ATCC CL-188 Table 4
MIA PaCa-2 Pancreas ATCC CRL-1420 Figure 14
PC-3 Prostate ATCC CRL-1435 Table 4; Figure 14
RCC4 VHL-/- Kidney DS Pharma (ECACC) 3112702 Table 4; Figure 14
RCC4 VHL+/+ Kidney DS Pharma (ECACC) 3112703 Table 4; Figure 14
RKO Colon ATCC CRL-2577 Table 4
SK-NEP-1 Kidney ATCC HTB-48 Figure 14
SW156 Kidney ATCC CRL-2175 Figure 14
SW48 Colon Horizon Discovery HD PAR-006 Table 4; Figure 13
SW480 Colon ATCC CCL-228 Table 4
SW620 Colon ATCC CCL-227 Table 4
40
Table 4. Sensitivity of cancer cell lines to buthionine sulfoximine.
Cell line Organ LogIC50 (M)
G402 Kidney -5.73 PANC-1 Pancreas -5.33 RCC4 VHL-/- Kidney -4.77 786-O Kidney -4.10 A-498 Kidney -4.09 A2780 CDDP Ovary -4.05 SW48 Colon -4.04 A2780 Ovary -3.81 PC-3 Prostate >-3.5 HCT-15 Colon >-3.5 SW620 Colon >-3.5 RCC4 VHL+/+ Kidney >-4.0 COLO 205 Colon >-3.5 LS 174T Colon >-3.5 HCT-116 Colon >-3.5 RKO Colon >-3.5
HT-29 Colon >-3.5
SW480 Colon >-3.5
ACHN Kidney >-3.5
Caki-2 Kidney >-4.0
DU 145 Prostate >-3.5
IC50, half-maximal inhibitory concentration
Table.5 Mutational analysis of von Hippel-Lindau tumor suppressor gene in cancer cell lines using Catalogue of Somatic Mutations in Cancer database.
Cell line AA mutation CDS mutation
A-498 p.G144Fs*14 c.426-429 del
G402 - -
HCT-116 - -
42 Figures
Figure 12. BSO suppresses glutathione biosynthesis and decreases cell viability. (A) Enzymatic
inhibition of GCL by BSO. (B-F) Cellular effects of BSO in PANC-1 cells. (B) GSH+GSSG levels, normalized by cellular ATP, determined following incubation with BSO for 24 h. (C) Induction of lipid peroxidation by 100 μM BSO, and attenuation by 10 mM NAC and 100 μM α-tocopherol. (D) BSO-induced decrease in cell viability, and rescue effects of (E) GSHee and (F) NAC. (A, n=4 and D, n=3) Data are presented as the mean ± S.D. (B, E and F) Data are presented as the mean ± S.D. (n=3);
***P<0.0005 using Williams’ test. BSO, buthionine sulfoximine; GCL, glutamate-cysteine ligase; GSH,
glutathione (reduced form); GSSG, glutathione disulphide; ATP, adenosine triphosphate; NAC, N-acetylcysteine; GSHee, GSH monoethyl ester; S.D., standard deviation; BODIPY, boron dipyrromethene.
C o n tr o l (% ) R e la ti ve le ve l o f g lu ta th io n e ( % ) BSO (μM) 100 50 0 150 100 10 1 0 B In h ib it io n ( % ) BSO (μM) 0.01 1 100 100 50 0 A V ia b ili ty ( % ) BSO (μM) 0.001 1 100 50 0 150
D
BODIPY C o u n t vehicle BSO BSO+NAC BSO+α-tocopherolC
BSO (μM) 100 50 0 150 V ia b ili ty ( % ) E GSHee 10 mM 0 mM 3 mM 1 mM 100 0 V ia b ili ty ( % ) BSO (μM) F NAC 100 20 0 120 40 60 80 10 mM 0 mM 3 mM 1 mM 100 044
Figure 13. BSO induces ferroptosis in cancer cells. (A) Rescue effects of ferrostatin-1 against
BSO-induced decrease of cell viability in PANC-1 cell lines; ***P<0.0005 using Williams’ test. (B) Effects
of FAC on viability reduction by BSO in PANC-1 cells, compared by two-way ANOVA: BSO and FAC interaction, P<0.001, F=69.56; BSO, P<0.001, F=266.89; FAC, P<0.001, F=312.01; Tukey's post-hoc test, **P<0.01 and ***P<0.001. (C) Effects of FAC on viability reduction by BSO in HT-29,
compared by two-way ANOVA: BSO and FAC interaction, P<0.001, F=157.96; BSO, P<0.001,
F=179.84; FAC, P<0.001, F=287.57; Tukey’s post-hoc test, ***P<0.001. Effects of (D) NAC and (E)
ferrostatin-1 on cell viability reduction by BSO in SW48 cells; **P<0.005 and ***P<0.0005 using
Williams’ test. Data are presented as the mean ± S.D.(n=3). BSO, buthionine sulfoximine; FAC, ferric ammonium citrate; ANOVA, analysis of variance; NAC, N-acetylcysteine.
A
V
ia
b
il
it
y
(
%
)
C
V
ia
b
il
it
y
(
%
)
E
V
ia
b
il
it
y
(
%
)
B
V
ia
b
il
it
y
(
%
)
D
V
ia
b
il
it
y
(
%
)
V ia b ili ty ( % ) V ia b ili ty ( % ) V ia b ili ty ( % ) BSO (μM) BSO (μM) BSO (μM) 100 50 0 150 100 50 0 150 100 50 0 150 100 20 0 120 40 60 80 V ia b ili ty ( % ) Ferrostatin-1 100 0 0 1 300 0 BSO (μM) 0 300 300 0 BSO (μM) FAC (μg/mL) FAC (μg/mL) NAC 10 mM 0 mM 3 mM 1 mM 30 μM 0 μM 10 μM 3 μM 20 0 30 μM 0 μM 10 μM 3 μM 100 0 Ferrostatin-1 V ia b ili ty ( % )46
Figure 14. Glutathione levels in cancer cells. (A) Total glutathione (GSH + glutathione disulphide)
levels, normalized to cellular ATP levels, in various cancer cell lines. Data are presented as the mean ± S.D. (n=3). (B) Western blot analysis of GCLC, GSS and Hsp90 across various cancer cell lines. (C) Correlation between glutathione and GCLC or GSS protein levels in HCT-116, A-498, Caki-2, G402,
RCC4 VHL-/-, RCC4 VHL+/+. Correlations were determined by linear regression analysis (P=0.04 for
glutathione and GCLC; P=0.82 for glutathione and GSS). (D) Metabolic differences between isogenic
renal cell carcinoma RCC4 cell lines identified using 95% confidence interval bands of regression analysis. (E) Copy number analysis of the VHL gene in cancer cell lines using Cancer Cell Line Encyclopedia data. GSH, glutathione (reduced form); ATP, adenosine triphosphate; GCLC, glutamate-cysteine ligase catalytic subunit; GSS, GSH synthetase; Hsp90, heat shock protein 90; VHL, von Hippel-Lindau tumor suppressor; wt, wild-type; mt, mutant-type; PC, phosphorylcholine; GPC, glycerophosphorylcholine; Asp, aspartic acid; Gln, glutamine.
A B C D E G lu ta th io n e /A T P Sensitive Resistant VHL wt null null wt mt wt G 4 0 2 R C C 4 V H L [-/ -] R C C 4 V H L [+ /+ ] A -498 Cak i-2 HCT -116 R C C 4 V H L [+ /+ ] GSS GCLC HSP90 D L D -1 HCT -116 M IA P a C a -2 PC -3 769 -P 786 -O A -498 A -704 A C H N C a k i-1 C a k i-2 G 4 0 1 G 4 0 2 R C C 4 V H L [- /-] SK -N E P 1 S W 1 5 6 G lu ta th io n e /A T P G lu ta th io n e /A T P
Protein level (GCLC/Hsp90)
Protein level (GSS/Hsp90)
r
2=0.814
r
2=0.021
0 - 0.8 -1 - 0.6 - 0.4 - 0.2 L o g 2 ( c o p y n u m b e r) RCC4 A-498 Ca k i-2 HCT -116 G 4 0 2 RCC4 VHL [-/-] (fmol/cell) R C C 4 V H L [ + /+ ] (f m o l/ c e ll) + -Lower 95% Upper 95% Metabolite Regression line48
Figure 15. Glutathione levels in tumors of patients with colorectal cancer. (A) Upper panel:
waterfall plots of log2(T/N) values of total glutathione (GSH+GSSG) in tissue samples from patients
with colorectal cancer. Lower panel: absolute values (nmol/g) of total glutathione of tumor and normal
tissue from patients (B) Correlation between log2(T/N) values of GSH and total glutathione
(GSH+GSSG) in tissue samples from patients with colorectal cancer (P=8.18x10-66), as evaluated by
Pearson correlation analysis. (C) Correlation between total glutathione (GSH+GSSG) and GCLC (P=0.35) or GSS (P=0.12) mRNA levels (T/N) in tissue samples from patients with colorectal cancer,
as evaluated by Pearson correlation analysis. T/N, tumor/normal tissues; GSH, glutathione (reduced
form); GSSG, glutathione disulphide; GCLC, glutamate-cysteine ligase catalytic subunit; GSS, GSH synthetase; GEP, gene expression.
B 5 -4 4 3 2 1 0 -1 -2 -3 L o g 2 ( T /N ) A r2=0.669 Log2 (T/N) of GSH L o g 2 ( T /N ) o f g lu ta th io n e 0 1000 2000 3000 4000 5000 0 50 100 150 200 250 300 nm o l/ g Normal Tumor
C
r2=0.0227 r2=0.0624 Glutathione (T/N) Glutathione (T/N) G C L C G E P ( T /N ) G S S G E P ( T /N ) 3 0 2 1 3 0 2 1 4 0 2 4 6 8 10 12 0 2 4 6 8 10 1250
In this thesis, I have focused on SCD in the lipid biosynthesis pathway, as well as GCL, the rate-limiting enzyme of the glutathione biosynthesis pathway. Although both the molecules have been investigated as cancer targets, their inhibitors have not been marketed yet. Hence, further analysis of their functions in survival of cancer cells is required for developing these inhibitors. The insight into the changes in lipid composition by SCD inhibition in the cancer cells as illustrated in part I and ferroptosis induction by GCL inhibition in part II are expected to contribute to the understanding of the functions of these molecules in survival of the cancer cells.
In part I of this thesis, I have analyzed the function of SCD in cancer cells using a novel SCD inhibitor, T-3764518. SCD reaction in cells was inhibited by T-3764518 having a potent inhibitory activity (IC50 value of nM order) (Figure 7A). In the colorectal cancer HCT-116 cells, T-3764518
inhibited growth inhibition with IC50 values of nM order, thereby showing its in vitro anti-cancer
potential (Figure 8A). These results suggest that T-3764518 has equal or greater potency than the other reported SCD inhibitors, including A939572, although a direct comparison is not possible as the condition is different (von Roemeling et al., 2013; Kurikawa et al., 2013).
The SCD inhibitor A37062 has been demonstrated to change the ratio of palmitoleic acid/palmitic acid (Du et al., 2012). In part I, I comprehensively analyzed the ratios of unsaturated/saturated fatty acids (Figures 7D and 10; Tables 1 and 2). Interestingly, the extent of changes in the ratios varied dependently on the lipid species. The possible mechanism of these differences might be contributed
52
by the difference in the accessibility of SCDs to each lipid species. SCD inhibition suppressed the ratios of unsaturated/saturated fatty acids in DGs and phosphatidylcholines, which are the major lipid species present in the plasma membrane (Figures 7D and 10). The critical lipid species involved in cell death following SCD inhibition have not been identified and remain to be elucidated.
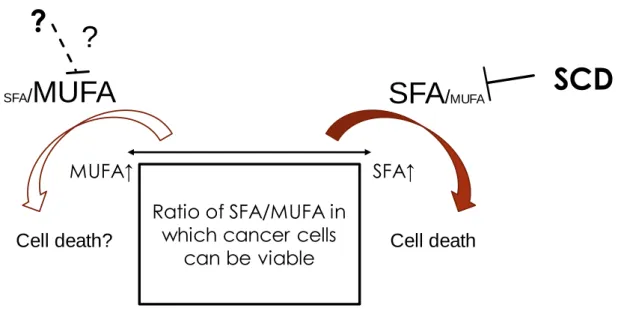
Hess et al. showed decrease in MUFAs is the key to inhibit cell growth in cancer cells (2010). I have further analyzed the undergoing mechanisms of cell growth suppression following SCD inhibition by comparing an SFA or MUFA alone with the combination of an SFA or MUFA and the SCD inhibitor. A MUFA attenuated the growth inhibitory effects of SCD inhibition and an SFA alone induced growth inhibition (Figure 8B). Therefore, an imbalance between SFAs and MUFAs was proven to be critical in the mechanism of growth inhibition by SCD inhibition (Figure 16).
PERK, CHOP, and BiP were upregulated downstream due to the imbalance between unsaturated fatty acids and SFAs following SCD inhibition, indicating the induction of ER stress responses. The cleavage of PARP was also increased indicating the induction of apoptosis (Figures 8C and D). Further studies are required for elucidating the mechanism of induction of ER stress responses due to the imbalance of unsaturated fatty acids and SFAs. The mechanisms of ER stress induction by SCD inhibition has not been fully elucidated. It has been reported that SCD inhibition leads to decrease of membrane fluidity in fibroblasts (de Brachène A et al., 2017). Changes in membrane fluidity by SCD inhibition using T-3764518 in cancer cells have not been examined in this thesis. Further studies are
required to understand the effects by T-3764518 on membrane fluidity and its relationship with ER stress responses. Palmitate has been reported to induce palmitoylation of proteins and decrease in calcium store of ER (Han et al., 2016) leading to ER stress. Further studies are needed to understand whether SCD inhibition causes these changes in cancer cells.
It has been reported that SCD inhibition leads to apoptosis mediated by ROS induction through alterations in the mitochondria, and this ROS induction might be caused by augmented ceramide biosynthesis by SCD inhibition (Chen et al., 2016). Further studies are required to elucidate the functions of SCD in ROS induction through ceramide biosynthesis.
After administration of T-3764518 at 0.3 mg/kg twice, the compound distributed in the tumors at a concentration of 100 folds of the IC50 values in the growth inhibition study, indicating that the
concentration in the tumors was adequate for growth inhibition of the cancer cells (Figure 9B). In this model, T-3764518 showed significant anti-tumor efficacy at a dose of no less than 0.1 mg/kg, indicating the anti-tumor potencies of T-3764518 (Figure 11A). Dose-dependent growth inhibition was not observed in the HCT-116 xenograft model, and hence, lower doses need to be evaluated. The mesothelioma xenograft model showed more potent antitumor efficacy (Figure 11C). Further studies are required for identifying the types of sensitive cancer and elucidating the mechanism of sensitivity. As compared to the potent growth inhibition in the medium containing 2% FBS, the antitumor efficacy in the xenograft model was moderate in spite of enough compound distribution in the tumors. The
54
changes in the ratios of unsaturated fatty acids and saturated fatty acids were smaller in the xenografts than the cell culture (Figures 7D and 10). Fatty acids provided by blood in animal models were thought to be a possible mechanism responsible for it.
The uptake of fatty acids is mainly mediated through transporters including CD36 and FATP (Howie et al., 2018). Long chain fatty acids are activated and used for metabolism by ACSL after they are imported into the cells (Tang et al., 2018). ACSL1-5 belongs to the ACSL family (Tang et al., 2018). Gene aberrations of ACSLs in cancer have been reported. ACSL1 and ACSL4 promote aberrant growth of cancer, tumor invasion, and evasion of cell growth. The function of ACSL3 is complex, while ACSL4 is required for ferroptosis induction as it promotes the oxidation of arachidonic acid (Tang et al., 2018)
Growth suppression by SCD inhibition was enhanced by ACSL3 knockdown in the cultured cells (Figures 8E and F) suggesting that a combination of SCD inhibitor with inhibitors of lipid uptake might enhance the antitumor efficacy of the SCD inhibition. Additional therapies that are possible to enhance the efficacy of SCD inhibitors might be identified by further studies. A report demonstrated that inhibition of autophagy in combination with SCD inhibitor also leads to synergistic suppression of growth cancer cells (Ono et al., 2017).
Because detailed toxicity studies of T-3764518 has not been conducted in this thesis, further studies are required to clarify the potential adverse effects. Systemic deficiency of SCD1 results in
dryness of the skin and alopecia (Strable et al., 2010). Toxicological results on other SCD inhibitors have been reported. SCD inhibitors have been examined as a therapy for metabolic diseases, such as hyperlipidemia and diabetes. MK-8245 has been tested in phase 2 clinical studies of diabetes (von Roemeling et al., 2013). Due to adverse effects on the skin and eyes by SCD inhibition in preclinical studies, the chronic use of SCD inhibitors in diabetes and lipidemic diseases is limited (Oballa et al., 2011). SCD produces sebum that is secreted from the meibomian glands present in the eyelid (Theodoropoulos et al., 2016). There is a possibility that these potential toxicities by SCD inhibition can be eluded by administrating lower doses in the stratified sensitive populations if a sensitive marker is identified. Further detailed studies using a xenograft panel are required to identify the sensitive cancer types and sensitivity markers for a SCD inhibitor.
In part II of this thesis, I have focused on GCL that was evaluated as a therapeutic target against cancer. BSO suppressed the cellular glutathione generation in vitro. The association between the distribution of BSO and suppression of glutathione by the compound in the tumors was not analyzed in this thesis and remains to be elucidated. In clinical studies, BSO was tolerated when administered alone or in combination with L-PAM. GSH, however, was suppressed to 30% of the baseline value 12 hours after administration (Bailey et al., 1994). Limited GSH suppression might be due to the weak activity of BSO. The IC50 values of growth inhibition of BSO in the sensitive cells in this thesis were
56
we have not performed compound screening in this thesis. It is not known whether there is a transporter that imports it into the cells. In this thesis, not GSH itself, but GSHee, a cell membrane permeable derivative of GSH that is modified to penetrate the plasma membrane, was evaluated for the rescue study. As the effects of inhibition of glutathione generation can be weakened if glutathione is provided from the blood into the cancer cells through the plasma membrane, the in vivo effects of GSH inhibitors on the tumors are required to be examined in in vivo models.
In the PANC-1 cells, BSO induced lipid peroxidation. The cell death was increased by iron and cancelled by ferrostatin-1 (Figure 13), indicating that GCL inhibition leads to a apoptotic and non-necrotic cell death, ferroptosis. On the other hand, the inhibition of growth of SW48 was not canceled by ferrostatin-1 although it was attenuated by NAC and GSHee. Thus, further studies are required to elucidate the mechanism in SW-48 including other types of cell death. The lipid peroxidation of the plasma membrane was evaluated in this study. It is required to be elucidated which membrane structures in the cells, including the membranes of ER and mitochondria, are primarily peroxidated for the induction of ferroptosis in the cancer cells.
xCT has been studied as a cancer therapeutic target. It has been reported that xCT inhibition leads to glutathione suppression (Yang et al., 2014). Sulfasalazine is an xCT inhibitor that has been developed the most. Clinical studies with sulfasalazine in cancer are ongoing, and glutathione was found to be suppressed in the tumors (Shitara et al., 2017). GPXs work downstream of GCLC in the
glutathione pathway. Especially, the association of GPX4 with cancer has been analyzed and GPX4 also has been studied as a cancer therapeutic target. Renal cancer cell lines were sensitive to a GPX4 inhibitor RSL3 (Yang et al., 2014) suggesting renal cancer might be sensitive to inhibition of the glutathione pathway. Cancer cell panel study using 21 cancer cell lines has shown that the renal and pancreatic cancer cell lines are sensitive (Table. 4). One of the sensitive cancer types was renal cancer, which was consistent with the report on inhibitors of xCT and GPX4. Additional sensitive cancer types might be identified through further analysis using more types and number of cell lines.
The lack of sensitive patient stratification of these clinical studies might be another possible reason why BSO did not show clinical benefits. Thus, I have analyzed the cellular glutathione level as a sensitive marker. The analysis of the association between cellular glutathione level and BSO sensitivity showed a tendency towards higher sensitivity of the cancer cells with lower glutathione levels (Figure 14A) suggesting that cellular glutathione level can be used as a sensitivity marker. The association between other metabolites and the sensitivity remains to be elucidated. Genetic alterations also might be related to sensitivity. It has been reported that ARID1A deficiency in cancer cells shows a synthetic lethal interaction with GCLC inhibition (Ogiwara et al., 2019).
Glutathione levels have been reported to be upregulated in tumors, suggesting that normal tissues with lower glutathione levels might be more sensitive to GCL inhibition than tumors. Therefore, I have analyzed in detail the glutathione levels of tumors obtained from patients with colorectal cancer. The
58
mean glutathione level was higher in the tumor tissues than the normal tissues. Some populations of tumors showed lower glutathione levels than normal tissues suggesting that these populations might be suitable for clinical testing of the GCL inhibitors (Figure 15A). Further studies are required for determining the absolute glutathione level in tissues that is sensitive to GCL inhibitors.
Although the cellular glutathione level correlated with the GCLC protein level (Figure 14C), the reason why the glutathione levels in the tumors did not correlate with GCLC mRNA is unclear. The expression of GCLC is regulated by NRF2 (Lau et al., 2008). NRF2 is a transcription factor and it regulates the base expression and induction of GCLC (Liang et al., 2013). Further studies are required to elucidate the association between GCLC expression and NRF2 in tumors of cancer patients.
Further studies are required to fully understand the adverse effects of systemic inhibition of GCL. GCLC KO homozygous mice were embryonic fatal and GCLC KO heterozygous mice were normal in terms of survival and fertility (Dalton et al., 2000). The oxidative stress is increased in consistent with a reduction of GSH level in the substantia nigra of the brain in Parkinson’s disease model, as well as PD patients (Smeyne et al., 2013). GCL inhibition in the brain might induce oxidative stress in the substantia nigra. As there is difficulty in identifying compounds that are efficiently transferred to the brain, it is thought to be easier to obtain compounds that are not transferred to the brain, thereby avoiding toxicity to the brain.
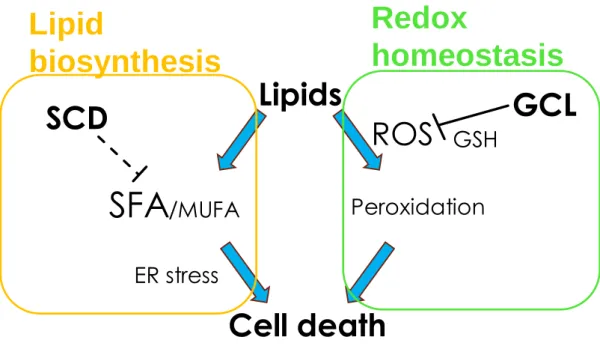
xenograft model. The analysis of changes in the lipids after SCD inhibition in the cancer cells elucidated that SCD inhibition could reduce the ratio of unsaturated: saturated lipids in the lipid species that is a major constituent of the plasma membrane. In addition, I have shown that SCD inhibition induces imbalance between SFAs and MUFAs in form of excessive SFAs and too few MUFAs leading to ER stress and apoptosis (Figure 16). I have analyzed the mechanism of the effects of GCL inhibition on the growth of cancer cells and demonstrated the induction of ferroptosis. Based on the cancer cell panel study, I have indicated that renal and pancreatic cancer might be sensitive to GCL inhibition. In this thesis, I focused on the two separate pathways of lipid metabolism and redox homeostasis. Analysis of mechanisms of growth inhibition by SCD and GCL lead to understanding that both of these molecules have critical roles in qualitative maintenance of lipids in terms of oxidation and desaturation (Figure 17). Further studies on these two targets are expected to lead to the discovery and development of novel therapies in cancer.