A Study on Performance Measurement of
Restaurants Revenue Management From the
Perspectives of Revenue, Profit, and Labor
Productivity
著者
吉岡 勉
著者別名
Tsutomu YOSHIOKA
journal or
publication title
Journal of Tourism Studies
volume
20
page range
57-65
year
2021-03
URL
http://doi.org/10.34428/00012639
Creative Commons : 表示 - 非営利 - 改変禁止 http://creativecommons.org/licenses/by-nc-nd/3.0/deed.jaA Study on Performance Measurement of
Restaurants Revenue Management From the Perspectives of Revenue,
Profit, and Labor Productivity
Tsutomu YOSHIOKA
Abstract
Despite the large volume of research on hotel revenue management, not much research has been conducted on restaurant revenue management, especially in Japan. In addition, RevPASH (revenue per available seat hour) has been presented in a small number of previous studies on restaurant revenue management performance indexes. Recently, ProPASH (profit per available seat hour) has been presented as a new metric by Heo (2017).
The present study compares RevPASH and ProPASH using simulation data and discusses the two methods from the perspectives of revenue, profit, and labor productivity. The purpose of this study is not to evaluate the performance indexes presented so far, but to clarify the differences in their purpose and usage.
Keywords
ProPASH, RevPASH, Restaurant Revenue (Yield) Management, Hospitality Industry, Hospitality Management
1
. Introduction
As indicated by Heo (2017), in terms of restaurant revenue management performance indexes, only RevPASH (revenue per available seat hour; and RevPASM [revenue per available square meter]) has been introduced so far, by Kimes et al. (1998) and Kimes (1999). However, Heo (2017) presented ProPASH (profit per available seat hour; and ProPASM [profit per available square meter]) as a new metric for restaurant revenue management.
This study compares RevPASH and ProPASH as performance indicators for revenue management in restaurants, using simulation data based on previous research. RevPASH focuses on revenue, while ProPASH is a performance indicator that focuses on profit.
Both performance indicators are found to be valid for the management of restaurants. Management that effectively combines both of these indicators is considered necessary.
Journal of Tourism Studies (2021) 58
2
. Literature Review
2.1. Restaurant Revenue Management
Regarding revenue management in restaurants, “Kimes et al. (1998) and Kimes (1999) were among the first to directly address the issue of restaurant revenue management (RRM),” as stated by Heo (2017). As also mentioned by Heo (2017), Kimes et al. (1998), Kimes (1999), and others proposed RevPASH as a revenue-focused performance measure.
However, Heo (2017) proposed ProPASH and ProPASM, which focus on profit.
2.2 Revenue-Focused Restaurant Revenue Management Metric
As regards revenue-focused restaurant revenue management metrics, Yoshioka (2013) showed the computational structure of RevPASH based on Kimes (2009), Rouse et al. (2010), Aoki (2006), The Hotel Association of New York City (2006), Thompson and Sohn (2009), and Kimes and Thompson (2004). This structure is as follows:
RevPASH is also discussed by Yoshioka (2013), based on Thompson and Sohn (2009) and Kimes and Thompson (2004), as follows:
‘Revenue per available seat hour’ (how much revenue could be earned from a single seat per hour, for example), [is] calculated as the product of the occupancy rate per unit of time (seat occupancy) and the average amount paid per customer, or as the result of dividing the total revenue (food and beverage sales) by the number of available seats per unit of time.
As mentioned above, RevPASH is calculated as the product of the average amount paid per customer and seat occupancy. It is necessary to take seat occupancy into account because the seats are used multiple times during business hours. Seat occupancy is calculated using the formula below.
Seat occupancy = Number of utilized seats / Number of seats available / Operating hours.
Here, “operating hours” here do not necessarily have to be literal “hours” and can be adapted to the unit of time used in the analysis. For example, if one wants to analyze seat occupancy in 15-minute
RevPASH = = = Restaurant revenue Number of guests * Number of guests * 1 Number of available Operating seats hours ¥......................................f.................................... ..9 Seat turnover A :verage amount paid per * Seat occupancy customer Restaurant revenue Number of available seats Revenue per available seat * 1 Operating hours
increments or “revenue per available seat hour,” one can use the value of “operating hours” multiplied by 4 (1 hour / 15 minutes).
2.3. Profit-Focused Restaurant Revenue Management Metric
For profit-focused restaurant revenue management, Heo (2017) is a pioneering study. Heo (2017) mentions, “there has been little discussion on how to measure the performance of RM1 strategies as they
apply to restaurants, except Revenue per Available Seat Hour (RevPASH)”.
Further, “RevPASH is an effective and reliable indicator of a restaurant’s performance; however, this metric may not provide the whole picture of a restaurant’s business performance” (Heo, 2017). Moreover, “in restaurants, the contribution margin of each menu item is different and it should be taken into consideration when evaluating restaurants’ performance, because the goal of RRM2 is to maximize
not just revenue but - in the end - profit” (Heo, 2017).
Then, Heo (2017) proposes ProPASH and ProPASM as new metrics3. ProPASH and ProPASM are
calculated as follows:
Heo (2017) also discussed the effectiveness of ProPASH by simulating data for a single restaurant and calculating RevPASH and ProPASH per hour for two days using menu data (prices, food cost, number of sales, etc.) in that restaurant.
2.4. Consideration of Reviews of Previous Studies
For ProPASH as introduced by Heo (2017), if one applies the decomposition of the formula by Yoshioka (2013) mentioned above, one obtains the following equation:
ProPASH (Profit per available seat hour) = ProPASM = (Profit per available square meter) L (MP-FC) Total number of available seats ~ (MP-FC) Total available space in square meters * MP: menu price, FC: food cost. ProPASH per customer * * available seats hours Seat turnover Seat ー Number of available seats hours Contribution per available seat
Journal of Tourism Studies (2021) 60
In the aforementioned studies, RevPASH, ProPASH, and ProPASM have been identified as the indexes for restaurant revenue management. The purpose and use of these indexes need to be clarified because each indicator is considered to have an appropriate purpose and use.
Therefore, the present study attempts to clarify this issue through simulations based on the simulation in Heo (2017) and using costs other than food cost in restaurant management.
3
. Data Collection
In this study, the simulation data found in the literature review were used. Due to the difficulty of receiving actual data disclosure from restaurants, the author has chosen to use simulations. In the simulation conducted by Heo (2017), food cost is used. However, in this study, labor cost is also used in the simulation data.
3.1. Food Cost
Brown (2003) used Table 1 for a study on the percentage of food sales and the percentage of food cost, for full-service and fast-service restaurants.
Arduser (2003) also uses Table 2 as a sample of food items.
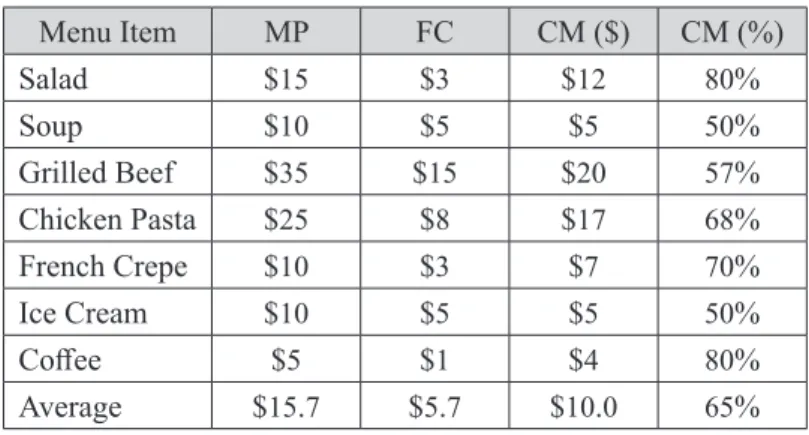
Furthermore, Heo (2017) uses Table 3 as a sample menu.
Table 1 2002 Restaurant Food Sales and Costs Survey
Type of Restaurant Food Sales Food Cost Full-service 70-75% 26-40% Fast-service 90-95% 25-35%
Source: Brown (2003, p.10).
Table 2 Sample of food items
Item Popularity* Cost Menu Price Profit Margin Cost of Food4
Hamburger Plate 36/100 $0.62 $5.50 $4.88 11.3% Spaghetti Carbonara 15/100 $1.79 $6.25 $4.46 28.6% Seafood Combo Plate 49/100 $3.40 $10.95 $7.55 31.1% * 36/100 means 36 hamburger plates were sold out of a total of 100 entrees served in that time period.
Source: Arduser (2003, p. 68) (modified).
3.2. Labor Cost
In the management of a restaurant, emphasis is placed on labor costs. One example is the FL Cost Ratio (Ratio of Food and Labor Cost) index. Regarding the FL cost ratio, Kao Professional Services5
states that "FL cost is the sum of food and labor costs, and FL ratio is the ratio of FL cost to the sales of a restaurant." Thus, the FL ratio can be calculated as "FL ratio = (food cost + labor cost) / sales."
The webpage also advocates that "the FL ratio should always be less than 60%" and the breakdown should be "Food 35% + Labor 25%."
3.3. Parameter Values
Therefore, in this study, the author uses the values in Tables 2 and 3 for the cost of ingredients and assumes that 25% of the revenue is used for labor costs. For the number of sales of each item, a random value is used. However, to clarify the difference between RevPASH and ProPASH, the number of sales was set to be constant, at $4,500 per hour of revenue.
The data used are shown in Tables 4?6. Note that the restaurant is assumed to be able to seat 100
people. Menu Item MP FC CM ($) CM (%) Salad $15 $3 $12 80% Soup $10 $5 $5 50% Grilled Beef $35 $15 $20 57% Chicken Pasta $25 $8 $17 68% French Crepe $10 $3 $7 70% Ice Cream $10 $5 $5 50% Coffee $5 $1 $4 80% Average $15.7 $5.7 $10.0 65% Note: MP: menu price; FP: food cost; CM: contribution margin. Source: Heo (2017, p.2)
Table 4 Simulation parameters (menu prices, food costs, and contribution margins)
Menu Item Menu Price Food Cost Contribution Margin ($) Contribution Margin (%) Salad $15 $3 $12 80.00% Soup $10 $5 $5 50.00% Grilled Beef $35 $15 $20 57.00% Chicken Pasta $25 $8 $17 68.00% Hamburger Plate $6 $1 $5 83.33% Spaghetti Carbonara $7 $2 $5 71.43% Seafood Combo Plate $11 $4 $7 63.64% French Crepe $10 $3 $7 70.00% Ice Cream $10 $5 $5 50.00% Coffee $5 $1 $4 80.00%
Journal of Tourism Studies (2021) 62
4
. Discussion
4.1. The usefulness of RevPASH
Revenue is generally considered as representing the size of the business. RevPASH is the metric based on revenue, and it is constant at $45.00 per hour, as shown in Table 6.
However, according to Table 5, the number of sales per menu item is different in each time period. This means that RevPASH does not reflect what items were sold, and more importantly, how many profitable items were sold.
As the title of this paper suggests, revenue management is a business management technique that focuses on revenue. Therefore, as mentioned earlier, RevPASH can be a useful indicator for managing total revenue, which reflects the size of the business, to increase revenue.
4.2. The usefulness of ProPASH
ProPASH, on the other hand, is the metric that focuses on profit. Many companies cite the pursuit of profit as one of their objectives. Further, each menu item exhibits a different food cost percentage of the
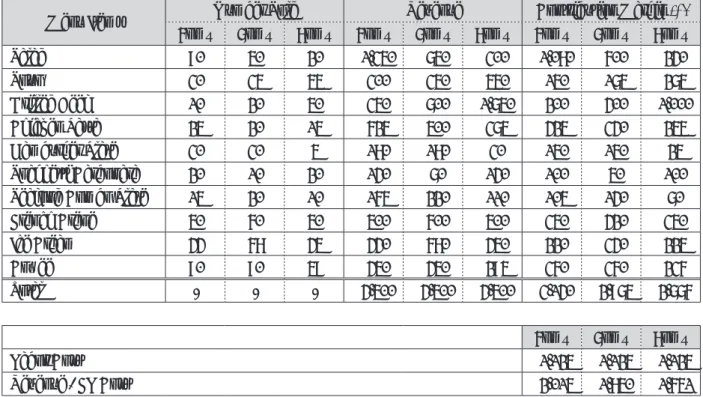
Table 5 Simulation data (number of sales, revenue, and contributed margins)
Menu Items Number Sold Revenue Contribution Margin ($)
6pm~ 7pm~ 8pm~ 6pm~ 7pm~ 8pm~ 6pm~ 7pm~ 8pm~ Salad 90 50 20 $1,350 $750 $300 $1,080 $600 $240 Soup 30 35 55 $300 $350 $550 $150 $175 $275 Grilled Beef 10 20 50 $350 $700 $1,750 $200 $400 $1,000 Chicken Pasta 25 20 15 $625 $500 $375 $425 $340 $255 Hamburger Plate 30 30 5 $180 $180 $30 $150 $150 $25 Spaghetti Carbonara 20 10 20 $140 $70 $140 $100 $50 $100
Seafood Combo Plate 15 20 10 $165 $220 $110 $105 $140 $70
French Crepe 50 60 50 $500 $600 $500 $350 $420 $350 Ice Cream 44 68 45 $440 $680 $450 $220 $340 $225 Coffee 90 90 59 $450 $450 $295 $360 $360 $236 Total - - - $4,500 $4,500 $4,500 $3,140 $2,975 $2,776 6pm~ 7pm~ 8pm~ Labor Cost $1,125 $1,125 $1,125 Revenue - FL Cost $2,015 $1,850 $1,651 Source: Author
Table 6 Simulation results (RevPASH, ProPASH, and FL cost ratio)
RevPASH ProPASH (Revenue - FL Cost) / Available Seats
6pm~ 7pm~ 8pm~ 6pm~ 7pm~ 8pm~ 6pm~ 7pm~ 8pm~ $45.00 $45.00 $45.00 $31.40 $29.75 $27.76 $20.15 $18.50 $16.51 Source: Author ~ーートー一 ~ーートー―--
--=
=
I I I I
menu price and a different contribution margin percentage.
Taking this point into account, ProPASH is a metric based on contributory profit. In other words, ProPASH can be an effective metric for increasing profits6.
Furthermore, as mentioned above, the FL cost ratio is important for the management of a restaurant. Table 6 shows the values of ProPASH and (Revenue - FL Cost) / Available Seats. Naturally, these two indexes vary with the difference in contribution profit. In other words, ProPASH can be a management indicator for companies that focus on the FL cost ratio in their restaurant management.
4.3. Relationships with labor productivity
Stewart and Johns (1996, p.20) state, “Productivity may broadly be defined as the ratio of output to input.” Productivity is generally calculated using the formulas below.
According to Mizuno (2019, p.8) and Kajiura (2016, p.64), it is clear that Value Added contains some values added by companies. Moreover, according to Kajiura (2016, p.59), Value Added is measured simply as “Revenue - Pre-payment cost (or prior benefit costs).”
The contribution margin ($) in the simulation data in Table 5 can be considered almost identical to the Value Added in the labor productivity formula. In this simulation, ProPASH can be used as an indicator of labor productivity in the restaurant business.
An improvement of ProPASH is considered to be related to an improvement in labor productivity. Reducing the proportion of pre-payment costs (or prior benefit costs) of a menu item increases the contribution margin ($), which is nearly identical to Value Added. Clearly, this causes an increase in labor productivity.
5
. Conclusion and limitations
5.1. Conclusion
Using simulation data based on previous studies, this study has focused on the comparison of RevPASH and ProPASH as performance indicators for revenue management in restaurants. The results indicate that as their names suggest, RevPASH is effective for management focused on revenue, while ProPASH is effective for management focused on profit, and even labor productivity.
As indicated by Heo (2017), only RevPASH (and RevPASM) has been proposed for restaurant revenue management. However, Heo (2017) proposed ProPASH (and ProPASM) as a new metric for restaurant revenue management. It is believed that management that effectively combines both of these
Labor productivity per person = and/or Labor productivity per labor hour = Value Added Number of Laborers Value Added Number of Labor Hours
Journal of Tourism Studies (2021) 64
indicators is required.
5.2. Limitations
In this study, only simulation data are used. The inability to use real data from a restaurant is a limitation of this study. The author believes it is most important to find a company with which to cooperate so that real data can be used in a future study.
Notes
1 RM: revenue management
2 RRM. restaurant revenue management.
3 “Therefore, I propose to apply ProPASH to measure a restaurant’s actual profitability by calculating the total contribution margin of each menu item sold instead of revenue. (Note: Fixed cost is not considered because it should be distributed evenly.)”. Further, “for restaurants, Profit per Available Square Meter (ProPASM) can be calculated by dividing the total profit of each hour by the total available space in square meters” (Heo, 2017).
4 This is calculated as “Cost/Menu” and expressed as a percentage.
5 https://pro.kao.com/jp/food-biz-support/management/business-column/010/ (accessed on Nov. 20, 2020)
6 Since ProPASH is a profit-based index, calling its use “revenue management” may not be correct. Another term, yield management, may be more appropriate. However, currently, the term "revenue management" has become so common, that this distinction may be trivial.
References
Aoki, A., 2006. Revenue management in capacity-constrained service industries: Integration of yield management with customer profitability analysis (Japanese), Business Review of Senshu University, 83, 147-165.
Arduser, L., 2003. The Food Service Professional Guide to: Food Service Menus, Atlantic Publishing Group.
Brown, D.R., 2003. The Food Service Professional Guide to: Controlling Restaurant & Food Service Food Cost, Atlantic Publishing Group.
Heo, C.Y., 2017. New performance indicators for restaurant revenue management: ProPASH and ProPASM, International Journal of Hospitality Management, Elsevier, 61, 1-3.
The Hotel Association of New York City, Inc., 2006. Uniform System of Accounts for the Lodging Industry - 10th Revised Edition, American Hotel & Lodging Educational Institute.
Kajiura, A., 2016. (Chapter 4) Productivity components and the reality of Value Added Distribution, productivity improvement theory and practice (Japanese), Kajiura, A. (ed), Productivity Improvement Theory and Practice, 55-72. Chuo Keizai-sha.
Kimes, S.E., Chase, R.B., Choi, S., Lee, P.Y., Ngonzi, E.N., 1998. Restaurant revenue management: Applying yield management to the restaurant industry, Cornell Hotel and Restaurant Administration Quarterly, 39 (3), 32-39.
Kimes, S.E., 1999. Implementing Restaurant Revenue Management: A Five-step Approach, Cornell Hotel and Restaurant Administration Quarterly, 40 (3), 16-21.
Kimes, S.E., Thompson, G.M., 2004. Restaurant revenue management at Chevys: Determining the best table mix, Decision Sciences, 35 (3), 371-392.
Mizuno, I., 2019. Basic philosophy and purpose of new value added analysis (Japanese), The Centre of Productivity Comprehensive Research (ed.), Value Added concept today for high Value Added management, 4-20.
Rouse, P., Maguire, W., Harrison, J., 2010. Revenue management in service organizations, (Merchant, K.A. (ed), Business Expert Press, Managerial Accounting Collection.).
Stewart, S., Johns, N., 1996. Total quality: An approach to managing productivity in the hotel industry, Johns, N. (ed.), Cassell, Productivity Management in Hospitality and Tourism, 19-37.
Thompson, G.M., Sohn, H., 2009. Time- and capacity- based measurement of restaurant revenue, Cornell Hospitality Quarterly, 50 (4), 520-539.
Yoshioka, T., 2013. A study on Revenue Management of Food and Beverage Industry - Focusing on a comparison with Revenue management of Lodging Industry (Japanese), Journal of Leisure and Tourism, (1), 49-56.
Acknowledgments
This work was supported by JSPS KAKENHI Grant Number JP20H04445, The INOUE ENRYO Memorial Grant, Toyo University.