Nagoya City University Academic Repository
学 位 の 種 類 博士(薬学) 報 告 番 号 甲第1539号 学 位 記 番 号 第315号 氏 名 富田 友紀 授 与 年 月 日 平成 28 年 3 月 25 日 学位論文の題名 荷電コロイド粒子の二次元拡散と会合体形成の研究 論文審査担当者 主査: 中川 秀彦 副査: 山中 淳平, 平嶋 尚秀,佐藤 匡史
名古屋市立大学学位論文
荷電コロイド粒子の二次元拡散と会合体形成の研究
平成27年度(2016年3月)
名古屋市立大学大学院薬学研究科
医療機能薬学専攻
コロイド・高分子物性学分野
富田 友紀
1.本論文は2016 年 3 月名古屋市立大学大学院薬学研究科において審査されたものである。 主査 中川 秀彦 教授 副査 平嶋 尚英 教授 佐藤 匡史 准教授 山中 淳平 教授 2.本論文は、学術情報雑誌に掲載された次の報文を基礎とするものである。 基礎となる報文
1. Yuki Nakamura, Tohru Okuzono, Akiko Toyotama, and Junpei Yamanaka
Two-Dimentional Brownian Motions of Polyacrylamide-Modified Colloidal Particles Chem. Lett., 41(10), 1145-1147 (2012)
2. Yuki Nakamura, Manami Okachi, Akiko Toyotama, Tohru Okuzono, and Junpei Yamanaka Controlled Clustering in Binary Charged Colloids by Adsorption of Ionic Surfactant. Langmuir, 31 (49), 13303–13311 (2015)
3.本論文の基礎となる研究は、山中淳平教授の指導のもとに名古屋市立大学大学院薬学研 究科において行われた。
目次
第一章 緒言 1−1 コロイド粒子と会合 1 1−2 粒子間相互作用 2 1−3 本研究の概要 3 第二章 固液界面におけるコロイド粒子の二次元拡散と構造形成 5 2−1 はじめに 2−2 試料・方法 2−3 結果と考察 A. 高分子修飾の特性 A-1. 高分子の重合度決定 A-2. PAAm 修飾カバーガラスの接触角変化 B. 固液界面における二次元拡散挙動と高分子の影響 B-1. Langmuir 吸着 B-2. 吸着等温線 B-3. 臨界ミセル濃度変化 C. PAAm 修飾シリカ粒子の Ethanol による会合体形成 2−4 結論 第三章 イオン性界面活性剤存在下での荷電コロイドクラスター形成 17 3−1 はじめに 3−2 試料・方法 3−3 結果と考察 A. 反対電荷をもつ粒子によるクラスター形成 B. コロイド粒子に対する CPC 吸着の吸着特性 C. イオン性界面活性剤存在下でのコロイド粒子のクラスター形成 C-1. CPC 存在下での種々のコロイド粒子のクラスター形成 C-2. 会合頻度 C-3. CPC 濃度による電荷数の変化 C-4. 二粒子間ポテンシャル 3−4 結論1 第一章 緒言 1−1 コロイド粒子と会合 会合・凝集現象は、生体内でのタンパク質複合体の形成や、結晶形成の初期 過程など、自然界で幅広く観察される 1-10。 会合体形成過程の研究は 1)原子・ 分子クラスターのモデル、2)球状粒子集合体の幾何学的解析、3)光学材料などのメソ スコッピックに配列した構造体形成、4)コロイド安定性など様々な観点から有用である。 このため、数個から 10 個程度の少数のコロイド粒子からなる会合体(クラスタ ー)の形成に関する研究が活発である4-10。コロイド系には一粒子を光学顕微鏡で 観察できる利点があるため、100 nm〜1 µm 程度の試料を用いて、会合現象のモ デル系構築を目指した研究が報告されている。また、数百 nm 程度のコロイド粒 子は可視光付近での Bragg 回折を持つため、球状粒子が構築する構造について も数多くの研究がなされている11-14。 その中でも、構成粒子の形状に依存するような複雑なマクロ構造を得るために、 コロイド粒子の形状を工夫したクラスターの形成が課題となっている。これまでに、エマ ルジョン液滴中に球状粒子を分散させたのち、媒体を蒸発させてパッキングする方法 15や、粒子表面から粒子を重合する方法16 など、様々な作製方法が研究されている。 またこれらの方法を用いて作製した会合体をコーティングしてパッチ粒子化し、パッチ 粒子を DNA 同士の相互作用やアビジンービオチン相互作用6により会合させる方法 も報告されている。その他、反対電荷を持つ粒子間でのクラスター形成7,17-19や、鎖状 高分子の橋掛け20,21、枯渇効果6、DNA 間相互作用22を利用したクラスター形成、ハ イドロゲル粒子23のクラスター形成も報告されている。 特に正四面体構造の粒子から構築されるダイヤモンド構造や、正四面体粒子のアモ ルファス構造では、特定の周波数領域の光を三次元的に閉じ込めることができる、三 次元フォトニックバンドギャップを持つことが示されている24。これにより、構造内での光 触媒反応場や、高効率レーザーとしての利用が期待されている。このような材料応用 には、正四面体を多量に効率的に作る方法が必要である。コロイド粒子の会合制御を 検討することでその一端を担うことが期待される。また、コロイド粒子の会合・凝集現 象は、コロイド科学の主要な研究課題である分散系の安定性の問題とも密接に 関連する25-27 。
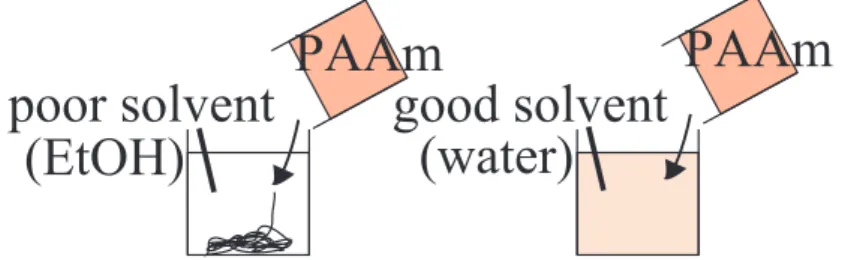
1−2 コロイド粒子と粒子間相互作用 コロイド粒子の会合は疎水性相互作用、クーロン力、ファンデルワールス 力などによって生じる。疎水性相互作用は疎水性水和する面積を小さくするよ うに疎水性化合物が集まるものである。また、クーロン力は二つの電荷間で働 く作用であり、遠距離で作用する。異符号の場合には引力、同符号の場合は斥 力として働く。ファンデルワールス力は双極子や誘起双極子間に働く相互作用 で、溶媒と粒子の屈折率により力の大きさや方向が変化し、近距離で働く相互 作用である。 コロイド粒子の表面修飾はシランカップリング剤等により簡便な方法が確立されて おり、分散媒の組成にも大きく影響を受けるため、粒子間の相互作用チューニングが 容易であるという利点がある。本研究では高分子による表面修飾および分散媒組成 の調製(第二章)、イオン性界面活性剤の吸着(第三章)により粒子間相互作用 制御を検討した。 1—2—1. 高分子修飾粒子 高分子修飾コロイド粒子は、高分子による安定化の観点から広く研究に用い られている25-27。高分子修飾粒子間相互作用は分散媒の組成を変化させて制御で き、高分子の形態は変化する。良溶媒中では高分子鎖が拡がるため粒子間に斥 力が働き、貧溶媒中では高分子鎖が凝集するため粒子間に引力が働く。例えば、 Poly(acrylamide)は良溶媒である水中では溶解しているが、貧溶媒のアルコール 中では凝集する (Figure 1)28。
Figure 1 Poor and good solvents for PAAm. In poor solvent (EtOH), PAAm molecules undergo
precipitation. 1—2—2. 界面活性剤吸着による粒子電荷制御
poor solvent
(EtOH)
PAAm
good solvent
(water)
PAAm
3 り電荷数Z が増加し、吸着していない界面活性剤によりイオン強度 Cs が増加す る。このCs と Z の拮抗作用により結晶化状態が変化する。さらに、界面活性剤 の吸着は温度により変化するため、界面活性剤の吸着量 S と遊離の界面活性剤 量 C を温度により制御できる。本研究室ではこの性質を用いてポリスチレン粒 子分散系の結晶化を、温度制御できることを見いだした(Figure 2 (a))。また、シ リカ粒子分散系についても、同様の温度制御方法を報告した(Figure 2 (b))。シリ カ粒子表面にはポリスチレン粒子に比べてイオン性界面活性剤が吸着しにくい ため、非イオン性界面活性剤(ポリ(オキシエチレン)=ノニフェニルエーテル) の添加により、シリカ粒子表面を疎水性にすることでイオン性界面活性剤の効 率的な吸着を可能にした。このほか、酸化チタン、金など様々な表面を持つ粒 子での荷電コロイド粒子結晶の形成制御も報告している。
Figure 2 Illustration of the thermoresponsive crystallization of charged colloids. (a) Aqueous dispersions
of hydrophobic PS particles and (b) hydrophilic silica colloidal particles.(Toyotama et al. Chem. Mater. 2013) 1−3 本研究の概要 本研究では、球状コロイド粒子の集合による会合体形成について検討した。 第二章ではポリアクリルアミド(PAAm)で修飾したコロイド粒子を用い、分散 媒の組成を調整することで、非電気的力により固体界面に粒子を付着させ、そ の二次元拡散を観察した(Figure 3(a))。また、PAAm 修飾した粒子間のファンデ ルワースル力による会合・解離を検討した(Figure 3(b))。
Thermoresponsive Colloidal Crystallization Using Adsorption of Ionic
Surfactants
Akiko Toyotama,
†Masaaki Yamamoto,
†Yuki Nakamura,
†Chizuru Yamazaki,
†Ayumi Tobinaga,
†Yoshiaki Ohashi,
†Tohru Okuzono,
†Hiroshi Ozaki,
‡Fumio Uchida,
‡and Junpei Yamanaka*
,††Faculty of Pharmaceutical Sciences, Graduate School of Nagoya City University, 3-1 Tanabe, Mizuho, Nagoya City, Aichi 467-8603,
Japan
‡Fuji Chemical Company, Ltd., 1-35-1, Deyashiki-Nishi, Hirakata City, Osaka 573-0003, Japan
*
S Supporting InformationU
niformly shaped charged colloidal particles dispersed in water are arranged into ordered “crystal” structures when the Coulombic interaction acting between the particles is sufficiently strong.1−4 These colloidal crystals usually have Bragg wavelengths in the visible to near-infrared regimes, and thus are potential photonic materials.5,6 By immobilizing the crystal structures in polymer gel7,8or polymer matrixes, we can obtain self-standing materials. To fabricate high-quality colloidal crystals, the ability to control the crystallization by temperature T would be valuable because ingenious crystal growth techniques for atomic/molecular systems are then available.9 However, generally temperature has little influence on colloidal crystallization.1−3 Herein, we present a versatile method for constructing colloidal crystals that melt and freeze with changing temperature, by using adsorption of ionic surfactants onto particle surfaces. We report the thermores-ponsive crystallization of hydrophobic polystyrene and hydro-philic silica (SiO2) colloids, as well as those of titania (TiO2)and gold colloids, which have been anticipated to be useful photonic and plasmonic materials.10,11
Crystallization of hard sphere colloids is governed by only their particle volume fraction (ϕ). For crystallization of charged colloids major experimental parameters include the charge number of the particle (Z) and the salt concentration in the medium (Cs), in addition to ϕ.1−3,12,13 The Coulomb
interaction is stronger at higher Z and lower Cs because ions screen the interaction. Generally, temperature T is not an effective variable for crystallization of charged colloids.14 However, one can control the crystallization based on the T dependence of ϕ, Z, and Cs. We reported thermally induced
crystallization of silica colloids + a weak base pyridine by using the T dependence of Z.15 Based on this, we have succeeded in unidirectional crystallization15 and zone-melting of silica colloids.16 However, this method was applicable only to colloidal particles having pH-dependent charges.
Surfactants are frequently used as dispersants of colloids, which adsorb onto particles to prevent coagulation. Charge-induced crystallization using strongly adsorbing fluorinate-based ionic surfactants has been reported.17 The adsorption behavior is generally endothermic because molecules lose translational entropy upon adsorption and the resulting reduction in free energy is released as heat. When cooled, the adsorption equilibrium shifts toward heat generation; that is, the adsorbed amount is larger at lower T. For colloids containing ionic absorbents, this process should bring about
thermally induced crystallization. Figure 1a illustrates the crystallization mechanism anticipated for the aqueous
dis-persion of hydrophobic polystyrene (PS) particles and ionic surfactants (sodium alkylsulfates CnH2n+1SO4−Na+; Na+ ions
are not shown). Here, we chose a surfactant concentration (Csurf) below the critical micelle concentration (cmc). The
surfactant molecules are partly adsorbed onto the particle surfaces resulting in an increase in Z, while the rest of the surfactant molecules remain in water, resulting in an increase in Cs. Upon cooling, more surfactant molecules are adsorbed, i.e.,
Z increases and Cs decreases; both changes promote crystallization. On the other hand, the interaction becomes weaker on heating, resulting in a melting of crystals.
The characteristics of the colloid samples used in the present study are compiled in Table 1. Here, apis the particle radius as determined by the dynamic light-scattering method, and Z0 is
the charge number in the absence of surfactant, estimated by performing electrical conductivity (for PS and silica) and zeta-potential (for titania) measurements. The PS#1 particles were
Received: February 18, 2014
Revised: July 6, 2014
Published: July 7, 2014
Figure 1. Illustration of the thermoresponsive crystallization of charged colloids. (a) Aqueous dispersions of hydrophobic PS particles and (b) hydrophilic silica colloidal particles.
Communication
pubs.acs.org/cm
Figure 3 (a) Migration of small particles on the surface of a large particle, (b) Illustration of associated
particles.
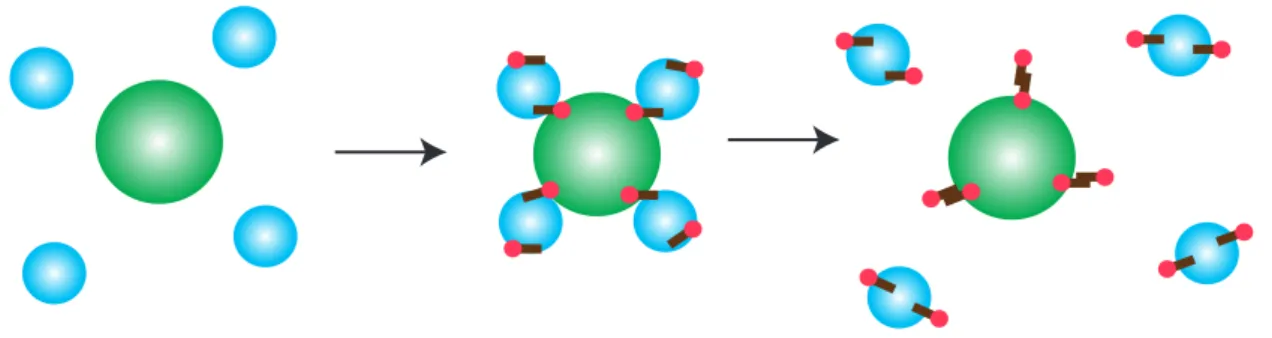
第三章では、正・負それぞれの電荷を持つ粒子にカチオン性界面活性剤を吸着さ せて、クーロン力による会合数の制御を検討した(Figure 4)。 また、界面活性剤吸着 量変化と会合頻度の関係も系統的に検討した。
Figure 4 Illustrations of clustering behavior by adsorption of ionic surfactants.
PS particle Silica particle cationic surfactant surfactant concentration zeta potential (a) (b)
5 第二章 固液界面におけるコロイド粒子の二次元拡散と構造形成 2−1 はじめに 会合体形成過程は、微視的には粒子表面での他粒子の結晶化と考えることが できる。対称性の高い会合体の作成には、中心粒子に対して付着した粒子が動 くことが必要となる。そこで会合体形成の前段階として基板上への粒子のトラ ップを検討した。ポリアクリルアミド(PAAm)で修飾した基板(カバーガラス) へのシリカ粒子の吸着挙動について、エタノール(PAAm の貧溶媒)と水(良溶媒) の組成を調整することで、ファンデルワールス力による基板上での粒子の二次 元拡散を調査し、PAAm 修飾した粒子間のファンデルワースル力による会合・ 解離挙動を検討した。 2−2 試料・方法 1. シリカコロイド分散液 シリカコロイド分散液(日本触媒社製)およびシリカコロイド分散液(PCR Co., Ltd.製)を、イオン交換水に対して2ヶ月、超純水に対して2か月間透析精製し た後、さらにイオン交換樹脂を試料に共存させ、一週間以上保つことにより脱 塩精製を行った。濃度は絶乾法により決定した。動的光散乱(DLS)測定により 得られた粒子径d は、それぞれ 330 ± 60 nm および 1000 ± 110 nm と決定した。 2. ポリアクリルアミド モノマーとしてアクリルアミド (AAm, 和光純薬工業製), 重合開始剤として Ammonium peroxdisulfate (APS, 和光純薬工業製)、反応促進剤として N,N,N’,N’- Tetramethyl-ethylenediamine (TEMED, 和光純薬工業製)を用い PAAm を重合した
30。アクリルアミドの構造式をScheme1 に示す。
APS は固体であり、また添加量がごく微量であるため、超純水に溶解し 10wt% の水溶液 (10 wt% APS)として用いた。
3. カバーガラス
カバーガラス(NEO microcoverglass,24×60mm, Matsunami 製)を濃硫酸(和 光純薬工業製)で一晩浸漬処理したのち、超純水により十分に水洗し、さらに エタノールで洗浄して60℃で乾燥させた。 4. その他の試薬 3-Methacryroxypropyltriethoxysilane 信越シリコーン製 (Scheme 2) エタノール 和光純薬工業製 クロロホルム 和光純薬工業製
超純水 Milli-Q システム(Millipore, MA, U.S.A.)により得た 超純水(電気伝導度 0.5 µS/cm 以下)を用いた。
Scheme 2 Chemical structure of a 3-methacryroxypropyltriethoxysilane molecule.
5. シリカコロイド粒子の粒径測定(DLS)
動的光散乱法(DLS : Dynamic Light Scattering)により FDLS-3000(Photal 社製) を用いて測定した。ヘリウム-ネオンレーザー(100 mW, wavelength = 532 nm)を光 源として用いた。φ10 mm、長さ 60 mm のガラスセルを用い、十分に薄めたシ リカコロイド分散液(0.001vol%以下)に、1.0×10⁻⁵ M となるように NaCl を添 加して試料とした。測定は光子相関法により自己相関関数を求め、キュムラン ト解析法を用いて粒子径分布を求めた。 6. シリカ粒子の PAAm 修飾 (Scheme3) (1)シランカップリング剤による修飾 シリカ表面からPAAm 重合をするため、シランカップリング剤(Scheme 2)を用 い て シ リ カ 表 面 に ビ ニ ル 基 を 導 入 し た 。1~3 × 10⁻⁴ M 塩 酸 100 ml に 3-Methacryroxypropyltriethoxysilane を 2 ml 添加し、10 分撹拌しシラン化剤水溶液 とした。シラン化剤水溶液69.5 µl とシリカコロイド分散液 50 ml を混和し 10 分
7 (2)シリカ粒子表面上における PAAm の重合 サンプル管瓶に超純水70ml、AAm 4.0 g、TEMED 23 µl,を混和し、そこへ(1)で 調製したシラン化シリカコロイド分散液50 ml を混合した。10 wt% APS 210 µl を加え、震盪撹拌しながら30 ℃に保った恒温槽内で遮光下 12 時間反応させた。 (3)シリカコロイドの精製 上記シリカ分散液を15 ml ずつ遠沈管(15 ml) 8 本に取り、2500 rpm で 30 分間 遠心分離し、遊離のPAAm と未反応物を除いた。上清の透明部分を捨て、沈殿 を超純水に再分散させて残りを容器に移した。再び15 ml ずつ取り同条件で遠心 分離による精製を行った。これを6 回繰り返して PAAm で修飾したシリカの水 分散液を得た。
Scheme 3 Illustrations of silane coupling and PAAm polymerization on silica particles.
7. カバーガラスの PAAm 修飾(Scheme4) (1)シランカップリング剤による修飾 1~3×10⁻⁴ M 塩酸 100 ml に 3-Methacryroxypropyltriethoxysilane を 2 ml 添加し、 10 分撹拌しシラン化剤水溶液とした。この溶液にカバーガラスを浸漬し、カバ ーガラスを80 ℃のオーブン中で乾燥した。 (2)カバーガラス表面上での PAAm 重合 サンプル管瓶に超純水40 ml を量り取り、AAm 3.2 g, TEMED 46 µl を加え溶解 させた。ここへ(1)で作製したシラン化カバーガラスを加え、最後に 10 wt%APS 210 µl を加えて、遮光下、一晩震盪撹拌した。カバーガラスを超純水でよく洗浄 し、40 ℃のオーブンで乾燥した。
Scheme 4 Illustrations of silane coupling and PAAm polymerization on coverslips.
silane coupling
reactoin polymerization
silica
particle particlesilica particlesilica
coverslip coverslip coverslip
silane coupling
8. PAAm 粘度測定
上記シリカ粒子修飾およびカバーガラス修飾と同様の方法でPAAm を重合し た(Table I)。PAAm の質量濃度 CPAAm = 0.05, 0.1, 0.125, 0.15g/dl 水溶液を作製し、
ウベローデ型粘度計を用いて粘度測定を行った。
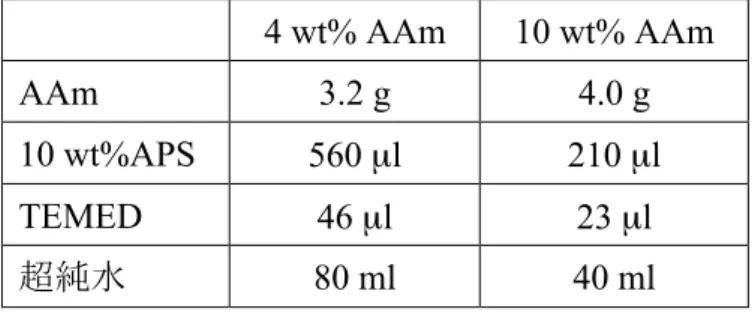
Table I Compositions of PAAm-polymerization, which were used for the modification of silica particles
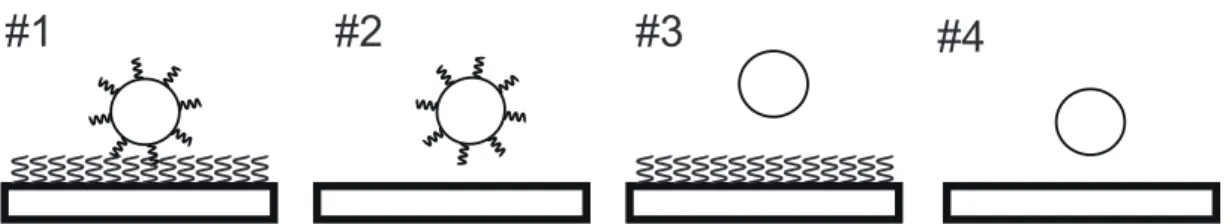
(4 wt%) and coverslips (10 wt%). 4 wt% AAm 10 wt% AAm AAm 3.2 g 4.0 g 10 wt%APS 560 µl 210 µl TEMED 46 µl 23 µl 超純水 80 ml 40 ml カバーガラスがPAAm 鎖修飾されたことを確認するため、シラン化カバーガ ラス、PAAm 修飾カバーガラスの接触角を測定した。それぞれのカバーガラス 上に2 µl の超純水を滴下し、重力に対して垂直方向から実体顕微鏡(SMZ1500, Nikon)を用いて液滴を撮影した。画像から液滴の高さと直径を測定し接触角を 計算により求めた。 9. 基板上におけるシリカ粒子の二次元挙動の検討 シリカ粒子として、シリカもしくはPAAm シリカを用い、基板として、シラ ンコートカバーガラスまたはPAAm カバーガラスを用いた(Figure 5 #1~#4)。 分散媒の蒸発および、これに伴う対流を防ぐため、Figure6 に示すプラスチック 製セル(Figure 6, 0.1×1×5 cm)を基板に接着して用いた。 75 vol%EtOH 水溶液(PAAm の貧溶媒)に分散したシリカ粒子の運動を、倒立顕 微鏡(ECLIPSE Ti-S, Nikon 社)により観察した。1 秒間に 60 枚の撮影モードを 用いたハイスピードカメラ(FASTCAM Viewer, Photron, frame per second = 60) を用いガラス上面を焦点面として撮影し、2 次元動画解析ソフト(Move-tr/2D7.0, Library)を用いて粒子運動の軌跡を解析した。粒子濃度は 0.16 vol%とした。
9
Figure 5 Experimental systems using four kinds of combinations for particles and coverslips.
Figure6 The overview of the observation cell (10×50×1 mm).
2−3 結果と考察 A. 高分子修飾の特性 A-1. 高分子の重合度決定 Table I に示した条件で合成した PAAm の重合度を決定するため、粘度測定を 行った。超純水および粒子・基板を修飾したPAAm 水溶液について四種類の濃 度点における流下時間 t を計り、以下の方法から相対粘度ηrおよび比粘度ηspを 求め、高分子の分子量を計算により得た31。 ηrは溶媒の溶媒における流下時間t0、溶質における流下時間t の比で表される。 𝜂! = 𝑡 𝑡! (1) ηspは以下の式で定義される。 𝜂!" = 𝜂!− 1 = 𝑡 − 𝑡! 𝑡! (2) ηsp/c は単位濃度あたりの粘度の増加率であり、無限希釈での値を固有粘度[η]と 呼ぶ。[η]は無限希釈での孤立した一本の高分子の存在による粘度増加率を表す。 Huggins の式32により以下の関係式が与えられている。 𝜂!" 𝑐 = 𝜂 + 𝑘! 𝜂 !𝑐 (3) k’は Huggins 定数であり高分子の種類や溶媒によって決まる。
#1
#2
#3
#4
式3 が成り立つとき以下の Mead-Fuoss 式33も成り立つ。 ln 𝜂! 𝑐 = 𝜂 − 𝛽 𝜂 !𝑐 (4) βは定数で、β + k’ = 0.5 の関係がある。式 3,4 よりηsp/c- c および (lnηr)/c - c の切 片から[η]を求めることができる。多くの高分子溶液で[η]と分子量 M には Mark-Houwink-桜田の式が成立する。 𝜂 = 𝐾𝑀! (5) K とαは高分子の種類、溶媒、温度により決まる定数である。 ηsp/c- c、(lnηr)/c-c のプロットを Figure7 に示す。4 wt%で重合した PAAm(Figure 7(a))について、プロットの切片より求めた PAAm 鎖の固有粘度[η]=1.224 dl/g であり、M は 12900 と求められた。Acrylamide 残基の分子量 71.08 より重合度 DP=181 となる。また 10wt%で重合した PAAm(Figure 7(b))では [η]=4.267 dl/g であり、同様にして分子量は61700 であった。
Figure 7 Viscosities of (a) a silica-coated PAAm aqueous solution and (b) a coverslip-coated PAAm
aqueous solution. さらに、この高分子鎖の広がりRgは自由連結鎖として次式で表される。 𝑅! = 𝐷!𝑎! (6) a はモノマー(AAm)の長さである。シリカ表面修飾した PAAm について 2Rg=4.0 nm、基板修飾した PAAm では 8.8 nm と見積もられた。 (a) (b)
11 A-2. PAAm 修飾カバーガラスの接触角変化
液滴を球の一部とみなし、以下の方法で接触角θを求めた。下図に示す様に円 の中心 O から点 J を通る直線を引き,K における円の接線との交点を L とす る。
∠KLH = ∠OLK, ∠LHK = ∠LKO = π/2 より△OLK∽△KLH であるから𝜃 = 𝛾 であり、また△OKH について𝛽 + 𝛾 + 𝜋 2 = 𝜋。△OKJ について、線分 OK = 線 分OJ = r より二等辺三角形となるので 2 𝛼 + 𝛽 + 𝛾 = 𝜋。これらの式を連立して解けば γ = 2α = θ ここから、θ, a, b の関係を求めると tan 𝛼 = 𝑎 𝑏 2 ∴ 𝜃 = 2 tan!!2𝑎 𝑏
Figure 8 A photograph of water droplets on (a) a vinyl group-coated coverslip and (b) a PAAm-coated
coverslip. Figure 8 に示す液滴写真から、ビニル基修飾カバーガラス及び PAAm 修飾カバ ーガラスの接触角を概算した。結果をTable II に示す。 O J H K b/2 a L (a) (b) 1 mm 1 mm
Table II Water contract angles on a vinyl group-coated coverslip and a PAAm-coated coverslip.
PAAm 修飾カバーガラスの接触角が小さくなったことから、PAAm 鎖の導入 によりカバーガラス表面の水との親和性が高くなったといえる。つまり、カバ ーガラス表面がPAAm 修飾されたことが確認された。
固体表面の被覆率はCassie-Baxter の式34により表される。 cos 𝜃!"" = 𝜙!cos 𝜃!+ 1 − 𝜙! cos 𝜃!
(7) θappは表面修飾した基板の接触角、θ1は被覆した分子で基板が完全に覆われてい るときの接触角、θ2は基板の接触角、φ1は被覆率を表す。TableII において、 vinyl-coated ではθ1は3-Methacryroxypropyltriethoxysilane の接触角、θ2はガラスの 接触角、φ1は3-Methacryroxypropyltriethoxysilane の被覆率を表す。θapp =53.5°で あり、θ1 =180°, θ2 =0°から、φ1 = 0.2 と求められた。PAAm の接触角はθ1 =15° であるため、PAAm による被覆率は 17%であった。ここから、基板および粒子 上のPAAm 鎖は独立に存在していると考えられる。 Vinyl-coated (Figure 8- (a)) PAAm-coated (Figure 8- (b)) a 61.5mm 22.5mm b 245mm 262.5mm contact angle 53.3° 19.5°
13
B. 固液界面における二次元拡散挙動と高分子修飾の影響
Figure 9 に CEtOH = 75%における、PAAm 修飾基板上での PAAm シリカ粒子軌 跡を示す(実験条件#1)。測定開始時刻 t = 0 でのシリカの座標を原点とし、t = 1 s まで0.016 秒ごとの二次元軌跡を座標上に表示した。
Figure 9 The trajectory of a PAAm-modified particle near a PAAm-modified glass surface for 1s. The
dispersion medium was an aqueous solution with 75% ethanol.
軌跡から時間t と平均二乗変位𝜎! = 𝑥!+ 𝑦! の時間変化を求めた。Figure10(a) では CEtOH を変化させて PAAm 修飾シリカ粒子の PAAm 修飾基板上の二次元運
動(Figure 5#1)の平均二乗変位を求めた。CEtOH = 0%(▲)、25%(▼)、50%(■)
で示す。実線および破線は、最小二乗近似法による得られた原点を通る直線で ある。
Figure10(b)には CEtOH = 75%において、基板と粒子の修飾の組み合わせ(Figure 5)
における、シリカ粒子の平均二乗変位のグラフを示す。#1(○)、#2(□)、#3(△)、 #4(▽)を示している。Figure10(a)の赤破線と(b)の赤破線は同条件(#1, CEtOH = 75%) である。Figure10(a)より、同じ t で σ2は、C EtOHの増加とともに減少することが 分かる。高い CEtOHにおいて、粒子の運動が制限されるといえる。Figure10(b)に おいて、#3,#4 に比べて#1 で σ2は小さい値を取る。これは粒子の易動度が小さ くなるためである。
The Brownian motions of the 325-nm PAAm-modified silica particles were examined by observing the particles located within the focal depth of a few hundred nanometers from the inner surface of the PAAm-modified glass. For comparison, we used bare silica and silicone-coated-glass coverslips (Matsunami Co., Ltd., Tokyo, Japan).7 Figure 2 illustrates the combinations of particles and glasses examined in the present study (hereafter referred to as systems Nos. 14). The motions of individual particles were recoded using an inverted-type optical microscope (ECLIPSE Ti-S, Nikon, Tokyo, Japan), equipped with a high-speed camera (type FASTCAM Viewer, Photron Co., Ltd., Tokyo, Japan), at a sampling rate of 60 frames/s. The particle concentrations were set to 0.16 vol % in all cases.
Figure 3 demonstrates the trajectory of the PAAm-modified silica particles near the PAAm-modified glass (system No. 1), which was located at the origin at time t = 0, obtained for 0 ¯ t ¯ 1 s. From the trajectory, we determined the coordinates (x, y) of the particles as a function of time, using image analysis software (Move-tr/2D 7.0, Library Co., Ltd., Tokyo, Japan), and calculated the mean-square displacements by using the relation ·2= x2+ y2.
Figure 4a shows the ·2t plots (mean values for 20 samples) for system No. 1 at four values of CEtOH (The data points for CEtOH= 75% were omitted for clarity in Figure 4a; these data points are shown by open circles in Figure 4b). In all cases, the plots were well approximated by linear relations. The least-squares fits are shown in Figure 4a by solid lines (CEtOH= 0, 25, and 75%) and a dashed line (CEtOH= 50%; the line mostly overlaps with that for CEtOH= 75%). The ·2 value clearly decreased with increasing CEtOH, for the same evolution time. In other words, the mobility of the particles was more significantly restricted at higher CEtOH values.
Based on the Einstein relation for two-dimensional diffu-sion, ·2= 4Dt, we determined the diffusion coefficients, D. The EinsteinStokes relation8 relates the D value to the solvent viscosity, ©, i.e.,
D ¼ kT =ð6³©aÞ ð1Þ
where k is the Boltzmann constant and a is the particle radius. Using eq 1, we estimated the apparent viscosity, ©, from the D values. In Table 1, the reduced values of the diffusion coefficients (D/D0) and apparent viscosities (©/©0) are com-piled; here D0 is the diffusion coefficient of a rigid sphere, obtained by eq 1, using the solvent viscosity ©0 at 25 °C (©0 values in aqueous EtOH solutions were 0.890, 2.02, 2.38, and 1.9 mPa s at CEtOH= 0, 25, 50, and 75%, respectively). For example, the D0 value for a particle in water is 0.755 ¯m2s¹1. We also calculated the residence time (the period for which we could trace the motion of individual particles by microscopy), and its mean value, ¸, which are also listed in Table 1. The observed decrease in D/D0and the increase in ¸ at higher CEtOH values suggest a reduction in mobility as a result of attractive interactions between the PAAm chains on the silica particles and those on the glass surfaces.
Figure 4b shows a comparison of the ·2t plots (mean values of the data for more than 30 samples) for the four experimental systems. The CEtOH value was 75% in all cases. The least-squares fits are shown by solid lines (systems No. 1, No. 2, and No. 3) and a dashed line (system No. 4). The values of D, ©, and ¸ for these experiments are also presented in Table 1. Both systems No. 3 and No. 4 (bare silica particles) gave much larger D values than system No. 1; this confirmed Figure 2. Experimental systems used in the present study.
No. 1: a PAAm-modified silica particle/PAAm-modified glass surface; No. 2: a PAAm-silica/silicone-coated glass; No. 3: bare silica/PAAm-modified glass; No. 4: bare silica/silicone-coated glass.
Figure 3. The trajectory of a PAAm-modified particle near a PAAm-modified glass surface for 1 s. The dispersion medium
was an aqueous solution with 75% ethanol. Figure 4. (a) Mean square displacement (·
2) vs. t plots for the PAAm-modified silica particles in system No. 1 at four values of CEtOH (the data points for CEtOH= 75% are not shown). (b) ·2 vs. t plots for the four experimental systems at CEtOH= 75%. Lines in (a) and (b) show the least square fits for the data points. 1146
© 2012 The Chemical Society of Japan
Figure 10 (a) Mean square displacement (σ2) vs. t plots for the PAAm-modified silica particles in system
#1 at four values of CEtOH (the data points for CEtOH = 75% are not shown). (b) σ2 vs. t plots for the four
experimental systems at CEtOH = 75%. Lines in (a) and (b) show the least square fits for the data points.
ここで、𝜎! = 4𝐷𝑡 (D は拡散係数)が知られており、プロットの傾きから D を 決定した。 さらに、Stokes-Einstein の関係式 35により、D から見かけの粘性係 数ηを求めた。 𝐷 = 𝑅𝑇 𝑁!× 1 6𝜋𝜂𝑎 (8) R : 気体定数(8.31 JK-1mol-1)、T : 絶対温度、NA : アボガドロ定数(6.02×10²³ mol-1)、 a : 粒子半径 (nm)である。表面修飾した PAAm 鎖の長さは 8 nm 程度であるた め、粒子半径は修飾していない粒子のDLS 結果の値を用いた。また、粒子の基 板上における、平均滞在時間τを測定した。Table III に D/D0, η/ η0およびτを示す。
15
Table III Values of the diffusion coefficient, apparent viscosity, and residence times determined for the
observation of Brownian motion.
Table III 1) ~ 4)には実験系#1 において、CEtOHを変化させた値を示す。高い CEtOH
ではD/D0の減少およびτの増加が見られる。Table III 4) ~ 7)には、実験系を#1 ~ #4(CEtOH = 75%)と変化させた値を示す。 6), 7)に比べて 4)において、D/D0の減少およびτの増加が見られる。ここから、 シリカ表面のPAAm 鎖と基板表面の PAAm 鎖の間に引力が働くことで、実験系 #1 において、粒子のブラウン運動が基板上に制限されたと言える。5)では 6), 7) に比べて低いD/D0、高いτ値を持つが、これは高分子修飾粒子と基板の相互作用 が、未修飾シリカに比べて大きいことが考えられる。この理由としてカバーガ ラスの持つOH 基に対する、PAAm 側鎖の相互作用が働いたと考えられる。7) に ついて、D は水中で非修飾シリカ粒子の拡散定数であるため D0と一致し、D/D0 = 1 となることが期待されたが、基板表面での流体力学的効果35により、予想よ り小さい値となったものと考えられる。 experimental system CEtOH (%) D/D0 η/η0 τ (s) 1) #1 0 0.347 ± 0.006 2.88 0.2 ± 0.1 2) #1 25 0.265 ± 0.005 3.77 0.4 ± 0.1 3) #1 50 0.176 ± 0.002 5.68 0.7 ± 0.1 4) #1 75 0.140 ± 0.001 7.15 0.7 ± 0.1 5) #2 75 0.228 ± 0.003 4.39 0.5 ± 0.3 6) #3 75 0.611 ± 0.012 1.64 0.4 ± 0.1 7) #4 75 0.619 ± 0.013 1.62 0.4 ± 0.2
C. PAAm 修飾シリカ粒子の Ethanol による会合体形成
Figure11 には、CEtOHに対する粒径1 mm PAAm 修飾シリカ粒子の、会合頻度の グラフを示す。会合数 N は一つの会合体に含まれる粒子数と定義し、例えば挿 入図の会合体の光学顕微鏡写真では N=4、N=5 と表現した。縦軸には会合頻度 (N = i に含まれる粒子数/全粒子数(250 粒子))を示し、CEtOH = 0% を赤色、25% を黄色、50%を緑色、75%を青色、90%を紫色で表した。 高い CEtOHで、明らかな会合数の増加が見られた。これは、粒子表面の高分子 鎖間の引力が、CEtOHの増加とともに強くなったためと考えられる。また、CEtOH = 25%でも会合体が得られることから、濃度によらず分散媒中に EtOH が存在する ことで、相互作用が働くと考えられる。
Figure11 Distribution of association number in the coagulations of PAAm-modified silica particles
(diameter: 1 µm) at various values of the ethanol concentration (CEtOH). The inset shows a micrograph of
the coagulations (CEtOH = 75%).
2−4 結論 粒子とカバーガラスをPAAm 鎖で修飾した実験系を構築し、貧溶媒であるエ タノールの濃度によるPAAm 鎖間引力を利用し、コロイド粒子のカバーガラス 付近でのブラウン運動を制御した。 PAAm 修飾粒子を用いた系でのエタノールによる会合体形成を制御した。し かし、本章で行った高分子間相互作用は近距離で働き、会合体が出来る際に粒 5 m 0% 25% 50% 75% 90% 69 100 62 59 52 0 0 0 0 0 0 0 0 15 25 15 24 11 7 8 13 3 4 11 3 2 2 8 2 5 frequency (%) 100 90 80 70 60 50 40 30 20 0 10 1 2 3 4 5 6 CEtOH association number N
17 第三章 イオン性界面活性剤存在下での荷電コロイドクラスター形成 3−1はじめに 第二章では高分子間相互作用により会合体形成の検討を行ったが、得られた 会合体は無定形であったため、本章ではより強い相互作用であるクーロン力に よる会合体形成を検討した。クーロン力を用いた会合体形成の利点は二つ考え られる。反対符号電荷粒子に対して選択的であること、同符号電荷粒子に対し て斥力が働くことである。中心に負電荷粒子が存在し、まわりに正電荷粒子が 存在したとき、正電荷粒子間で反発しながら負電荷粒子に引き寄せられ、正電 荷粒子が、ある距離を保ちながら負電荷粒子に配位され、対称性のある会合体 が得られることが期待される。 本研究では、正電荷および負電荷を持つポリスチレン粒子(PS(-)、PS(+))間での、 会合体形成挙動について検討した。さらにコロイド粒子分散液へのカチオン性界面活 性剤添加により、コロイド粒子の電荷数を精密に制御し、カチオン性界面活性剤添加 による会合数の制御を検討した。特に、PS(-)粒子、シリカ粒子、セチルピリジニウム塩 酸塩から成る系について、界面活性剤吸着量変化と会合分布の関係を検討した。 3−2 試料・実験 1. 荷電コロイド粒子 粒子は負電荷を持つ poly(styrene-styrenesulfonate)粒子(PS(-))、正電荷を持つ poly[styrene-(2-vinylprydine)]粒子(PS(+))、負電荷を持つ silica 粒子の三種類を用い た。Table IV に粒子の特性を示す。粒子径 d、ゼータ電位ζ、表面電荷密度σeff、 電荷数Z effである。 PS(-)1、PS(+)1、PS(+)2は乳化重合法により合成した。PS(-)2およびPS(-)3は Thermo Scientific 社より、silica 1, silica 2 は日本触媒社より購入した。すべての コロイド粒子は、ヴィスキングチューブ(日本メデカルサイエンス社)を用い て三週間透析後、イオン交換樹脂AG 501-X8(D) Resin(BIORAD)を用いて20分間 精製した。容器からの不純物の溶出を避けるため、サンプルはTeflon製容器に保 存して用いた。
Table IV Characteristics of the colloidal particles . a; silica1 data was taken from ref 35.
d ; diameter, ζ ; zeta potential, σeff ; charge density, Zeff ; charge number.
sample d (nm) ζ (mV) σeff (µC/cm2) Zeff (103)
PS(+)1 420 ±1 70 ― +0.136 +4.7 PS(+)2 260 ±1 30 ― +0.046 +0.6 PS(-)1 380 ±1 80 -60 -0.076 -2.2 PS(-)2 600 ± 100 -71 -0.070 -6.0 PS(-)3 1200 ± 160 -75 -0.090 -25.6 silica1 110 ± 120 -47 -0.075 -0.2 silica2 1000 ± 110 -42 -0.041 -7.7 2. ポリスチレン粒子合成 PS(-)1粒子は、以下に示す乳化重合法37により合成した。styrene (St) および divinylbenzene (DVB) は、1 M NaOH水溶液により重合禁止剤を取り除いて使用 した。St 30 ml、﹅sodium p-styrenesulfonate (NaSS) 0.3 g, DVB 1.5 ml、﹅イオン交換水 150 ml、﹅メタノール225 ml を四つ口フラスコに加え、プロペラ型撹拌子を用いて 80 ℃の恒温槽中、90分間100 rpmで撹拌した。溶液中の酸素を取り除くため、ア ルゴン雰囲気下で重合を行った。開始剤であるpotassium persulfate 0.075 gを加え、 遮光下にてさらに6時間、206 rpmで撹拌し反応させた。 PS(+)1 および PS(+)2 も、PS(-)と同様に乳化重合法38,39で合成した。PS(+)1は Stを20 ml、﹅2-vinylpyridineを0.4 ml, DVBを1 ml、﹅蒸留水を210 ml、﹅メタノールを15 ml 四つ口フラスコに加え、ホットスターラーを用いて80 ℃に保ちながら、ア ル ゴ ン 雰 囲 気 下 で100 rpm 、 90 分 撹 拌 し た 。 そ の 後 、 開 始 剤 で あ る 2,2’-azobis(2-aminopropane) dihydrochloride を0.1 g加え、遮光下にて6時間、600 rpmで反応させた。PS(+)2 では同組成を用い、撹拌方法を変更させて重合した。 プロペラ型撹拌子を用いて100 rpm、90分撹拌した。その後、開始剤を加え、遮 光下にて6時間、205 rpmで反応させた。PS(+)1, PS(+)2は同じ組成で合成したが、 粒子径、電荷数ともに違うものが得られた。これは撹拌の違いなどによるもの と考えられる。
19 3. イオン性界面活性剤
カチオン性界面活性剤として、Scheme 5 に示すセチルピリジニウム塩酸塩 (CPC, 和光純薬工業)を精製せずに用いた40-42。
Scheme 5 Chemical structure of a CPC molecule.
4. ゼータ電位 コロイド粒子の電気易動度は、顕微鏡型電気泳動装置(Zeecom, マイクロテッ ク社)を用いて測定した。粒子数密度 np = 10 9–1011 L−1 、[NaCl] = 10 µM の塩濃度 で電気易動度測定を行った。silica1 は Zeecom では測定できないため、リファレ ンスより値を用いた36。 200個以上の粒子に対し易動度を計測し、それらの平均値uを求め、式9 (Henry の式43)よりζを算出した。 𝑢 =𝜀!𝜀!𝜁 𝜂 𝑓(𝜅𝑎) (9) ここで、εr および ε0 は水および空気の誘電率を示し、η は水の粘性を示す。 κはDebye パラメータであり、𝜅! = 𝑒! 𝜀!𝜀! 𝐼により規定される。e0 は電気素量 であり、Iは分散媒のイオン強度である(I = Σ zj2 cj zj: j番目のイオンの価数 cj: j 番目のイオンの濃度)。 a は粒子半径、f(κa) はHenry係数であり次式で表され る44 𝑓 𝜅𝑎 =2 3 1 + 1 2 1 +𝜅𝑎 1 + 2𝑒2.5 !!" ! (10) 粒子の対イオンは Stern 層内部で部分的に凝縮し、粒子の表面電荷を減少して いる。これを考慮した実効表面電荷密度σeffは、式11 に示す Poisson–Boltzmann 式 45を用いて計算できる。 N+ 15 CH2 CH3 -( ) -N+
[ ]
𝜎!"" = 2𝜀!𝜀!𝜅𝑘!𝑇 𝑒! sinh 𝑦 2× 1 + 2 𝜅𝑎 cosh!𝑦 4 + 8 ln cosh 𝑦 4 𝜅𝑎 !sinh!𝑦 2 ! ! (11) 𝑦 =𝑘𝑒!𝜁 !𝑇 kB は Boltzmann 定数である。PS(-)1, PS(-)2, PS(-)3, silica2 について式 11 を用い
て実効電荷密度σeffを求め、実効電荷数 Zeff = 4πa 2 σeff/e0を求めた。 なお、 PS(+)1 および PS(+)2 の ζ 電位測定では、Zeecom の測定用石英セルが 負に帯電し、セル壁面に PS(+)が吸着したため、Zeecom による電位測定が出来 なかった。PS(+)1, PS(+)2 については電気伝導度から電荷数を求めた11,46。また、 silica1 粒子は粒子径 100 nm と小さいため光学顕微鏡型装置では測定できなかっ た。Table IV に示す ζ 電位値は、当研究室の以前の論文で報告した値を用いた 36。また、電気伝導度により得られた silica1 の表面電荷密度σは、-0.2 µC/cm2で あった。 5. 電気伝導度 電気伝導度κcは電解質のモル濃度 c、モル伝導率Λmにより次の式により表わ される。 𝜅! = Λ!𝑐 (12) Λmは実験値が知られており、ΛH+ = 349.8 Sm2/mol, ΛNa+ = Λparticle = 50.1 Sm2/mol,
ΛCl- = 75.2 Sm2/mol である。12 式を用いてκcから電解質(PS(-)であれば H+、PS(+) であればCl-)のモル濃度を求め、粒子1個あたりの電荷数を求めた。 電気伝導度測定には DS-52(Horiba 社製)を用いた。セル定数 0.974 cm−1の電気 伝導度セルを用い、恒温槽により温度を 25.0 ± 0.3 °C に保って測定を行った。全 ての測定について最低三回の測定を行い、κcの平均と標準偏差を求めた。 コロイド粒子の電気伝導度滴定では粒子濃度 1vol% 10 ml に対して 0.01 M NaOH を 10 µM ずつ 500µM まで加え電気伝導度を測定した。
21 6. 臨界ミセル濃度(c.m.c.)測定 超純水またはコロイド粒子分散液に対する、CPC 水溶液の電気伝導度滴定曲 線の変曲点を与えるCPC 濃度を求め、c.m.c.とした。滴定は全量 10 ml の超純水 またはコロイド粒子分散液に対し、10 mM CPC 水溶液を 10 µl ずつ加えたとき のκc値を測定した。 7. 光学顕微鏡観察
倒立型光学顕微鏡(ECLIPSE Ti-S, Nikon社製)、100倍の油浸対物レンズを用い て観察した。顕微鏡が像はハイスピードカメラ (FASTCAM Viewer, Photron社) により0.16秒毎に記録した。
8. 吸着量測定
CPCのコロイド粒子(PS(-)1, PS(+)2, silica1)に対する吸着量を求めた。粒子濃度 Cp = 0.7vol% (PS(-)1), 1.3vol% (PS(+)2), 1.7vol% (silica1)とし、CPC添加混合し、
Optima XE-90遠心分離機(Beckman Coulter社)を用いて、 40,000 rpm, 60 min, 25 °C にて遠心分離を行った。上澄みを紫外可視分光光度計(UV- 2400PC, 島津社製) により測定し、257 nmにピークを得た。このピークはCPCのピリジン環による もので、吸光強度から吸着していないCPC濃度Cを測定した。添加した界面活性 剤濃度Cとの差から、吸着した界面活性剤濃度を求めた。 また、CPCの粒子への吸着量は粒子共存下でのc.m.c.変化からも求めた。コロ イド粒子分散液に対して、c.m.c.測定と同様の方法で電気伝導度滴定を行ったと ころ、変曲点が吸着量分高濃度側に変化した。この変化量を吸着量として用い た。 9. 会合体形成 粒子間での会合体形成挙動について検討した。正電荷および負電荷の粒子分散 液を混和すると、粒子間に働くクーロン力により会合する。Figure 12のように中心に存 在している粒子をcentral粒子とし、外側に付着している粒子をexcess粒子とした。 二粒子混合系において分散液のサンプル名をcentral粒子/excess粒子と表記した。 会合には三通りの状態が見られ、(i)central粒子が単独で存在している場合を非会 合、(ii)central粒子一つに対していくつかの粒子が付着している場合をクラスタ ー、(iii)central粒子複数個が会合している場合を凝集とし顕微鏡で観察された粒
子の形態を分類した(本章 3-3 C-1)。また、クラスターにおいては、付着したexcess 粒子の数を会合数nとし、n = 0, 1, 2, 3, ≧4に分類した。
Figure 12 Illustrations of no-associated particles, clustered particles and aggregated particles.
会合体の観察は、サンプル混和二時間以降に行った。時間変化を検討する系 では、粒子の沈降による凝集を防ぐため、サンプルはFigure 13に示す方法により 撹拌を続けた。10 mlのスチロール棒瓶にサンプルを作製し、500 mlのスチロー ル棒瓶中にFigure 13のように固定した。500 mlスチロール棒瓶を水平に倒しロー ターを用いて容器を回転させた。
Figure 13 An illustration of the rotation method to avoid sedimentations of particles.
3−3 結果と考察 A. 反対電荷を持つ粒子による会合体形成 界面活性剤無添加中での、反対電荷を持つ粒子 1, 2 間の会合体形成挙動につ いて検討した。二粒子間の静電相互作用は式13 のような Yukawa 型のポテンシ ャルとして表わされる47。 𝑈! 𝑟 = 𝑒𝑥𝑝 𝜅 𝑎!+ 𝑎! 1 + 𝜅𝑎 1 + 𝜅𝑎 1 4𝜀 𝜀 𝑍!𝑍!𝑒!! 𝑟 𝑒𝑥𝑝 −𝜅𝑟 central particle excess particle no association cluster aggregation gravity
23 会合体形成に影響を与えるパラメータとして、Zi, ai, κが考えられる。無塩系(κ = 0)では実験系では達成できない値であり、κ = 0 付近ではκの微小変化の影響 が大きいため、全ての会合体形成実験では塩化ナトリウム濃度を10 µM とした。 粒子半径はai = 125, 300, 600 nm のものを用いた。
Figure14 (a) Micrographs and illustrations of the clusters composed of PS(+)1 and PS(−)1, PS(−)2, or
PS(−)3. (b) A states diagram of binary colloids of PS(+)1 and PS(−)2, defined by the total particle concentration Ctotal and the mixing ratio R = CPS(+)1/CPS(−)2. The diagram was observed 24 h after
preparation. The mixing ratio in terms of particle numbers (RN) is also shown.
Figure14(a) にはPS(+)1をexcess粒子としたとき、central粒子として PS(-)1、 PS(-)2、PS(-)3を変化させたときの顕微鏡像を示す。正電荷粒子および負電荷粒 子分散液の混和によりクラスターが得られた。central粒子の粒子径が大きくなる 程、会合数nは多くなった。 一般に、会合粒子数nは粒子サイズ比Rs= a1/a2に大きな影響を受けると考えら れている。剛体球におけるnとRsの関係についてSchade 7らはR s = a1/a2 = 2.45のと き正四面体構造を取ると報告している。正負電荷コロイドの会合体ではイオン 強度が低い場合、Rs ≤ 2.86 においてn = 4 となることも報告している。このRs 値の違いは、表面に付着した粒子間に斥力が働くためである。 会合体が形成において、粒子濃度Cpは重要なパラメータとなる。平均粒子間 距離はCp −1/3に比例するため、C pは粒子が出会う頻度に影響する。そこで、Cpの 効果について、PS(-)2/PS(+)1分散液を用いて検討した。PS(-)2,PS(+)1それぞれの 粒子水分散液を混和後、24時間震盪したのち光学顕微鏡で非会合・クラスター・ 凝集の三つの状態に分類した。Figure 14(b) に、総粒子濃度 Ctotal (= CPS(+)1 + CPS(-)2) (vol%)に対して、粒子の混合比R = CPS(+)1/CPS(-)2を変化させたときの、粒子の会合 体形成の相図を示した。上部横軸には粒子数比RNを示した。赤色のシンボルの 上側では凝集、下側ではクラスターが得られた。総粒子濃度が高く(高Ctotal)かつ
混合比が小さいとき(低R)、﹅PS(+)1 と PS(-)2の会合体は巨大な凝集を形成した。 一方、独立したクラスターは、総粒子濃度が低く(低Ctotal)かつ高い混合比(高R) で得られることが分かった。本研究ではRN = 100とし、Ctotal < 0.006vol%の希薄条 件でクラスター形成の検討を行った。 excess粒子のcentral粒子への付着数nは時間tとともに増加するが、t = 1 h以降は 目立った増加は見られなかった。nの時間変化についてはC-2で詳しく説明する。 B. コロイド粒子に対するカチオン性界面活性剤の吸着特性 B-1. Langmuir 吸着 界面活性剤の粒子への吸着は、Figure 15 のように吸着した界面活性剤濃度 S と、吸着していない界面活性剤濃度 C に分かれ、吸着平衡が成り立つ。単分子 吸着の場合、式14 に示した Langmuir 吸着式48に従う。 𝑆 = 𝑘Γ𝐶 1 + 𝑘𝐶 (14) k は吸着速度定数、Γ は飽和吸着量(モル濃度)を示す。また、全界面活性剤濃度 Csurf = S + C である。
Figure15 An illustration of adsorption of surfactants on the particle.
本章3−2吸着量測定において、遠心分離の上澄みから得られた CPC 濃度は C なので、吸着量S を Csurf = S + C から計算した。体積 V 中の総粒子表面積を Atot =
4πa2Np/V としたとき、単位面積当たりの吸着量を S/Atotとした。
B-2. 吸着等温線
S
C
surfactant
25
Figure 16 (a) Adsorbed amounts per unit surface area (S/Atot) versus concentration of nonadsorbed CPC
(C). Blue, orange and green symbols represent PS(−)1, PS(+)2, and silica1, respectively. Solid and dashed curves are fitted to the Langmuir adsorption curve. (b) Magnified plot of silica1. (c) Plot in a wider C region; the data at C above cmc are included.
PS(-)に対するデータを●で示し、silica1 を■、PS(+)2 を●で示す。 silica1 に対する吸着量について、CPC 低濃度部分を拡大したグラフを Figure 16 (b)に示す。Figure 15 (c) には、c.m.c.(Csurf = 1.1 mM )以上の濃度の吸着等温線を 示す。c.m.c.以上では、界面活性剤の粒子への吸着平衡に加えて、ミセル形成に 関する平衡も存在するため、吸着量解析にはc.m.c.未満のデータを用いた。 PS(-)1 と silica1 を比べると PS(-)1 では吸着量が多い。これは PS(-)1 が疎水性 表面をもち、silica1 は親水性表面を持つため、界面活性剤の親和性に差があるた めである。この吸着性の違いから、二粒子間でのCiepの差が生じると考えられる。 PS(-)1 と PS(+)2 の吸着等温線を比較すると、PS(+)にも同符号電荷を持つカチ オン性界面活性剤が吸着することが分かる。また、PS(-)1 に関して Csurf = 10 ~ 40 µM において、C = 0 となる。この範囲では PS(-)1 に対する CPC の完全吸着(S = Csurf)がおきている。ここから、カチオン性界面活性剤の PS(-)への吸着には、二 種類のメカニズム 48が考えられる(Figure 17)。1) 粒子の負電荷に対して、界面 活性剤の正電荷を持つ親水部が、クーロン力により吸着する。2) 界面活性剤の
263
Aqueous dispersions of each particle were mixed and shaken for
264
24 h in an automatic shaker, and the association states were
265
observed by optical microscopy.
Figure 1
b shows the states of
266the colloids in a plot of particle concentration C
total(= C
PS(+)1+
267C
PS(−)2) [in vol %] versus mixing ratio R = C
PS(+)1/C
PS(−)2. The
268upper abscissa of
Figure 1
b represents the concentration ratio
269in terms of the particle numbers (R
N). At sufficiently high C
total270
and small R, the PS(+)1 and PS(−)2 particles formed large
271
aggregations; conversely, isolated clusters formed at sufficiently
272low C
totaland large R. In subsequent work, we fixed the R
Nat
273100 and prepared dilute colloids (C
total< 0.006 vol %). Under
274these conditions, the clusters were isolated. Namely, they were
275composed of a single particle of one component and associated
276
particle(s) of another component. Hereafter, we refer to the
277
single and associated particles as central and excess particles,
278respectively, and express the binary colloids in central/excess
279
format, such as PS(−)2/PS(+)1.
280
3.2. Adsorption Isotherms of CPC onto the PS and
281
Silica Particles. To determine the adsorption isotherms of
282
CPC onto the PS and silica particles, we detected the
283
concentration of the nonadsorbed CPC molecules, C. The
284
adsorbed amounts of CPC, S, were then calculated as S = C
surf285
− C. The adsorbed amount per (geometrical) unit surface area
286
is given by S/A
tot, where A
tot= 4πa
2N
pis the total surface area
287
of the particles. (Here N
pis the number density of the
f2 288
particles.)
Figure 2
a plots the S/A
totvs C trends for the PS(−)1
289and silica1 particles.
290
The data for positively charged PS(+)2 are also shown for
291
comparison (orange symbols). The results for silica1 are
292
clarified in
Figure 2
b, which enlarges the lower part of the
293
vertical axis of
Figure 2
a. The C
pvalues for PS(−)1, PS(+)2,
294and silica1 were 0.7, 1.3, and 1.7 vol %, respectively, giving A
tot 295values of 10
3cm
2/mL for PS(−)1 and PS(+)2 and 10
4cm
2/mL
296for silica1. In
Figure 2
c is the plot in a wider C range. Apart
297
from C
surf≈ 1120 μM for PS(−)1, which was determined from
298
the conductivity titration, all of these results were determined
299
from ultracentrifugation data. We did not use the data above
300
cmc (=
∼1100 μM) on analyzing the adsorption isotherm
301
because then we have to take both the adsorption and
302
association (micelle formation) equilibrium into account.
303
Cationic surfactant molecules are thought to adsorb onto
304
negatively charged PS surfaces in water by two mechanisms:
37305
First, their cationic head groups electrostatically adsorb to the
306
negative charge groups on the PS surfaces; next, the alkyl
307
groups of the surfactants adsorb by hydrophobic interaction to
308
the PS surfaces and also to already adsorbed CPC molecules.
37309
According to the electrical conductivity titrations, a single
310
PS(−)1 particle had 20 500 negatively charged groups (sulfonic
311
and sulfuric acid groups). From this result, the concentration of
312
the charged groups on the PS(−)1 colloids was calculated as 40
313
μM. As seen in
Figure 2
, the C of PS(−)1 was nearly zero
314
below S/A
tot= 0.04 μM/cm
2, that is, S = 40 μM, indicating
315
strong electrostatic adsorption to the charged groups. Under
316
this condition, the net charge of PS(−)1 should be zero.
317
Therefore, for this sample, C
iepis 40 μM and the PS(−)1
318
particles should become positively charged at C
surf> 40 μM.
319
Within this positively charged region, the S−C curves are
well-320
fi
tted to a Langmuir-type adsorption isotherm; that is, S =
ΔS +
321
k
1C
Γ
1/(1 + k
1C), with
ΔS = 40 μM, k
1= 0.013 M
−1, and
Γ
1=
322
246 μM. We note that CPC molecules also significantly
323
adsorbed onto the positively charged PS(+)2 particles (
Figure
324
2
). Thus, we may reasonably surmise that adsorption onto
325
PS(−)1 occurred after the charge inversion.
326
The adsorption of alkylpyridinium cations to silica surfaces
327
has been extensively studied.
38,39The adsorption amount
328
increases with increasing pH
36,37,40because the Z
effof silica
329
enlarges at higher pH. Under neutral conditions, however,
330
adsorption is not remarkable because of the low charge number
331
and hydrophilic nature of the surfaces. The pH of the sample in
332
the present study was around 6 because of dissociations of
333
silanol groups (Si−OH) on the silica particles and dissolution
334
of airborne carbon dioxide. Thus, the adsorption amount of
335
CPC was much lower on silica particles than on PS particles.
336
(See
Figure 2
.) The entire adsorption isotherm (covering the
337
entire C
surfregion) was well-fitted by a Langmuir-type
338
adsorption; that is, S = k
2C
Γ
2/(1 + k
2C), with k
2= 0.069
339
M
−1and
Γ
2= 24 μM.
340
3.3. Association States of Various Colloids on
341
Additions of CPC. Using optical microscopy, we then
342
examined the clustering in the presence of CPC. For this
343
investigation, we used charged PS(−)2 and silica2 and
344
positively charged PS(+)1. The C
totalof all samples was 0.01
345 t2
vol %.
Table 2
illustrates the states of the various colloids after
346
CPC addition. The dashes, circles, and triangles in
Table 2
347
indicate stable conditions (under which no association was
348
observed), conditions under which isolated clusters were
349
formed, and conditions leading to large aggregations,
350
respectively. We note that both the clustering and aggregations
351
states were irreversible. That is, once formed at a certain C
surf,
352
the clusters did not dissociate into individual particles in the
353
presence of CPC, implying that C
surfis stable. None of the
354
samples formed clusters solely of excess particles.
355
The association behavior in
Table 2
can be explained in
356
terms of the changing interparticle interactions as C
surfis varied.
357
(i) One-component colloids of the positively charged PS(+)1
358
failed to associate at any C
surfvalues, implying that Z should
359
monotonously increase with increasing C
surf. At higher C
surf, the
360
interparticle interaction was more significantly screened by
361
nonadsorbed CPC ions; however, the screening was insufficient
362
to initiate coagulations under these conditions. (ii) The binary
Figure 2. (a) Adsorbed amounts per unit surface area (S/A
tot) versus
concentration of nonadsorbed CPC (C). Blue and green symbols
represent PS(−)1 and silica1, respectively. Orange symbols are the
data of PS(+)2. Solid and dashed curves are fitted to the Langmuir
adsorption curve. (b) Magnified plot of silica1. (c) Plot in a wider C
region; the data at C above cmc are included.
Langmuir
ArticleDOI: 10.1021/acs.langmuir.5b02778 Langmuir XXXX, XXX, XXX−XXX D
疎水部であるアルキル鎖が、粒子の疎水部および 1)のメカニズムで粒子に吸着 した界面活性剤の疎水部に吸着する。
Figure 17 Mechanisms of CPC adsorbing on PS(-) particles.
Figure 18 に NaOH による PS(-)1 の電気伝導度滴定結果を示す。横軸は NaOH 濃度(µM)、縦軸に電気伝導度κc (µS/cm)である。κc の最小値を与える[NaOH]は PS(-)1 の表面電荷に対する中和点を示し、このとき PS(-)1 の全ての電荷の対イ オンがNa+に置き換えられるため、一粒子あたりに吸着したNa+の個数と一粒子 が持つ電荷数は一致する。PS(-)1 は一粒子あたり平均 20,500 個の負電荷(スル ホン基およびスルホン酸基)を持つと計算された。 adsorbed by
head groups adsorbed bytails
100 80 60 40 20 0 S/cm) 500 400 300 200 100 0 ( S/cm) Na+ Na+ Na+ Na+ Na+ Na+ Na+ Na+ Na+ NaOH NaOH NaOH
27 この結果からFigure 16 において、PS(-)1 は Csurf = 40 µM にあたる総電荷を持 つと計算され、グラフでもS/Atot ≦ 0.04 µM /cm2 つまり S ≦ 40 µM では C = 0 µM であることが分かる。Ciep = 40 µM であり、Ciep以上の濃度ではPS(-)は正 電荷をもち、この範囲ではS-C 曲線は Langmuir 型によく一致した。以上の結果 から、PS(-)に関して吸着等温線は、 𝑆 = ∆𝑆 + 𝑘!𝐶Γ!/ 1 + 𝑘!𝐶 で表されること が分かる。∆𝑆 = 40 µμM、k1=0.013 M-1、Γ1 = 246 µM である。 Figure 16 において PS(+)に対しても CPC が吸着していることから、PS(-)の電 荷が正に反転してもCPC がある程度吸着することが分かる。 silica 表面へのカチオン性界面活性剤の吸着は広く研究されており49,50、pH の 増加とともに吸着量が増加する47,48,51ことが報告されている。これはpH の増加 に伴い、silica 粒子の Zeffが増加するためである。酸性から中性の条件では、silica が持つ Zeffが小さく、粒子表面が親水性であるため、顕著な吸着は見られない。 本研究ではpH = 6 付近の値を示しており、silica 粒子表面のシラノール基は未解 離のものが多い。そのため、PS 粒子に比べて、silica 粒子への CPC 吸着は少な い。silica1 に対する CPC の吸着等温線は、Langmuir 型によく一致し S = k2CΓ2/(1+ k2C)により表現できる。このとき k2 = 0.069 M −1、﹅Γ 2 = 24 µM であった。
B-3. 臨界ミセル濃度変化
25℃における臨界ミセル濃度(c.m.c.)を、電気伝導度滴定により求めた。 Figure19 に Csurf-κcグラフを示す。Figure19(a)は超純水に対して CPC 水溶液を添
加した値、Figure 19(b)は粒子濃度φ = 0.006 の PS(-)1 を CPC 水溶液により滴定し た結果である。
各サンプルにおけるc.m.c.は、プロットの変極点から求められる(x 軸と直交 する破線で示した)。CPC の c.m.c.(water)は約 1.1 mM (Figure 19(a))、 PS(-)1 存 在下でのc.m.c.(PS(-)1)は約 1.3 mM (Figure 19(b))であった。この c.m.c.差からも CPC の PS(-)1 への吸着量を見積もることができた。S = 180 µM、C = 1.1 mM と なり、これはFigure 16(a)のグラフとも一致したため、c.m.c.変化からも吸着量が 求められた。
Figure 19 Electrical conductivity, κc, vs. Csurf plot for (a) water and (b) aqueous dispersion of PS1 (φ =
0.006). T = 25 °C. 120 100 80 60 40 20 0
2
1
0
C
surf(mM)
S/cm) 120 100 80 60 40 20 0 2 1 0C
surf(mM)
c(
S/cm)
c(
S/cm)
29
C. イオン性界面活性剤存在下でのコロイド粒子のクラスター形成
C-1. CPC 存在下での種々のコロイド粒子のクラスター形成
イオン性界面活性剤を添加したさいの荷電コロイド粒子の会合体形成につい て、光学顕微鏡を用いて検討した。PS(-)2, PS(+)1, silica2 を粒子として用いた。 Ctotal = 0.005vol%、﹅RN = 100 とし、Table V に示す粒子組み合わせで、会合状態の
CPC 濃度 Csurf依存性を検討した。 イオン性界面活性剤存在下では粒子は非会合、クラスター、凝集が形成され ることが確認された。Table V に分類の結果を示す。シンボルはそれぞれ、—:非 会合、○:クラスター、△:凝集である。あるCPC 濃度で一度会合体ができると CPC 濃度を変化させても非会合状態に戻らず、不可逆的であった。
Table V States of colloids in the presence of cethylpyridinium chloride (CPC) at various a concentrations
Csurf, determined by optical microscopy. Dashes, no cluster formation; circles, isolated clusters; triangles,
aggregation containing multiple central particles.