Title
REAL-TIME MONITORING OF DISSOLVED OXYGEN QUENCHED
FLUORESCENCE AND MATERIALS MOVEMENTS INDUCED
BEAM DEFLECTION AT A VICINITY OF AN AQUATIC PLANTS
Author(s)
Xing-Zheng WU
Citation
福岡工業大学エレクトロニクス研究所所報 第34巻 P17-P21
Issue Date
2017-10
URI
http://hdl.handle.net/11478/774
Right
Type
Departmental Bulletin Paper
Textversion publisher
福岡工業大学 機関リポジトリ
FITREPO
REAL-TIME MONITORING OF DISSOLVED OXYGEN QUENCHED
FLUORESCENCE AND MATERIALS MOVEMENTS INDUCED BEAM
DEFLECTION AT A VICINITY OF AN AQUATIC PLANTS
Xiaoyan WU (Life, Enviro
nment and Materials Science, Faculty of Engineering)
Luowei HUANG (Life, Enviro
nment and Materials Science, Faculty of Engineering)
Xing-Zheng WU (Life, Enviro
nment and Materials Science, Faculty of Engineering)
Abstract
A novel optical detection system was developed to achieve real-time and simultaneous monitoring of dissolved oxygen (DO) quenched-fluorescence and materials movement induced-beam deflection at a vicinity of an aquatic plant surface. A laser beam of 470 nm was passed through the vicinity of the aquatic plant in a culture dish filled with a culture solution containing 10-6 M
fluorescent Tris (2, 2'-bipyridyl) ruthenium (II) chloride. Deflection of the laser beam and fluorescence excited by the laser were recorded simultaneously. Experimental results showed that only a little ruthenium complex might be adsorbed on the aquatic plant. Also, romoving DO for obtaining fluorescence intensity without DO was studied. It was demonstrated that the optical detection system could be used for real-time in situ monitoring of the DO-quenched fluorescence and materilas movement-induced beam deflection at the same time.
Keywords: Fluorescence quenching, Dissolved oxygen, Aquatic plant, Beam deflection
1. Introduction
Aquatic plants play important roles in water environment. They provide oxygen and consume organic wastes. Some aquatic plants adsorb or degradate toxic substances. For example, aquatic plants can absorb heavy metal ions and decompose pollutants[1] such as salicylic acid[2], carbonic acid[3], et al.
However, different aquatic plants are with diffent abilitiy to absorb or decompose pollutants. Also, different organs in an aquatic plant are with different ability of absorbing or degradating toxic substances. It is not yet clear why the difference exists in the aquatic plants. If the materials movements across the aquatic plants suface can be in-situ real time monitored, it is definitely useful to explore why the difference exsits in the different aquatic plants. .
In the early research of aquatic plant activity, visual observations were used to record growth parameters of plant. For example, the height, amount and color were recorded in every observation period[4]; culture solution of plant was analyzed by
chemical methods to study the consuming and releasing of oxygen[5]; plant organs were grinded and extracted to study
changes of plant pigments[6]. Recently modern analytical methods
have been used in investigating plants activities. Visual analytical methods such as scanning electron microscope (SEM)
and microscopy are useful in observing morphology and anatomy changes such as the collapse of epidermal cells and structure changes[7-8]; atomic absorption spectroscopy is used to analyse the
quantility of chemicals in plant culture solution[9]; fluorescence
method is used widely to study chlorophyll changes in plant leaves[10]. However, these methods cannot achieve real-time
monitoring of the materials movements across the plants surface and tend to be time-consuming and costly.
We have applied the optical beam deflection method to investigate materials movements occurring at different locations of a plant, Typha angustifolia L[11]. The beam deflection at
different locations of both leaves and roots were monitored and compared for both a living and dead Typha. It was found that deflection signals changed with time and locations. Experimental results showed that the beam deflection method could be used for noninvasive sensing and monitoring of materials movements across the plant surface. The optical beam deflection method was further used to study effects of acid solution on plants[12]. It was further combined with Absorption Spectroscopy
method in studying effects of acid solution / acid rain on Egeria Densa and Ceratophyllum demersum L. It has been shown that the deflection method was more sensitive than the Absorbance Spectroscopy in studying the effects of acid rain on the aquatic plants[13]. However, the beam deflection signal and the
Xiaoyan WU, Luowei HUANG, Xing-Zheng WU
absorbance were not detected at the same time, they were measured separatly[13].
Among the substances involved in materials movements across aquatic plants surface or in water environment, dissolved oxygen (DO) is particularly important because of its close relation to plant’s photosynthesis / respiration processes, and plant growth rate[14]. Traditional detection methods for DO include iodometric
titration method[15] and current determination method[16].
Recently, fluorescent oxygen sensors based on the fluorescence quenching of oxygen has been built and commercialized[17-18].
The process of oxygen quenching follows the Stern-Volmer equations[17-18]:
F0/F = 1 + KSV CO2 (1)
where CO2 is concentration of DO; F0 and F are the fluorescence
intensities of the sample solutions without and with quenching of dissolved oxygen, respectively. KSV is the Stern-Volmer
constant.
The optical beam deflection method is a noncontact, noninvasive method, and can be used for in-situ monitoring of materials movements. Moreover, the beam deflection method can be used for real-time monitoring of materials movements at a vicinity of the plants. However, the shortage of this method is that it could not tell us what kinds of compounds are moved across the plant surface. For example, the DO movements across the plant surface cannot been analyzed quantitatively from the beam deflection signal. On the other hand, absorbance and fluorescence methods can achieve quantitative analysis. Thus, analytical performance will be greatly improved if the optical beam deflection method is combined with absorbance or fluorescence methods.
Here, we try to combine the optical beam deflection method and fluorescence method for building a novel optical detection system, which allows simultaneous monitoring of the fluorescence and beam deflection at a vicinity of the plant surface. A ruthenium complex (Tris (2, 2'-bipyridyl) ruthenium (II) chloride) was chosen as the fluorescent reagent for fluorescence quenching determination of DO. Firstly, whether the ruthenium complex is adsorbed on the aquatic plants is investigated. Secondly, romoving DO for obtaining F0 is studied. Thirdly,
Fluorescence and beam deflection changes at different distances of model sample plants are monitored, both in photosynthesis and respiration processes.
2. Experimental
2.1 Experimental setup
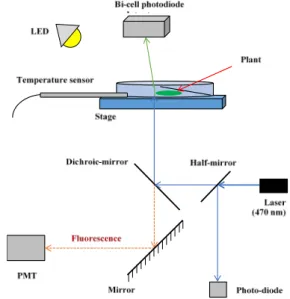
Figure 1 showed the details of the construction of the optical
beam deflection system. The system can be divided into two parts: the deflection detection part and fluorescence detection one.
A semiconductor laser (wavelength: 470 nm) was used as the probe beam. The culture dish was mounted on an X-Y micro-stage, which was used to adjust the distance between the probe beam and the plant surface or edge (distance was usually within 30 μm).
After the probe beam passed through the dish, it was focused to a bi-cell photodiode which was amounted on an X-Y micro-stage too. Photo-currents of two sides of the bi-cell were monitored at the same time, and their difference was considered as the deflection signal. At the beginning of the experiment, the beam was focused to the middle of the bi-cell, thus the difference of the photo-currents was 0. When the beam was deflected, the photo-current of one side of the bi-cell will increase and the one at the other side will decrease. Since the deflection signal caused by the plant was small, the difference between the two photo-currents was approximately considered to be proportional to the deflection angel.
Fig. 1 Experimental setup of the optical detection system.
A part of fluorescence from the vicinity passed through the dichroic mirror, and then reflected by a mirror to a PMT. Its intensity was detected by the PMT. A half-mirror was placed between the laser and dichroic mirror, so that a part of the laser light was reflected to a photo-diode, which was used for monitoring the reflected laser intensity to correct the laser light instability. A temperature sensor was placed near the dish. Deflection, temperature, reflected laser intensity, transmitted laser light intensity through the culture dish, and fluorescence signals were simultaneously recorded by a digital multi-meter.
The whole system was put into a black box in order to prevent the influence of outside light to fluorescence. And the light
source in photosynthesis process was provided by a white LED
(maxium intensity is 28 μW/cm2).
2.2 Fluorescence and absorbance spectrum measurement Excitation and fluorescence spectra of the ruthenium complex solution were measured by an F-2500 Fluorescence Spectrophotometer.
Fluorescence spectrum of the ruthenium complex solution after immersion of the plant sample was obtained as follows. A 1 cm long of the plant (0.05 g) was firstly washed by distilled water and 10-6 M ruthenium complex solution. Then the washed plant was
immersed into 20 mL 10-6 M ruthenium complex solution for 4 h.
The ruthenium complex solution after withdrawn of the plant was waited for another 2 h to measure fluorescence spectrum, and further compared with those of the ruthenium complex solution measured with same waiting time after prepared.
Absorbance spectrum of the sample solution was measured by the U-2910 Spectrophotometer.
2.3 Sample plants
Aquatic plant Ceratophyllum demersum L was used as a model sample plant, its photo was shown in Fig. 3.
Figure 3 Photo of Ceratophyllum demersum L
2.4 Reagents and preparation of culture solutions
10-6 M ruthenium complex solution was prepared as follows:
0.0064 g ruthenium complex was dissolved in 100 ml distilled water. Fifty μL of the solution was transferred to a 50-mL volumetric flask, then distilled water was added to 50 mL.
A hypoxic ruthenium complex solution was prepared by purging nitrogen gas for 30 min. Another hypoxic ruthenium complex solution was prepared by adding 0 - 0.02 M sodium sulfite. Each hypoxic ruthenium complex solution was filled into an airtight culture dish
2.5 Monitoring experiments of the aquatic plants
A 30 mL ruthenium complex solution was added in a closed culture dish. The fluorescence, deflection, transmitted laser intensity, reflected laser light intensity and temperature were
monitored by optical deflection system with the 470 nm laser for 12 h with either LED off or on.
A piece of Ceratophyllum demersum L (0.05 g) was firstly put into the culture dish filled with a ruthenium complex solution, and a part of the plant was covered with a piece of glass to prevent possible moving. Secondly, the distance between the probe beam and the plants was adjusted by the X-Y stage. Thirdly, position of the bi-cell photodiode was adjusted so that the laser beam passed through the culture dish illuminated to its center (the differential photocurrent of the bi-cell photodiode became zero). Fourthly, bias voltage was added to PMT, and the digital multi-meter was started to record signals from the temperature sensor, PMT, and bi-cell photodiode.
In photosynthesis and respiration processes, LED illumination was on and off, respectively.
3 Results and Disscusions
3.1 Excitation and fluorescence spectrum of ruthenium complex solution
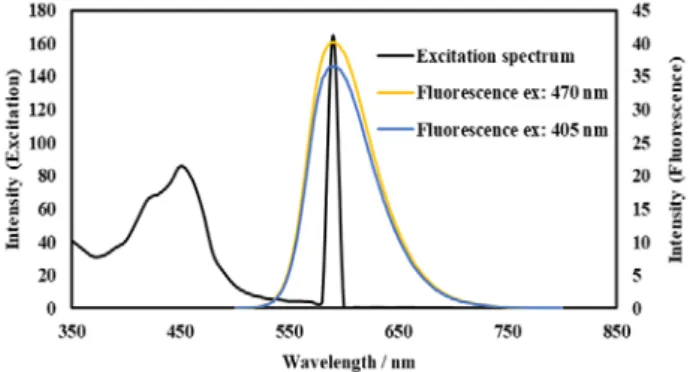
Figure 4 showed the excitation and fluorescence spectra of the ruthenium complex solution. The maximum fluorescence and excitation wavelengths were 590 and 450 nm, respectively. Although the maximum excitation wavelength was about 450 nm, laser of both 405 nm and 470 nm in the laboratory could excite fluorescence of the complex. Thus both the 405 nm and 470 nm laser could be used in the detection system as light sources. Compared with the fluorescence intensity excited by 405 nm and 470 nm, the fluorescence intensity excited by 405 nm was 36.6, and the one by 470 nm was 40.1. The fluorescence intensity excited by 470 nm was 9.6 % larger than that by 405 nm.
Figure 4 Excitation and fluorescence spectrum of ruthenium complex
3.2 Effect of immersion of aquatic plants on ruthenium complex solution
In order to make sure whether some compounds leaked from the plant would change the fluorescence of the ruthenium complex,
Xiaoyan WU, Luowei HUANG, Xing-Zheng WU
or the ruthenium complex would adsorb on the plant, fluorescence intensities of the ruthenium complex solution with or without 4 hours immersion of Ceratophyllum demersum L were compared. The results were shown in Fig. 5.
Figure 5 showed that, fluorescence intensity of the new prepared ruthenium complex solution was about 38.6. After 6 hours quiescence, the fluorescence became 36.4. The fluorescence intensity after soaking the plant for 4 hours and quiescent for 2 hours became 36.2. Although there was a little decrease in the fluorescence intensity of the ruthenium complex solution with time and with immersing of the plant, shapes of the three fluorescence spectrum were basically same. The decrease in the fluorescence intensity was about 0.57 % and 0.62 % for 6 hours quiescence, and 4 hours immersing of plant and 2 hours quiescence, respectively. These decreases might be caused by decomposition and adsorption to dish wall of the ruthenium complex, or just experimental error. It could be concluded that the immersion of the plant affect the fluorescence measurement little.
Absorption spectrum were also measured for the three solutions and the results were shown in Fig. 6. Figure 6 showed that absorbance of the new prepared ruthenium complex solution changed little after being placed for 6 h. This suggested that little changes in concentration of the complex solution in the 6 hours. On the other hand, the absorbance at 405 nm decreased for about 5.9 % after being soaked the plant for 4 hours and quiescent for 2 hours. The absorbance decrease might be caused by adsorption of the ruthenium complex on the aquatic plants. Another reason might be that relatively large experimental errors existed in the abosrbance because absorbance of the 10-6 M
complex solution was small.
Results of Figs 5 and 6 suggested that a little (about a few percent) adsorption of the complex occurred on the aquatic plants in 4 hours, however, it almost did not affect fluorescence of the complex solution.
Fig. 5 The fluorescence spectra of (a) fresh prepared ruthenium complex solution; (b) the ruthenium complex solution after be placed for 6h; (c) the ruthenium complex solution after
soaking plant for 4 h and be placed for 2h (fluorescence excitation: 405 nm).
Fig. 6 The absorption spectra of (a) fresh prepared ruthenium complex solution; (b) the ruthenium complex solution after be placed for 6h; (c) the ruthenium complex solution after soaking plant for 4 h and be placed for 2h
3.3 Removal of DO for obtaining F
0As shown in Eq. (1), fluorescence intensity of a hypoxic ruthenium complex solution (F0) should be obtained for obtaining
DO concentration. A hypoxic ruthenium complex solution was firstly prepared by purging nitrogen gas for 30 min. It was found that removal of DO was not enough by purging N2. Then,
another hypoxic ruthenium complex solution was prepared by adding sodium sulfite (Na2SO3).
Sodium sulfite is known as deoxidizing agent used for anaerobic solution. On the other hand, excessive addition of Na2SO3 may affect the fluorescence intensity of the complex
solution. Therefore, relationship of Na2SO3 concentration to
fluorescence intensity of the Ru(II) complex solutions were investigated (Fig. 7).
by the present detection system by a conventional fluorometer
Fig. 7. Relationship between the fluorescence intensity of Ru(II) complex solution to Na2SO3 concentrations measured by a
Figure 7 showed that both the conventional fluorometer and
the present detection system gave almost same results. This suggested that the present detection system could be used for fluorescence measurement. When the Na2SO3 concentration
increased from 0 to 0.08 M, fluorescence intensity increased because DO was removed and thus the fluorescence quenching of DO was decreased. When the Na2SO3 concentration was larger
than 0.08 M, the fluorescence intensity decreased a little. This might be due to the excessive Na2SO3 quenched the fluorescence
of the complex. Therefore, the optimum Na2SO3 concentration
was about 0.08M.
3.4 Monitoring of the aquatic plant
Deflection and fluorescence monitoring in the ruthenium complex solution without the aquatic plant was firstly carried out (Figs. 8-A and 8-B). Figure 8-A showed that fluorescence intensity of the complex solution without the aquatic plant kept stable, although noise was observed sometimes. On the other hand, when the complex solution was with the aquatic plant
Ceratophyllum demersum L, fluorescence intensity increased
during the monitoring period as shown in Fig. 8-C. This suggested that the oxygen near the plants leaf was decreasing during the monitoring period in the dark room.
Figure 9-B and 9-D showed comparison of the deflection signals in the complex solution without and with the plant. It is clearly that the deflection signals were different, suggesting materials movments exsited at the vicinity of the plant leaf.
When the white LED illuminated, a part of the white LED light entered the PMT, intensity of which was much larger than that of fluorescence. Thus, this detection system cannot detect the fluorescence signal during the LED illumination. However, deflection signals were obtained during the LED illumination. Experimental results showed that the deflection signal at vicinity of the aquatic plants were different from those in the complex solution without the plants.
Fig. 8 Fluorescence (A, C) and deflection (B, D) signals without (A, B) and with (C, D) the aquatic plant. The experiments were carried out in a dark room.
Improvements of the detection system including the applicability to the white LED illumination, correction of temperature change, quantitative determination of DO concentration by eq. (1) are being carried out, and will be reported elsewhere.
(Received on June 30, 2017) References
(1) Carmen Mânzatua, Boldizsár Nagya, Alessio Ceccarinib, Renato Iannellic, Stefania Giannarellib, Cornelia Majdika : “Laboratory tests for the phytoextraction of heavy metals from polluted harbor sediments using aquatic plants”, Marine Pollution Bulletin, Vol.101, No.2, 605-611 (2015) (2) Xiangdong Wang : “Lotus roots accumulate heavy metals independently
from soil in main production regions of China”, Scientia Horticulturae, Vol.164, No.17, 295-302 (2013)
(3) Shaoying Zhang, Youwei Yu, Chunling Xiao, Yuanyuan Tian : “Effect of carbon monoxide on browning of fresh-cut lotus root slice in relation to phenolic metabolism”, LWT-Food Science and Technology, Vol.53, No.2, 555-559 (2013).
(4) R.L. Jefferies, T. Rudmik : “Growth, reproduction and resource allocation in halophytes”, Aquatic Botany, Vol.39, No.1-2, 3-16 (1991)
(5) Y. Lipkin : “Thalassodendretum ciliati in Sinai (northern Red Sea) with special reference to quantitative aspects”, Aquatic Botany, Vol.31, No.1-2, 125-139 (1988)
(6) N. Parthasarathy, K. Ravikumar, K. Ramamurthy : “Floral biology and ecology of Halophila beccarii Aschers. (Hydrocharitaceae)”, Aquatic Botany, Vol.31, No.1-2, 141-151 (1988)
(7) McLaughlin SB, Mark G. Tjoelker, W.K. Roy : “Acid deposition alters red spruce physiology: laboratory studies support field observations”, Canadian Journal of Forest Research, Vol.23, No.3, 380-386 (1993)
(8) Ferenbaugh R W : “Effect of simulated acid rain on Phaseolus.American”, Journal of Botany, Vol.63, No.3, 283-288 (1982)
(9) Lance S. Evans, Thérèse M. Curry : “Differential Responses of Plant Foliage to Simulated Acid Rain”, Amer. J. Bot., Vol.66, No.8, 953-962 (1979) (10) Ibrahim J. Hindawi, James A. Rea, William L. Griffis : “Response of bush
bean exposed to acid mist”, Amercian Journal Botany, Vol.67, No.2, 168-172 (1982).
(11) X.-Z. Wu, T. Nakaoka, T. Inoue, and H. Inoue: “14.Optical Sensing of Materials Movements Occurring at a Plant Surface with a Probe Beam”, Sens., Actuators, Vol.155, 241-250 (2009).
(12) Liangjiao Nie, Mitsutoshi Kuboda, Tomomi Inoue, Xing-Zheng Wu: “Effect of acid solutions on plants studied by the optical beam deflection method”, Journal of Environmental Sciences, Vol.25 (suppl.), S93-S98 (2013) (13) X.-Z. Wu, L. Nie, T. Inoue: “2.Comparative studies on effects of acid
solutions on aquatic plants by beam deflection and absorbance spectroscopy methods”, Anal. Sci., Vol. 31, 837-841 (2015).
(14) Wei Liu, Meng Li, Ziren Luo and Gang Jin : “Using Electrochemistry-Total Internal Reflection Ellipsometry Technique to Observe the Dissolved Oxygen Reduction on Clark Electrode”, Electrochimica Acta, Vol.142, 371-377 (2014)
(15) R. Ramamoorthy, P. K. Dutta and S. A. Akbar : “Oxygen sensors: Materials, methods, designs and applications”, Journal of Materials Science, Vol.38, No.21, 4271-4282 (2003)
(16) Haijiang Tai, Yuting Yang, Shuangyin Liu, and Daoliang Li : “A Review of Measurement Methods of Dissolved Oxygen in Water”, Computer and Computing Technologies in Agriculture V, Vol.369, 569-576 (2012). (17) Felix Friedla, Nils Krah, Bernd Jähne : “Optical sensing of oxygen using a
modified Stern-Volmer equation for high laser irradiance”, Sensors and Actuators B: Chemical, Vol.206, 336-342 (2015)
(18) Junsheng Wang, Yongxin Song, Sun Jinyang, Xudong Wu, Yeqing Sun, Xinxiang Pan, Dongqing Lid : “Miniature fluorescent sensor for chloride ion concentration determination based on modified Stern-Volmer Equation”, Measurement, Vol.46, No.10, 3982-3987 (2013)