2
Abstract
This study focused on the automated driving system which automotive manufacturers are working on development. In recent years, the automated driving systems are under development and have various problems. The purpose of this study is to consider and evaluate the new technologies in order to countermeasure the problems of the automated driving systems. This study is consisted of 7 chapter according this purpose.
4 図1-1 交通事故死者数(2) 図 1-2 平成 29 年の AEB による追突事故低減効果の推定(5) 2,000 2,500 3,000 3,500 4,000 4,500 5,000 5,500 2006 2008 2010 2012 2014 2016 2018 2020 The num be r of fatal traffic accident Year 61417 16162 24460 20795 118918 32633 40242 46043 0 50,000 100,000 150,000 All vehiles Passenger vehicle Small passenger vehicle Light vehicle
The number of rear-end colision
5
1-1-2.自動運転システムの定義
6
表 1-1 自動運転システムのロードマップ(SAE J3016)(8)
Definition of level Definition of automated driving system Driving
responsibility Level 0
No Driving Automation
The performance by the driver of the entire DDT,
even when enhanced by active safety systems Driver
Level1 Driver Assistance
The sustained and ODD-specific execution by a driving automation system of either the lateral or the longitudinal vehicle motion control subtask of the DDT
(but not both simultaneously) with the expectation that the driver performs the reminder of the DDT.
Driver
Level2
Partial Driving Automation
The sustained and ODD-specific execution by a driving automation system of both the lateral and longitudinal vehicle motion control subtasks of the DDT with the
expectation that the driver completes OEDR subtask and supervises the driving automation system.
Driver
Level3
Conditioned Driving Automation
Sustained and ODD-specific performance by an ADS of the entire DDT with the expectation the DDT fallback-ready user is receptive to ADS issued requests to intervene, as well as DDT performance relevant system failures in other vehicle systems, and will respond appropriately.
Driver/System
Level4
High Driving Automation
The sustained and ODD-specific performance by an ADS of the entire DDT and DDT
fallback without any expectation that a user will respond to intervene. Sytem Level5
Full Driving Automation
The sustained and unconditional (i.e. not ODD-specific) performance by an ADS of the entire DDT and DDT fallback without any expectation that a user will respond to intervene.
8
9
11 1-1-4-2. 自動運転システムの安全要件 交通死亡事故の多くがドライバの違反やヒューマンエラーによって生じることから、 自動運転システムの実用化により、大幅な交通死亡事故の削減が期待されている。この ため、自動運転システムは、各レベルに応じた走行条件下において、高度な認知、判断 及び操作が求められる。また、自動運転システムの実現により、高齢者等の移動支援、 物流サービス等における運転手不足への対応等、道路交通に関する様々な課題を解決す ることが期待されているが、現状として、自動運転システムは開発途上の技術であり、 様々な問題を抱えている。自動運転システムの社会受容性を考慮すると、ドライバが自 動運転システムを正しく理解し使用すること、自車及び周囲の道路交通の安全が確保さ れることが必要である。以上を踏まえ、本ガイドラインでは、自動運転システムが安全 に普及するために自動運転システム関わる交通事故を防ぐことを目標として設定して いる。この目標を達成するために自動運転システムが満たすべき車両安全の定義を、「許 容不可能なリスクがないこと」、すなわち、自動運転システムの運行設計領域(以下、 ODD)4 において、自動運転システムが引き起こす人身事故であって合理的に予見され る防止可能な事故が生じないことと定め、この定義に基づいて自動運転システムが満た すべき車両安全要件を設定し、その安全性を確保することが規定されている。現段階で は、本ガイドラインにおいて、自動運転システムの安全性に関して10 個の項目が設定 されている(表1-2 参照)。 表1-2 自動運転システムの安全性に関する項目(18)
Vehiclesafety item Mainrequirements
Settingof ODD
Set the operational design domain (specific design conditions related to the driving environment based on which an automated driving system operates properly: ODD)
according to the performance of individual automated vehicles and use conditions to limit the driving environment and the way they are used
Safetyof automated driving systems
・Ensure systemsafety by providing redundancy to control or sensor systems, etc.
・Automatically stop a vehicle safely when it is difficult to continue automated driving, such as when the situation becomes outside of the set ODD, etc
Compliancewith Safety Regulations, etc
・Comply with the existing Safety Regulations for Road Vehiclesrelated to automated driving
12
Humanmachine interface (HMI)
・Install HMI that has the following functionsto notify the driver or passengers ofthe operation status of the automated driving system:- For conditional automated driving vehicles, to monitor to see if the driver is ready to take over driving from the system and issue an alarm as necessary (driver monitoring system, etc.)
・For conditional full automated drivingvehicles, to inform the driver or passengers (a person responsible for operation) in advance that the system has determined that it is difficult to continue automated driving and will stop the vehicle automatically
Installationof data recording devices
Havea device that records the operational status of the automated driving system, the status of the driver, etc.
Cybersecurity
Design and develop vehicles that take account of cybersecurity such as measures against automated vehicle hacking, etc. based on the most recent requirements on cybersecurity by the UN (WP.29) or other organizations
Safetyof vehicles used for unmanned driving services (additional requirement)
For automated vehicles used for unmanned driving services (conditional full automated driving),in addition to requirements (i) to (vi),have a camera that enables the operation control center to monitor the situation inside the vehicle, etc. and a function to automatically send a notification to the operation control center when the vehicle is stopped at emergency
Safetyevaluation
Verify and confirm safety in advance by conducting simulations, and test track and road tests in adequate combination for rationally foreseeable hazardous events within the set ODD
Safetyof in-use vehicles
Takemeasures such as maintenance (inspection) of automated vehicles and cybersecurity software update, etc. to ensure safety of in-use vehicles
Informationprovision to automated vehicle users
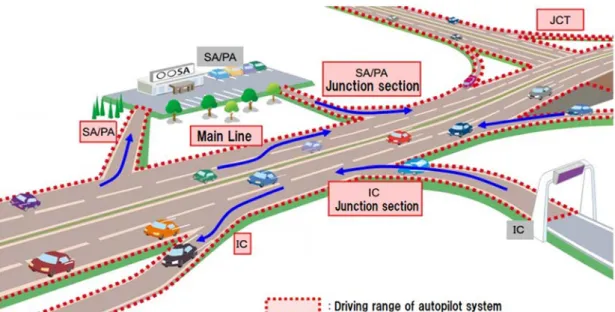
13 1-1-5. 自動運転システムの使用方法についての整理 上述したように自動運転システムレベル 3 の導入においては、国内におけるガイドラ インが発表され、国際的な議論も行われており、現在取り組んでいるところである。一 方で、自動運転システムレベル 4 については、ガイドラインの策定に資する研究報告は 数少ない。よって、本研究では自動運転システムレベル 5 を見据えたうえで、自動運転 システムレベル 4 について、本論文を展開する。まず、自動運転システムレベル 4 とレ ベル 5 を使用する際の流れを図 1-5 に整理する。上述したように自動運転システムレベ ル 4 は、高速道路を想定して運用される方針となっている。よって、目的地までの高速 道路での走行範囲が、自動運転システムが運転操作を担う部分であり、ドライバは市街 地での運転を担うこととなる。ここで問題となるのが、自動運転システムが高速道路に おいて、安定して走行することが可能であるのか。また、自動運転システムの車両制御 について安全性をどう担保するのかが重要となってくる。加えて、自動運転システムレ ベル 4 を想定するとドライバは、高速道路走行中において、睡眠を取ることも可能にな る。そこで、高速道路出口付近で出眠したばかりのドライバが、自動運転システムから 運転操作を引継ぎ、市街地を適切に運転することが求められる。一方で、自動運転シス テムレベル 5 では、現在地から目的地まで自動運転システムに運転操作を全てゆだねる ことから、運転操作の引き継ぎに関する問題は一切生じない。一方で、自動運転システ ムの車両制御について安全性をどう担保するのかがより重要となってくる。 (a) 自動運転システムレベル 4 (b) 自動運転システムレベル 5 図 1-5 自動運転システムの使用イメージ
Home
Driving operation Driver System OnCity Road Junction High way Junction
Driving operation System
System Off Driving operation Driver City Road
Destination
Home
Driving operation SystemCity Road Junction High way Junction City Road
20 3-2. 交通事故分析 3-2-1. 交通事形態別における交通事故の発生割合 まず、自動運転システムの車両制御を評価するための交通環境を明らかにするため に、2016 年に日本で発生した交通事故を分析した。図 3-1 は、交通事故形態別におけ る交通事故の発生割合を示す(36)。追突事故の発生割合は 36.7%と最も高く、次いで交 差点時の衝突事故の発生割合が 24.4%、そして衝突事故の発生割合が 17.2%を占め る。これらの交通事故の割合を合計すると 78.3%となり、交通事故全体の約 80%を占 める。 そこで、これら 3 つの事故形態の交通事故に着目し、過去 5 年間に遡る交通事故の 発生割合を分析した。図 3-2 は 2011~2016 年の事故形態別における交通事故の発生割 合を示す(37)(38)(39)(40)(41)。本分析から、過去 5 年間においても追突事故が 30%以上を占 め、増加傾向にあることを得た。また、過去 5 年間についても、2016 年の結果と同様 に、追突事故、交差点時の衝突事故、衝突事故の割合が全体の約 80%を占める。つま り、過去 6 年間において追突事故が最も多い交通事故であることがわかる。本研究で は、この追突事故に関わる制動制御に着目し、自動運転車の安全性を評価することと した。 図 3-1 交通事形態別における交通事故の発生割合(2016 年)(36) 図 3-2 交通事形態別における交通事故の発生割合(2011-2015 年)(37)(38)(39)(40)(41) 10.3% 17.2% 36.7% 24.4%
3.0%8.5% Collisions between pedestrian and vehicle
Front or side collision Rear-end collisions
21 3-2-2. 道路形状別における追突事故の発生割合 次に、自動運転システムによる制動制御の安全性を評価するための道路環境を明ら かにするために、追突事故が発生する道路形状を分析した。図 3-3 は、2016 年に日本 で発生した道路形状別における追突事故の発生割合を示す(36)。追突事故の割合は、カ ーブや曲がりなどがない単路における直線(以下、単路直線)において、59.9%と最 も多く、次いで交差点付近が 29.7%であった。単路直線と交差点付近での追突事故の 割合を合計すると 89.6%となり、約 90%の追突事故を占めることとなる。 そこで、これら二つの道路形状に着目し、5 年間に遡る道路形状別における追突事 故の発生割合を分析した。図 3-4 は 2011~2016 年の道路形状別における追突事故の発 生割合を示す(37)(38)(39)(40)(41)。本結果から、単路直線においての追突事故は、過去 5 年間 で最も多発する交通事故であり、約 60%を占めていることを示す。この交通事故分析 の結果に基づき、単路直線においての自動運転システムによる制動制御の安全性を評 価することとした。 図 3-3 道路環境別における追突事故の発生割合(2016 年)(36) 図 3-4 道路環境別における追突事故の発生割合(2011-2015 年)(37)(38)(39)(40)(41) 8.2% 29.7% 1.5% 59.9% 0.8% 0% 20% 40% 60% 80% 100%
Ratio of rea-end collision [%]
Intersection
Vicinity of intersections Curve
Straight section of a single road Other road 62.1% 62.0% 61.9% 61.8% 60.8% 26.4% 26.8% 27.4% 27.7% 28.7% 20% 30% 40% 50% 60% 70% 2010 2011 2012 2013 2014 2015 2016 Ra tio of re a-end collision [% ] Year
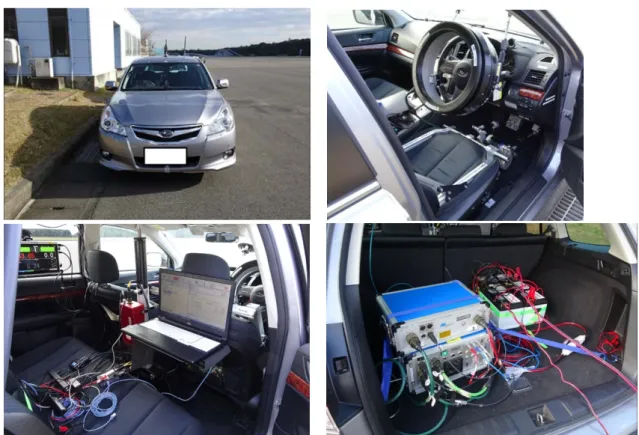
22 3-3. ドライバの制動制御に関する実験(実車実験) 3-3-1. 目的 本実験は、実車を用いて実験参加者が行う制動制御の減速度及び追従時に保つ車間 距離を定量的に計測することを目的とする。 3-3-2. 実験方法 3-3-2-1. 実験環境 本実験は、交通安全環境研究所の走行試験路(図 3-5 参照)において実施した。 図 3-5 走行試験路 3-3-2-2. 実験装置 本実験は、以下の実験機器を用いて実施した。 【前方車両】自動運転ロボットによって制御される車両(図 3-6 参照) 車両:スバル製レガシー(DBA-BR9)
23
図 3-6 前方車両
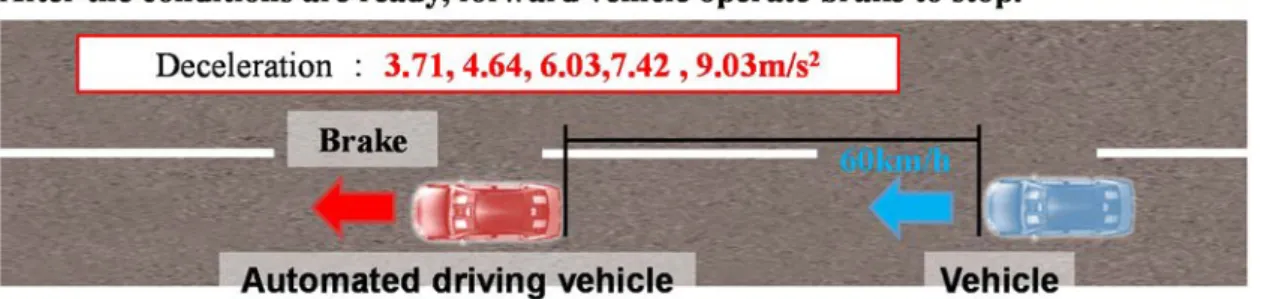
25 3-3-2-5. 急制動実験 本実験の目的は、自動運転システムの制動制御を評価する際の減速度を設計するた めの基になるデータを得ることである。実験シナリオは、一般道(法定速度 60km/h) とし、以下の手順で実施した。なお、GPS 計測器(図 3-7 参照)を用いて車両速度を 計測した。 ① 走行試験路(約 1km)上に 100m 毎に停止線を設置する。実験参加者車両の車両 速度が 60km/h で安定した後、実験参加者は自分で選択した停止線に向かって急 制動を行う。なお、実験参加者は、車両速度の調整に、Adaptive Cruise Control (以下、ACC)を使用する。
② ①の内容を練習とし、5 回程度練習を行う。
26 3-3-3. 実験結果 3-3-3-1. 追従実験結果 図 3-9 は、実験参加者の追従時の平均車間距離とその標準偏差を示す。なお、実験 参加者 No.7 の実験データについては、欠損データがあり本分析から除外することとし た(実験参加者の人数:8 名(男性:5 名、女性 3 名)、平均年齢 45.6 歳(標準偏差: 12.7 歳))。また、平均車間距離は、前方車両が 60km/h まで達した 15 秒後から、前方 車両が制動制御を行うまでの 5 秒間分のデータを安定した追従時の車間距離のデータ として用いている。つまり、実験参加者ごとの平均車間距離は、500 データ(サンプ リングタイム 0.01s の 5 秒間分のデータ)×5 回分のデータを平均した値である。本実 験結果より、全実験参加者における追従時の平均車間距離は、28.3m(標準偏差: 9.6m)であった。 図 3-9 追従時における車間距離と標準偏差 18.4 28.1 48.3 22.0 22.0 19.1 NA 32.6 36.3 28.3 0.0 10.0 20.0 30.0 40.0 50.0 60.0
No1 No2 No3 No4 No5 No6 No7 No8 No9 Ave.
28 3-3-4 自動運転システムの制動制御パターンの設計 3-3-4-1. 自動運転システムの追従時における車間距離の設計 追従時の車間距離は、追突事故の発生要因の一つである。そこで、本研究では車間 距離を一定にした追従時における自動運転システムの制動制御を評価することとし た。なお、追従時の車間距離を一定に保つために ACC を利用する。また、ACC で決 定される車間距離(以下、ACC 設定車間距離)は「3-3-3-1. 追従実験結果」で得られ た平均車間距離とその標準偏差をもとに表 3-1 に示す値を設定する。 表 3-1 ACC の設定車間距離
29 3-3-4-2. 自動運転システムの制動制御時における減速度の設計 本研究では、「3-3-3-2. 急制動実験結果」で得られた実験結果をもとに評価する自動 運転システムによる制動制御時の減速度を設計することとした。図 3-11 は、急制動実 験で得られた実験参加者車両の時間変化による車両速度を示す。また、同図にはこの データをもとに以下の手法に基づいて設計した基準となる制動制御(以下、基準制動 制御パターン)による時間変化の車両速度も合わせて示す。 ① 計測データの減速を開始した地点(59km/h 以下になった地点)から車両が停止 (1km/h 以下になった地点)するまでのデータを抽出。 ② 抽出したデータをもとに目的変数を車両速度、説明変数を時間として線形回帰 分析を行う。 ③ 算出した回帰式を用いて、基準制動制御パターンを求める。ただし、回帰式より 算出された車両速度が 60km/h 以上の区間は、車両速度を 60km/h に設定する。 また、車両速度が 0km/h 以下の区間は、車両速度を 0km/h に設定する。 図 3-11 計測データと基準制動制御パターンによる時間変化の車両速度 0 10 20 30 40 50 60 70 0 1 2 3 4 5 6
V
ehi
cle speed
:y[
k
m
/h
]
Time:x [s] Experimental dataReference braking control
y = -16.7 x + 63.1
31 図 3-12 AEB 模擬制動制御パターンによる時間変化の車両速度 表 3-2 減速度の割合と減速度の関係 Ratio of deceleration [%] 80 100 130 160 172 200 Deceleration [m/s2] 3.71 4.64 6.03 7.42 7.98 3.71 図 3-13 制動制御パターンによる時間変化の車両速度
0
20
40
60
0
1
2
3
4
5
6
Veh
icl
e speed
[k
m
/h
]
TImes [s]
AEB‐simulating braking control
pattern (172%)
Experimental data of AEB
Collision point
Time [s]V
ehi
cl
e speed
[k
m
/h]
Collision pointAEB-simulating braking control (Deceleration ratio:172%) Experimental data of AEB
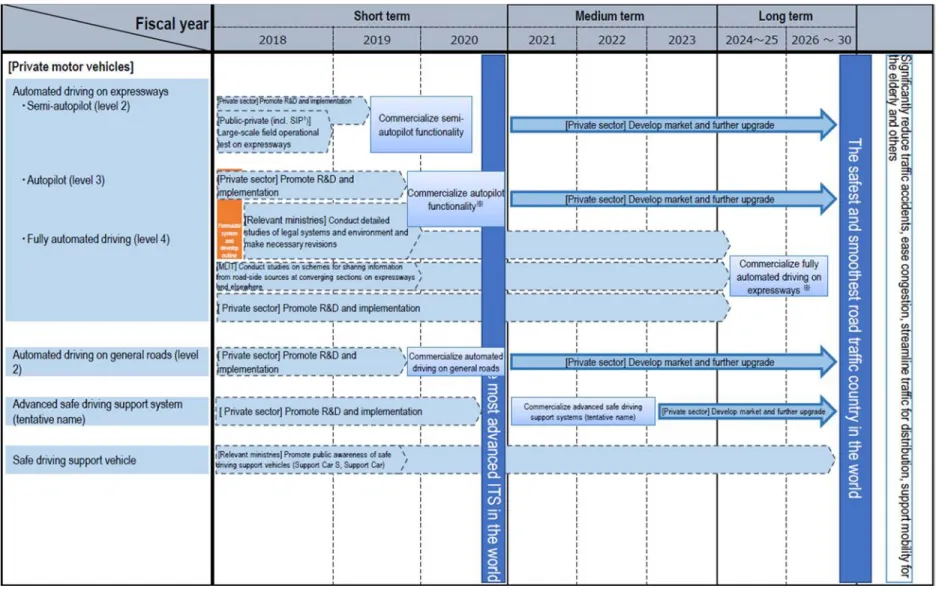
34 (a) 6 軸モーションと並進装置 (b) 車両と模擬視界表示装置 (c) 操作卓と監視モニタ (d) 簡易運転システム 図 3-15 DS 主要部分の風景 表 3-3 DS の視界表示装置諸元 Item Specification Viewing angle [deg] 216 (horizontal), 30 (vertical)
Screen size 800 (width), 600(height)
35 表 3-5 DS の 6 軸モーション装置の諸元 Item Specification Weight [kg] 2000 Moment of inertia [kg・m2] Longitudinal direction 3430 Vertical direction 4200 Lateral direction 3770 Range of movement [mm] Longitudinal direction ±300 Vertical direction ±300 Lateral direction ±290 Range of angle movement
[deg] Roll ±14 Pitch +13,-15 Yaw ±13 Maximum velocity [mm/s] Longitudinal direction 500 Vertical direction Lateral direction Maximum angle velocity
39
(d) Step4
(e) Step5
(f) Step6
41
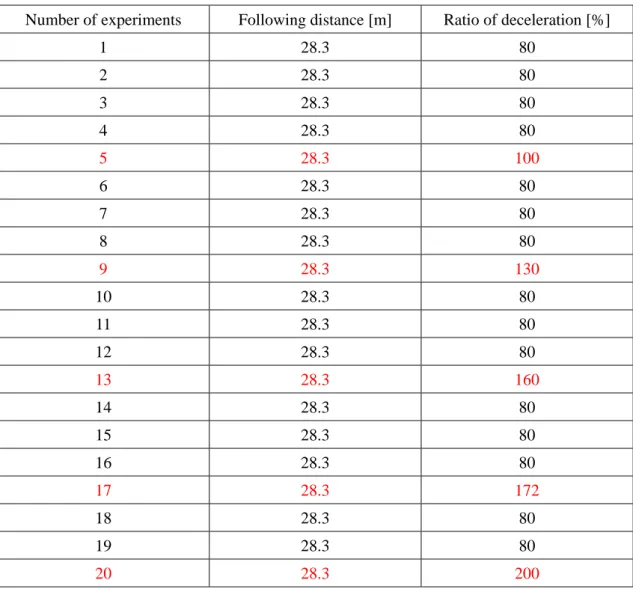
表 3-7 実験条件の順番例
Number of experiments Following distance [m] Ratio of deceleration [%]
42 3-4-5-3. 実験参加者 本実験の実験参加者は、12 名(男性 6 名、女性 6 名)であり、平均年齢は 47.9 歳(標 準偏差:9.6)であった。表 5-8 は、各々の年齢と性別を示す。実験参加者全員が運転免 許を保有しており、健康面に問題はなかった。本実験は、交通安全環境究所における「人 間を対象とする実験に関する倫理規定」に基づいて事前に審査が行われ、その承認のも とに実施した。 表 3-8 実験参加者の情報
Subject Age Gender
47 (a) ACC 設定車間距離:28.3m (b) ACC 設定車間距離:18.7m 平均評価 値 y A v e rag e sc ore of su bjec ti v e ev al u a ti o n :y Deceleration ratio:y [m] Linear regression ( y = -0.018x + 5.51) Areas where the driver feels dangerous
Deceleration ratio:x [%] 80 100 120 140 160 180 200 80 100 120 140 160 180 200 減速度の割合 x [%] 0 1 2 3 4 5 6 回帰直線( y = -0.019 x + 4.764 ) 危険を感じるライン A v e rag e sc ore of su bjec ti v e ev al u a ti o n :y Deceleration ratio:y [m] Linear regression ( y = -0.019x + 4.76) Areas where the driver feels dangerous
Deceleration ratio:x [%]
48 (c) ACC 設定車間距離:9.1m 図 3-19 減速度の割合毎の平均主観評価値 表 3-12 線形回帰分析による減速度の割合に対する主観評価推定値 Following distance Deceleration ratio [%] 80 100 120 140 160 180 200 28.3m 4.1 3.8 3.4 3.1 2.7 2.4 2.0 18.7m 3.4 3.0 2.6 2.2 1.8 1.4 1.0 9.1m 2.3 2.0 1.8 1.5 1.3 1.0 0.8 平均評価値 y A v er ag e scor e of su bj ect iv e ev al u at io n :y Deceleration ratio:y [m] Linear regression ( y = -0.011x + 3.10) Areas where the driver feels dangerous
Deceleration ratio:x [%]
52
53
表 4-1 DS の仕様
Degree of freedom Yaw, Roll, Pitch
Range
Yaw ±6.28 [rad] and over
Roll ±0.35 [rad]
Pitch ±0.35 [rad]
Maximum angular velocity
Yaw 3.14 [rad/s]
Roll 1.22 [rad/s]
Pitch 0.87 [rad/s]
Maximum acceleration a feeling of the body
Pitch 4.5 [m/s2]
Roll (Roll angle, Pitch angle, when 0.17 [rad]) Device of motion display AC servo motor and two ball screws
Steering reaction force AC servo motor 5~98 [N] Driving sound Control on actual sound of sampling Calculation of the vehicle Carsim produced by Mechanical Simulation
Sampling time 120 [Hz] Visual information Three projectors of front view
Visual range Horizontality 2.6 [rad] Verticality 0.52 [rad]
Calculator Eight computers, Visual information (6), Vehicle dynamics (1), Motion control (1)
Actuator
Four AC servo motor
Yaw 3.6 [kw]
Roll 2.5 [kw]×2
Pitch 2.5 [kw]×2
Steering reaction force 1.2 [kw]
Measurements Diameter 4.9 [m]
Height 2.9 [m]
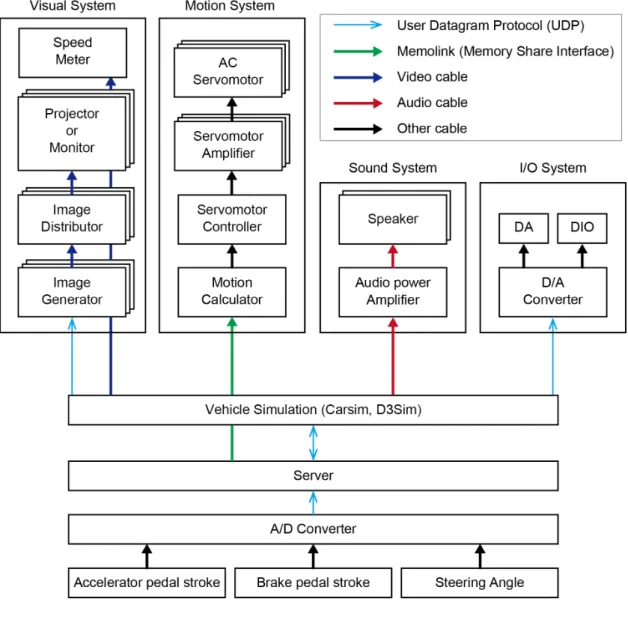
54 以下の図 4-2 に DS のシステム構成を示す。DS は、主に入出力システム、モーショ ンシステム、音響システム、視覚情報システムの 4 つで構成されている。DS の入力デ ータは、実験参加者の運転操作量であるアクセルペダルとブレーキペダルのストロー ク量及び、ステアリングの操舵角を用いる。各入力の操作量は、Analog to Digital Converter(以下、A/D コンバータ)を介してデジタル量として車両運動計算機に取り 込まれ、車両運動計算機に実装されている車両運動モデルが車両運動量や車両座標位 置を計算し、各システムに送信する構成となっている。 モーションシステムは、モーション計算機とサーボモータコントローラ、サーボア ンプ、ならびに 3 機の AC サーボモータにより構成されている。3 機の AC サーボモー タは、ヨー、ロール、ピッチの 3 軸方向に対して、入力操作量に対する車両挙動から 制御量を計算して実験参加者に与える加減速度の模擬をしている。
55
58
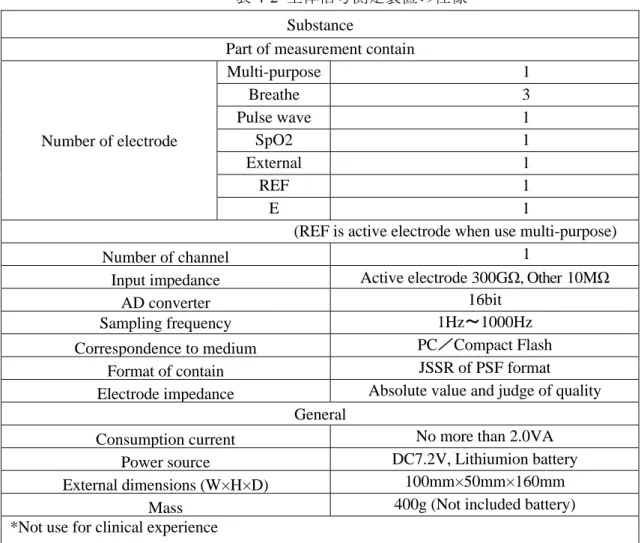
表 4-2 生体信号測定装置の仕様 Substance
Part of measurement contain
Number of electrode Multi-purpose 1 Breathe 3 Pulse wave 1 SpO2 1 External 1 REF 1 E 1
(REF is active electrode when use multi-purpose)
Number of channel 1
Input impedance Active electrode 300GΩ, Other 10MΩ
AD converter 16bit
Sampling frequency 1Hz~1000Hz Correspondence to medium PC/Compact Flash
Format of contain JSSR of PSF format
Electrode impedance Absolute value and judge of quality General
Consumption current No more than 2.0VA Power source DC7.2V, Lithiumion battery External dimensions (W×H×D) 100mm×50mm×160mm
60
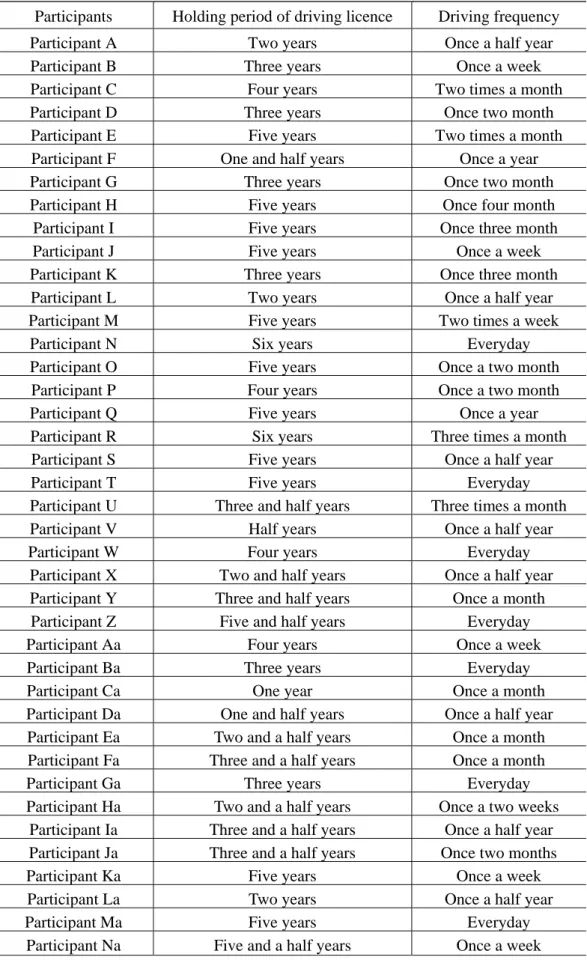
表 4-3 睡眠グループの実験参加者データ
Participants Holding period of driving licence Driving frequency Participant A Two years Once a half year Participant B Three years Once a week Participant C Four years Two times a month Participant D Three years Once two month Participant E Five years Two times a month Participant F One and half years Once a year Participant G Three years Once two month Participant H Five years Once four month Participant I Five years Once three month Participant J Five years Once a week Participant K Three years Once three month Participant L Two years Once a half year Participant M Five years Two times a week Participant N Six years Everyday Participant O Five years Once a two month Participant P Four years Once a two month Participant Q Five years Once a year Participant R Six years Three times a month Participant S Five years Once a half year Participant T Five years Everyday Participant U Three and half years Three times a month Participant V Half years Once a half year Participant W Four years Everyday
Participant X Two and half years Once a half year Participant Y Three and half years Once a month Participant Z Five and half years Everyday Participant Aa Four years Once a week Participant Ba Three years Everyday Participant Ca One year Once a month Participant Da One and half years Once a half year Participant Ea Two and a half years Once a month Participant Fa Three and a half years Once a month Participant Ga Three years Everyday Participant Ha Two and a half years Once a two weeks
61
表 4-4 覚醒状態の実験参加者データ
Participants Holding period of driving licence Driving frequency Participant Oa Four years Once a month
Participant Pa Three years Once a week Participant Qa Six years Once a half year Participant Ra Six years Two times a week Participant Sa Five years Everyday Participant Ta Three years Once a month Participant Ua Three years Three times a month Participant Va One and half year Once a half year Participant Wa Five years Two times a week
Participant Xa Four years Once a year Participant Ya Five years Once a month Participant Za Five years Four times a week Participant Ab Four years Once three month Participant Bb Four years Everyday Participant Cb Five years Once a month Participant Db Four years Once a week Participant Eb Four years Once a year Participant Fb Three years Two times a month Participant Gb Three years Two times a month Participant Hb Five years Once a month
Participant Ib One year Once a year Participant Jb Five years Once a week Participant Kb Five years Once a month Participant Lb Four years Once a month Participant Mb Four years Once a half year
62
4-3-3. 脳波測定
73 表 5-1 DS の仕様 Motion Device Mass 1000kg Range X +116/-106mm Y ±104mm Z +114/-104mm Yaw ±7.3deg Roll ±7.7deg Pitch +7.7/-8.1deg Maximum Velocity X ±500mm/s Y Z
Maximum Angular Velocity
Yaw ±33deg/s Roll Pitch Maximum Acceleration X ±0.6G Y Z ±0.5G Turntable Device Mass 500kg Moment Of Inertia 200kgm2 Range ±180deg
76
5-2-2. 脳波の測定装置
77
表 5-2 Polymate Mini AP108 の仕様 Substance
Part of measurement contain
Number of electrode Multi-purpose 8
External 2
REF 1
E 1
REF is active electrode when use multi-purpose Number of channel 1
Input impedance Active electrode 300GΩ、 Other 10MΩ
AD converter 20bit
Sampling frequency 500/1000Hz Correspondence to medium PC/CompactFlash
General
Power source DC5V, Lithium-ion battery External dimensions
(W×H×D)
52mm×50mm×20mm Mass 80g, (Not included battery)
78 5-2-3. 覚醒手法用の装置 本研究では、VIBRO-TRANSDUCER Vt708(以下、振動子)を使用して、実験参加 者に振動を与える。図 5-6 に振動子の概略図、表 5-3 に振動子の仕様を示す。この振 動子を運転席の座席に取り付け、実験参加者に振動を与えることとした。 図 5-6 振動子の概略図 表5-3 振動子の仕様 Impedance 8Ω±15%(150Hz,4V) Input 10W(20W) Polarity Black:- White:+
Size [mm] 115(W)×116(D)×30.5(H)
Weight [g] 500
79 5-3. 脳波の計測方法 5-3-1. 脳波の概要 人の脳は、およそ百億以上の神経細胞がネットワークを形成している。脳内のネッ トワークの情報伝達活動は、個々の神経細胞の活動に伴って生じる電位変化によるも のである。一つ一つの神経細胞で発生する電位変化は-80mV~+40mV と大変微弱であ る上、一般的に用いられる頭皮に電極を配置する場合、図 5-7 に示すように頭皮や頭 蓋骨の何層にわたる膜や髄液などかなり離れた距離にある大脳皮質から電位を受け取 るため、計測される脳波は数百万の神経細胞が発生させる電位変化が重なりあったも のを計測している(43) (44)。脳波は、周波数によって表 5-4 に示すように 4 種類に分ける ことができる(45)。 図 5-7 脳波計測装置 表 5-4 脳波の周波数
Frequency [Hz] Name Classification State 0.5~4.0 Less than δ Wave Slow Wave Sleeping 4.0~8.0 Less than θ Wave ‐ Sleeping 8.0~13.0 Less than α Wave Fast Wave Low Alertness
80
5-3-2. 電極の配置方法
86 図 5-12 歩行者との衝突割合 図 5-13 ブレーキストローク 100% 90% 100% 10% 0% 10% 20% 30% 40% 50% 60% 70% 80% 90% 100%
Awake 2 minutes 5 minutes
Collision Collision avoidance
87 5-5-2. ドライバのブレーキ反応時間 図 5-14 は、実験参加者が歩行者の飛び出しに対して、ブレーキを踏むまでの反応時 間を実験条件別(1:覚醒状態、2:2 分間の刺激を与えた場合、3:5 分間の刺激を 与えた場合)に示す。本研究に使用した DS では、ブレーキストロークが 20%以下の 時、車両の制動力が発生しない仕様になっている(ブレーキペダルの遊び)。そこで、 本研究では歩行者が飛び出してから、ブレーキストロークが 20%まで踏み込まれる時 間をブレーキ反応時間と定義した。2 分間の刺激を与えた場合、平均ブレーキ反応時 間は 0.97 秒となり、覚醒時の 0.93 秒と比較して 0.4 秒遅いという結果になった。一方 で、5 分間の刺激を与えた場合、平均ブレーキ反応時間は 0.93 秒となり、覚醒時の 0.93 秒と比較すると、一緒になるという結果を得た。また、標準偏差はそれぞれ 0.11 秒(覚醒時)、0.08 秒(2 分間の刺激)、0.10 秒(5 分間の刺激)となっており、ばらつ きは同程度であった。この実験結果を基に各実験条件におけるブレーキ反応時間に対 して、等分散を前提とした優位水準 5%における t 検定を行うこととした。覚醒時と 2 分間の刺激を与えた場合のデータ間に対して t 検定を行うと、p 値は 0.48 となり確率 分布は一致しないという結果になった。一方で、覚醒時と 5 分間の刺激を与えた場合 のデータ間に対して t 検定を行うと、p 値は 0.92 となり同程度の確率分布であること が示された。また、覚醒時の標準誤差を算出すると 0.03 秒となった。覚醒時と 5 分間 の刺激を与えた場合の実験結果を比較すると標準誤差の範囲内であることに加え、10 人の実験参加者数でも充分にばらつきが少ないデータが取得できていることがわか る。以上の結果を踏まえると、2 分間の刺激では実験参加者への覚醒手法の覚醒効果 は確認できたが、覚醒効果が不十分であり、覚醒時と同程度のブレーキ反応時間にな らないことが明らかになった。一方で、5 分間の刺激を与えることによって、覚醒時 と同程度のブレーキ反応時間になることが明らかになった。 図 5-14 ブレーキ反応時間 0.5 0.6 0.7 0.8 0.9 1 1.1 1.2 1.3 1.4 1.5
Awake 2 minitues 5 minitues
88 5-5-3. ドライバのブレーキペダル踏力の最大値 本実験では、DS のブレーキペダルに踏力計を装着し、ドライバがブレーキペダルに かける踏力も合わせて計測している。本解析では、ドライバのブレーキ操作時に生じる 最も高い踏力を最大ブレーキ踏力と定義している。図 5-15 は、実験参加者がブレーキ 操作を行う際の最大ブレーキ踏力を実験条件別(1:覚醒状態、2:2 分間の刺激を与 えた場合、3:5 分間の刺激を与えた場合)に示す。2 分間の刺激を与えた場合、平均 最大ブレーキ踏力は 487N となり、覚醒時の 574N と比較して約 85%のブレーキ踏力と なった。一方で、5 分間の刺激を与えた場合、平均最大ブレーキ踏力は 545N となり、 覚醒時の 574N と比較して約 95%のブレーキ踏力になった。また、標準偏差はそれぞれ 326N(覚醒時)、215N(2 分間の刺激)、278N(5 分間の刺激)となっており、各実験条 件のばらつきは等しくなかった。この結果を基に各実験条件における最大ブレーキ踏力 が同程度であるのかを評価するために、分散が等しくないことを前提とした優位水準 5%における t 検定を行うこととした。覚醒時と 2 分間の刺激を与えた場合のデータ間 に対して t 検定を行うと、p 値は 0.51 となり確率分布は一致しないという結果になっ た。一方で、覚醒時と 5 分間の刺激を与えた場合のデータ間に対して t 検定行うと、p 値は、0.83 となり同傾向の確率分布であることが示された。また、先行研究では、出眠 時と覚醒時の最大ブレーキ踏力において有意差(p 値が 0.05 以下)があることが報告さ れている(32)。以上の結果を踏まえると、ブレーキ反応時間の解析と同様に 2 分間の刺激 では実験参加者への覚醒手法による覚醒効果は確認できたが、覚醒効果が不十分であり、 覚醒時と同程度の最大ブレーキ踏力でブレーキを踏むことができないことが明らかに なった。一方で、5 分間の刺激を与えることによって、覚醒時と同程度の最大ブレーキ 踏力でブレーキを踏むことができることが明らかになった。 図 5-15 最大ブレーキ踏力 0 100 200 300 400 500 600 700 800 900 1000 1100 1200 1300 1400 1500
Awake 2 minitues 5 minitues
119 参考文献 (1) 内閣府:第 10 次交通安全基本計画, https://www8.cao.go.jp/koutu/kihon/keikaku10/pdf/kihon_keikaku.pdf, (参照 2019.09.11). (2) 警視庁:平成 30 年中の交通事故死者数について, https://www.e-stat.go.jp/stat-search/file-download?statInfId=000031782696&fileKind=2, (参照 2019.09.11) (3) 公益財団法人 交通事故分析センター:ITARDA INFORMATION73, pp.1-12 (2008). (4) 戦略的イノベーション創造(SIP):戦略的イノベーション創造プログラムの概要, https://www8.cao.go.jp/cstp/gaiyo/sip/sipgaiyou.pdf, (参照 2019.09.11). (5) 公益財団法人 交通事故分析センター:AEB による追突事故低減効果の分析, 交通 事故分析統合センター 第 21 回研究発表会, pp.1-12.
(6) NHTSA:Department of Transportation Releases Policy on Automated Vehicle Development, 14-13Thursday, May 30, 2013.
(7) Christina Rodel, Susanne Stadler, Alexander Meschtscherjakov, ManfredTscheligi: Towards Autonomous Cars: The Effect of Autonomy Levels on Acceptance and User Experience, Sigmund-Haffner-Gasse 18, 5020 Salzburg, Austria.
(8) SAE:Taxonomy and Definitions for Terms Related to On-Road Motor Vehicle Automated Driving Systems, J3016, January 16, 2014.
(9) UNECE:WP29, Regulation No.79 Automatically Commanded Steering Function (ACSF), Results of the Study on ACSF Transition Time (ACSF-04-15),
https://wiki.unece.org/display/trans/ACSF+4th+session, (参照 2019.09.11).
(10) 経済産業省:自動走行ビジネス検討会「自動走行の実現に向けた取組方針」, https://www.meti.go.jp/policy/mono_info_service/mono/automobile/Automated-driving/report-Version2.0.pdf, (参照 2019.09.11).
(11) Ministry of Land:Infrastructure and Transport of Japan, Abstract of Autopilot system, Autopilot system project, Vol. 4.
120 (17) 本間亮平, 若杉貴志, 小高賢二:高度自動運転における権限移譲方法の基礎検討 (第 4 報), 自動車技術会論文集, Vol.50, No.4, pp. 517-523 (2019). (18) 国土交通省自動車局:自動運転システムの安全技術ガイドライン, https://www8.cao.go.jp/cstp/gaiyo/sip/sipgaiyou.pdf, (参照 2019.09.11). (19) 谷田公二, 木村真弘, 吉田雄一:自動運転システム制御へ向けた高速道路での合流 行動モデル, 自動車技術会論文集, Vol.48, No.4, pp. 885-890 (2017). (20) 米陀佳祐, 三田誠一, ヤンチェンシー, ドーコクフイ, テヘラニホセイン, 江川万 寿三, 武藤健二:自動運転システム用のレーンチェンジ経路計画, 自動車技術会論 文集, Vol.47, No.1, pp. 165-170 (2016). (21) 住岡忠使, 西宮憲治, 飽田好恭:非線形モデル予測制御とグラフ理論を用いた 他 車混合交通状況における自動運転制御, 自動車技術会論文集, Vol.48, No.6, pp. 1353-1358 (2017). (22) 住岡忠使, 西宮憲治, 飽田好恭:非線形モデル予測制御と動的計画法を用いた他車 混合交通状況における車両軌道と速度生成, 計測自動制御学会論文集, Vol.53, No.2, pp. 198-205 (2017). (23) 加藤晋, 橋本尚久, 津川定之:隊列走行システムのHMIにおける隊列形成支援と 受容性検討, 自動車技術会論文集, Vol.43, No.2, pp. 643-648 (2012). (24) 須田義大, 青木啓二:自動運転技術の開発動向と技術課題, 情報管理, Vol.57, No.11, pp. 809-817 (2015). (25) 飯田克弘, 淺田真敬, 多田昌裕, 筑後智弘, 西田将之, 安時亨, 澤田英郎:ACC 車 両が混在する高密度交通流の挙動と運転者挙動への影響, 交通工学論文集, Vol.5, No.1, pp. 80-89 (2017). (26) 和田隆弘:自動運転と手動運転をつなぐ権限共有モード, 横幹連合コンファレン ス予稿集(2017). (27) 岸浩司, 赤松幹之, 遠藤照昌:自動運転中の運転への準備レベルについての一考 察, 自動車技術会論文集, Vol.48, No.4, pp. 903-908 (2017). (28) 萩原亨, 清水一喜:低速走行時における自動運転から運転操作に戻るリクエスト に対する ドライバ応答に関する研究, 自動車技術会論文集, Vol.49, No.4, pp. 832-838 (2016). (29) 久米拓弥:車載装備を利用した漫然状態の検出および解消手法の開発, DENSO TECHNICAL REVIEW, Vol.21, pp.117 (2016).
121
(31) Keisuke S., Katsuya G., Shun'ichi D., Toshihiko T., Kazunori H., Keiichi S., Evaluation of the effectiveness of advanced driving headlights using a driving simulator, Mechanical Engineering Jounal 2016, Vol. 3, No. 4, pp.16-00090 (2016).
(32) Gokan, M., Tanaka, N., Furukawa, Y., Iwase, T., Hirowatari, T., Study on a Method for Evaluating the Safety of the Braking Control Algorithm for Automated Driving System When Following, SAE Technical Paper 2019-01-1015 (2019).
(33) Gokan, M., Yamaguchi, D., Hirose, T., Driving Characteristics when Autonomous Driving Change to Driver in Low Alertness and Awake from Sleeping, SAE Technical Paper 2018-01-1081 (2018). (34) 後閑雅人, 廣瀬敏也:ドライバの出眠時における自動運転から手動運転に遷移す る際の覚醒手法に関する研究,交通科学学会論文集, Vol.19, No.1 (2019) (35) 後閑雅人, 青木義郎, 田中信壽, 安本まこと, 山村志, 中澤美紗子:前照灯照射範 囲の違いによる歩行者の被視認性の変化, 自動車技術会論文集, Vol.48, No.4, pp. 873-878 (2017). (36) 公益財団法人 交通事故統合分析センター:交通統計平成 28 年版 (37) 公益財団法人 交通事故統合分析センター:交通統計平成 27 年版 (38) 公益財団法人 交通事故統合分析センター:交通統計平成 26 年版 (39) 公益財団法人 交通事故統合分析センター:交通統計平成 25 年版 (40) 公益財団法人 交通事故統合分析センター:交通統計平成 24 年版 (41) 公益財団法人 交通事故統合分析センター:交通統計平成 23 年版 (42) Jasper H. H:The ten twenty electrode system of the international federation,
Electroencephalography and Clinical Neurophysiology, No.10, pp.371-375 (1958). (43) 研究ノート脳波の謎:リズムとその存在理由, 多摩大学研究紀要経営情報研究,
No.21, pp.94-95 (2017).
(44) 脳波の基礎知識:臨床神経生理学, Vol.42, No.6, pp.365 (2014).
(45) 林光緒:居眠りの競り的メカニズム, 国際交通安全学会誌, Vol.38, No.1, pp.53-54 (2013).
(46) European New Car Assessment Program:Euro NCAP 2018 5 Star Requirements,
https://www.testsitesweden.com/sites/default/files/content/euro_ncap_asta_zerotesters_day _2017-04-25.pdf, (参照 2019.09.11).
(47) Kales Anthony, Rechtschaffen Allan:A manual of standardized terminology, techniques and scoring system for sleep stages of human subjects, Bethesda, Md. U. S. National Institute of Neurological Diseases and Blindness, Neurological Information Network, 1968. (48) 警視庁:平成 26 年中の交通事故の発生状況 (2015)
122
(49) 茨城県警察本部交通企画課:ライト切り替えによる交通事故防止,
https://www.pref.ibaraki.jp/kenkei/a02_traffic/archives/blockprint/pdf/h31/h31-08.pdf, (参照 2019.09.11)
123 研究業績 【研究論文】 1. 後閑雅人, 青木義郎, 田中信壽, 安本まこと, 山村志, 中澤美紗子:前照灯照射範囲 の違いによる歩行者の被視認性の変化, 自動車技術会論文集, Vol.48, No.4, pp. 873-878 (2017). 2. 後閑雅人, 廣瀬敏也:ドライバの出眠時における自動運転から手動運転に遷移する 際の覚醒手法に関する研究,交通科学学会論文集, Vol.19, No.1 (2019)
3. Hirose, T, Gokan, M., Kasuga, N., Sawada, T., A Study on Modeling of Driver's Braking Action to Avoid Rear-End Collision with Time Delay Neural Network, SAE International Journal of Passenger Cars - Mechanical Systems, 2014-01-0201
【国際会議】
1. Gokan, M., Yamaguchi, D., Hirose, T., Driving Characteristics when Autonomous Driving Change to Driver in Low Alertness and Awake from Sleeping, SAE Technical Paper 2018-01-1081
2. Gokan, M., Tanaka, N., Furukawa, Y., Iwase, T., Hirowatari, T., Study on a Method for Evaluating the Safety of the Braking Control Algorithm for Automated Driving System When Following, SAE Technical Paper 2019-01-1015
3. Hirose, T, Gokan, M., Kasuga, N., Sawada, T., A Study on Modeling of Driver's Braking Action to Avoid Rear-End Collision with Time Delay Neural Network, SAE Technical Paper, 2014-01-0201
4. Hirose, T, Ohtsuka, Y., Gokan, M., Activation Timing of a Collision Avoidance System with V2V Communication, SAE Technical Paper 2017-01-0039
5. Miyata, A., Gokan, M., Hirose, T., Accuracy of a Driver Model with Nonlinear AutoregRessive with eXogeous Inputs (NARX), SAE Technical Paper 2018-01-0504 6. Suzuki,K., M., Gokan, M., Hirose, T., Effect of Driver Posture on Driving Characteristics
when Control is Passed from an Autonomous Driving System to a Human Driver, SAE Technical Paper 2018-01-1173
【解説書】

![表 3-4 DS の並進装置の諸元 Item Specification Weight [kg] 4760 Stroke [mm] 800 Maximum velocity [m/s] 3.5 Maximum acceleration [m/s 2 ] 3.92](https://thumb-ap.123doks.com/thumbv2/123deta/9765907.1849911/40.892.128.765.149.679/表34DSの並進装置の諸元ItemSpecificationWeightkg476Strokemm8Maximumvelocityms35Maximumaccelerationms.webp)