Fukushima Medical University
福島県立医科大学 学術機関リポジトリ
This document is downloaded at: 2021-11-08T00:01:35Z
Title KRT17 as a prognostic biomarker in stage II colorectal cancer(
本文 )
Author(s) 氏家, 大輔
Citation
Issue Date 2019-03-22
URL http://ir.fmu.ac.jp/dspace/handle/123456789/978
Rights © The Author(s). This preprint article has been accepted for publication in [Carcinogenesis] Published by Oxford
University Press.
DOI
Text Version ETD
学 位 論 ⽂
KRT17 as a prognostic biomarker in stage II colorectal cancer.
(stage II ⼤腸癌における予後予測バイオマーカーとしての KRT17)
福島県⽴医科⼤学⼤学院医学研究科 消化管外科学分野
⽒家 ⼤輔
論 ⽂ 内 容 要 旨(和⽂)
学位論⽂題名
KRT17 as a prognostic biomarker in stage II colorectal cancer.
(stage II ⼤腸癌における予後予測バイオマーカーとしての KRT17)
⼤腸癌治療において⼿術は主要な役割を担う。Stage I 症例は⼿術単独で良好な予後を得 られるが、stage Ⅲでは⼿術に加え術後補助化学療法を⾏うことで予後が改善することが 明らかにされている。⼀⽅、stage Ⅱでの術後補助化学療法の有⽤性は確⽴されておら ず、臨床病理学的な再発⾼リスク群に対して化学療法を⾏うのが現時点での妥当な戦略 とされているが、その適応について未だ明確なコンセンサスはない。本研究の⽬的は、
stage II ⼤腸癌術後の再発⾼リスク症例を判別するバイオマーカーの作成である。⼤規模 かつ複数の⼤腸癌コホートを⽤いた網羅的発現解析と免疫組織染⾊を⾏い、再現性の⾼
い分⼦マーカーの抽出と、簡便かつ⽇常的な⼿技への応⽤を試みた。9 つの独⽴したコ ホート、いずれも根治⼿術を施⾏された総計 997 例の stage II ⼤腸癌症例を⽤いた。計 458 症例、4 つのマイクロアレイコホート(Microarray Discovery set)の網羅的発現解析 により、各コホートに共通して再発の有無と有意に関連し発現変動する 6 つの遺伝⼦が 抽出され、そのうち KRT17 遺伝⼦を含む 4 つの遺伝⼦発現は無再発⽣存期間と有意に 関連していた。なお 4 つの遺伝⼦のうち KRT17 遺伝⼦のみが、89 例の独⽴したコホー ト(Microarray Validation set 1)において有意に無再発⽣存期間と関連していた。さら に、93 例のマイクロアレイコホート(Microarray Validation set 2)、および 183 例の RNA シークエンスコホート(RNA-seq Validation set)において、KRT17 発現は無再発⽣存 期間と有意に関連していた。多変量解析により、KRT17 遺伝⼦の⾼発現は、臨床⾼リス ク因⼦のデータを持つコホートにおいて、他の臨床⾼リスク因⼦に対し独⽴して不良な 無再発⽣存期間と関連していた。これらの転写レベルでの KRT17 発現と予後不良との 関連を、免疫組織染⾊(IHC)を⽤いてタンパク発現レベルでの検出に応⽤した。110 例 および 44 例の 2 つの⼤腸癌 FFPE コホートに対し KRT17 の免疫組織染⾊を⾏った
(IHC Validation set 1、IHC Validation set 2)。いずれのコホートでも KRT17 染⾊陽性 症例は有意に不良な無再発⽣存と関連していた。また多変量解析により、KRT17 染⾊は 既知の臨床病理学的な再発⾼リスク因⼦と独⽴して無再発⽣存と関連していた。以上よ り複数のコホートを⽤いた多段階の検証を経て、新規の再発関連遺伝⼦として KRT17 を同定し、極めて⾼い再現性を⽰した。したがって KRT17 染⾊は、stage II ⼤腸癌術後 の再発リスクを層別化するための予後バイオマーカーとして、実臨床における stage II
⼤腸癌患者の個別化医療に有⽤であることが⽰唆される。
Abstract
The mainstay of treatment for patients with stage I-III (locoregional) colorectal cancer is surgical resection. Large randomized trials revealed that adjuvant treatment significantly improves survival in stage III patients. However, the role of adjuvant treatment for stage II CRC remains inconclusive, despite numerous clinical trials and meta-analyses. This study aimed to develop clinically useful biomarkers that can identify a subset of stage II patients with high risk of relapse after surgery.
We investigated comprehensive expression analysis using several cohorts of colorectal cancer and immunohistochemical staining and attempted to extract highly reproducible molecular markers and apply it conveniently to routine procedures.
We analyzed 997 stage II colorectal cancer patients in nine independent cohorts in this study. We initially analyzed four independent Affymetrix microarray cohorts of stage II patients as discovery datasets. Six genes were found as candidate genes which were associated with relapse. Furthermore, four genes were associated with Relapse free survival. KRT17 was found to be the only gene whose expression was significantly associated RFS in 89 stage II patients in Microarray Discovery set.
Moreover, KRT17 expression was significantly associated with relapse-free survival in 93 patients in Microarray Validation cohort and 183 patients in RNA Sequence cohort.
To investigate whether the expression of KRT17 in protein levels could also identify stage II patients with poor RFS, survival analysis was conducted in two IHC Validation set. Kaplan-Meier analysis showed that patients with KRT17-positive tumors had significantly shorter RFS after surgery, compared to those of KRT17-negative. We identified and validated the expression of KRT17 transcript or KRT17 protein as a prognostic biomarker for RFS with high reproducibility. Our study suggests that KRT17 IHC provides additional prognostic stratification beyond the currently-available high-risk factors, highlighting the potential of its performance in precision management for stage II patients in the clinical setting.
Introduction
The number of deaths caused by colorectal cancer (CRC) ranked second in all cancers in 2015 worldwide [1, 2]. CRC is a highly heterogeneous disease associated with complex molecular mechanisms, thus clinicopathologically similar patients can strikingly differ in survival outcomes. The mainstay of treatment for patients with stage I-III (locoregional) disease is surgical resection [3]. Stage I CRC patients have good prognosis treated by surgery alone. It is recommended that all stage III patients receive adjuvant chemotherapy after surgery, as large randomized trials revealed that adjuvant treatment significantly improves survival in these patients [3-5]. However, the role of adjuvant treatment for stage II CRC remains inconclusive, despite numerous clinical trials and meta-analyses [3, 6-9]. Given the clear benefits of adjuvant treatment seen in stage III patients, recent efforts have
been focused on discriminating stage II patients with poor prognosis who might benefit from adjuvant chemotherapy or intensive postoperative management, since approximately 15% of stage II patients develop recurrence even after curative surgery [4].
Expert groups, including the American Society of Clinical Oncology (ASCO) [10], the National Comprehensive Cancer Network (NCCN) [11], the European Society of Medical Oncology (ESMO) [12], and the Japanese Society for Cancer of the Colon and Rectum (JSCCR) [13], published separate guidelines for adjuvant treatment of stage II CRC with considerable variations. Despite the lack of direct evidence from randomized trials to support the benefit for adjuvant therapy in those patients [6], guidelines recommend consideration of adjuvant chemotherapy for stage II patients with high-risk clinicopathologic features, including T4 tumors, poorly differentiated histology, lymphatic/vascular/perineural invasion, obstruction/perforation, inadequately sampled lymph nodes, although the definition of "high-risk" is not standardized [6]. NCCN guidelines further stratified stage II patients based on microsatellite instability (MSI)/mismatch repair (MMR) status, in which MSI- high/deficient MMR patients do not require adjuvant treatment [11]. However, a study of approximately 25,000 patients with stage II disease in the Surveillance, Epidemiology, and End Results (SEER) database revealed that high-risk clinicopathologic features alone are insufficient for treatment decision [14]. Therefore, there is a clear clinical need for prognostic assays to facilitate the selection of stage II patients for additional treatment.
To address this question, many studies have exploited gene expression profiling for stratifying CRC patients to provide an accurate and personalized assessment of the risk of relapse, and multi-gene assays have been developed based on dozens or hundreds of genes [6]. Many assays have been shown to be promising, however, they are often difficult to translate into routine diagnostic tests, possibly because of low technical reproducibility, the requirement of fresh-frozen tissues, or the lack of validation in large, prospective trials [15-21]. Moreover, many of them were not specifically designed to target stage II disease [18, 20]. As a result, none of the previously reported prognostic gene signatures have been adopted in clinical practice.
From these points of view, we consider that molecular biomarkers are needed to be developed with clear focus on the intended clinical populations, to have high reproducibility across multiple cohorts, and to be easily applicable in clinical practice by simple methods. Therefore, this study aimed to develop clinically useful biomarkers that can identify a subset of stage II patients with high risk of relapse after surgery. Using a total of 997 patients with stage II CRC obtained from 9 independent cohorts, we conducted a step-wise strategy with high-throughput technology-based screening and validation, followed by immunohistochemistry (IHC) using formalin-fixed paraffin- embedded (FFPE) tissue samples, resulting in the identification of KRT17 protein (keratin 17, cytokeratin 17, CK17, K17) expression as a robust prognostic biomarker for postoperative recurrence in stage II CRC.
Materials and Methods High-throughput data analysis
All microarray data are publicly available from the Gene Expression Omnibus (GEO) database (http://www.ncbi.nlm.nih.gov/geo), and the normalized expression values were obtained from each dataset and were not processed further. This study utilized multiple microarray datasets of stage II CRC tumor samples determined on Affymetrix HG-U133 Plus 2.0 platform. We initially collected 4 datasets of stage II CRC, including GSE17536 (n=55), GSE39582 (n=260), GSE26906 (n=90) and GSE18088 (n=53), as Microarray Discovery set for genome-wide screening of genes that were differentially expressed between tumors with postoperative recurrence and those without recurrence. Those 4 datasets contained relapse information, and the former two datasets also had RFS data. To confirm the survival impact of genes found in the discovery steps, an independent stage II CRC dataset (GSE33113) with Relapse-free-survival (RFS) data was employed as Microarray Validation set 1 (n=89). We further utilized two additional datasets of stage II CRC, including GSE37892 (n=73) and GSE31595 (n=20). Because of their relatively small sample size, those two datasets were combined to increase the statistical power, designated as Microarray Validation set 2 (n=93).
For TCGA data analysis, level 3 Illumina RNA-seq data for both colon and rectal adenocarcinoma (COADREAD) with clinicopathological and RFS data were downloaded through cBioPortal (http://www.cbioportal.org/) [22, 23]. MSI status were further obtained as described previously [24]. We found two different versions of RNA-seq data normalized either by RPKM or RSEM methods, namely, RNA-Seq V1 and RNA-Seq V2, containing 60 and 123 stage II patients, respectively, after removing 3 redundant samples from the former dataset. Those two datasets were combined and designated as RNA-seq validation set (n=183).
For Kaplan-Meier survival analyses, stage II patients in each dataset were dichotomized into clearly-defined high and low groups on the basis of the median expression value for each genes within each datasets. We also used transcriptomic profiles of human cancer cell lines, including Affymetrix dataset GSE36133 from The Cancer Cell Line Encyclopedia (CCLE) and Illumina microarray dataset GSE59857 for 151 CRC cell lines.
Patient samples
We have previously described a large set of FFPE tissue samples obtained from 368 consecutive patients with stage 0-IV primary CRC treated in Fukushima Medical University (FMU) Hospital [24]. Among them, we used 110 tissues with available FFPE sections from stage II patients, who underwent curative resection (R0) between 2000 and 2009 without preoperative chemotherapy
or radiotherapy, designated as IHC validation set 1. For additional validation, we further enrolled 141 consecutive patients with stage I-IV CRC, who underwent surgery between 2010 and 2013, and then 44 stage II patients were utilized as IHC validation set 2. All tumors were classified according to the TNM classification of malignant tumors [25]. Clinical and pathological information, as well as high- risk characteristics for stage II disease were retrospectively obtained by review of medical records, with the last follow-up in December 2017. The primary endpoint of interest was RFS, which was defined as time from the date of surgery to the date of first relapse. The study was conducted in accordance with the Declaration of Helsinki and was approved by the Institutional Review Board of Fukushima Medical University.
Immunohistochemistry (IHC)
Suitable antibodies were identified using the Human Protein Atlas database, in which antibody-based comprehensive proteomic data are available (www.proteinatlas.org) [24, 26]. Primary mouse monoclonal anti-KRT17 antibody (M7046, Cytokeratin17 [E3], Dako, Glostrup, Denmark) was used for KRT17 staining. Four-μm thick sections were deparaffinized in xylene and rehydrated in a graded ethanol series. Endogenous peroxidases were blocked with 0.3% hydrogen peroxide in methanol. Antigens were retrieved by autoclave for 5 min in 10 mM citrate buffer solution (105°C, pH 6.0). Primary anti-KRT17 antibody was incubated in a 1:40 dilution of 10mM phosphate-buffered saline containing Tween 20 (Sigma–Aldrich) at 4°C overnight, and subsequently detected by a horseradish peroxidase (HRP)-coupled anti-mouse polymer (Envision+System-HRP, Dako, CA, USA) followed by incubation with diaminobenzidine (Dako). All sections were counterstained with Carrazzi’s hematoxylin. Normal mammary gland specimens were used as positive controls for KRT17 staining. We defined positive when at least a few tumor cells or tumor cell clusters was stained in a tumor specimen. Sections were evaluated independently by two investigators who had no prior knowledge of the clinical data.
Determination of mismatch repair (MMR) status
IHC for MMR proteins, including MLH1, MSH2, MSH6, and PMS2 was performed using Dako EnVision+ System with mouse or rabbit monoclonal antibodies against MLH1 (clone ES05, 1:50; Dako), MSH2 (clone FE11, 1:50; Dako), MSH6 (clone EP49, 1:200; Dako) and PMS2 (clone EP51, 1:50; Dako), as described previously [24]. Loss of MMR protein was defined as the absence of nuclear staining of tumor cells in the presence of positive nuclear staining in internal controls. Loss of at least one MMR protein was designated as deficient MMR (dMMR), and tumors with intact MMR protein expression as proficient MMR (pMMR).
Cell culture, siRNA transfection, quantitative reverse-transcription (qRT)-PCR and western
blot
Authenticated human CRC cell lines, including SW480, SW620, RKO, WiDr, SW837, LoVo, HCT116, SNU503, SNU81, and SNU407 were purchased from American Type Culture Collection (ATCC, Manassas, VA, USA), JCRB Cell Bank (Osaka, Japan), Korean Cell Line Bank (Seoul, Korea) or RIKEN Cell bank (Ibaraki, Japan). A human gastric cancer cell line, NCI-N87 was obtained from ATCC. LS180 was obtained as previously described and authenticated by STR analysis [24]. RKO, WiDr and LS180 cells were maintained with DMEM (ThermoFisher Scientific); others with RPMI-1640 (ThermoFisher Scientific) containing 10% fetal bovine serum (FBS) and penicillin/streptomycin (100 IU/ml) (ThermoFisher Scientific) at 37℃ in a humidified atmosphere of 5% CO2. For knockdown of KRT17, cells were plated and transfected with siRNA oligonucleotides for KRT17 or scramble control (Ambion® Silencer Select; s7992, s7993 and negative control #1) using Lipofectamine RNAiMAX Reagent (ThermoFisher Scientific), as described previously [24].
Total RNA extraction, reverse transcription and quantitative PCR were carried out as previously described [24, 27], with TaqMan assays, including KRT17 (Assay ID Hs00356958_m1) and ACTB (Hs99999903_m1) (ThermoFisher Scientific). Western blotting was performed as previously described [24]. Briefly, protein lysate was separated by 4-20% Tris-Glycine gel (ThermoFisher Scientific) and transferred onto PVDF membrane. Primary antibodies used were mouse monoclonal anti-KRT17 (M7046, Cytokeratin17 [E3], 1:600), mouse monoclonal anti-vinculin (7F9) (#SC-73614, 1:1000; Santa Cruz Biotechnology) or mouse monoclonal anti-β-actin (#SC-69879, 1:2000, Santa Cruz Biotechnology).
Statistical analysis
Student’s t-test, Mann–Whitney U test and Fisher’s exact test were used to determine differences in clinicopathological variables between two groups. Pearson’s correlation was used to evaluate the correlations between expression levels of two groups. Cumulative survival was estimated by the Kaplan–Meier method, and differences between two groups were analyzed by the log-rank test.
Univariate and multivariate models were computed using Cox proportional hazards regression. All statistical analyses were two-sided and were conducted using Graphpad Prism v7.0 (Graphpad Software, Inc., La Jolla, CA, USA) or SPSS Statistics version 24 (IBM Corporation, NY, USA). P- values less than 0.05 were considered statistically significant.
Results
Genome-wide screening identified 6 differentially expressed genes associated with recurrence that were common in 4 cohorts of stage II CRC
The workflow of this study is illustrated in Figure 1A. We initially analyzed four
independent Affymetrix microarray cohorts of stage II patients as discovery datasets (Table 1), including GSE17536 (n=55), GSE39582 (n=260), GSE26906 (n=90) and GSE18088 (n=53). Each of these cohorts were observed more than five years. This allowed us to comprehensively search for relapse-related genes that were significantly differentially expressed between patients experienced recurrence after surgery and those who remained disease free (P<0.05). Seven probes, which corresponded to six genes, were found, as listed in Table 2 and showed in Figure1B. This indicated that in all four cohorts of stage II CRC in the discovery dataset, the expression of KRT17, HCFC1R1, CERCAM, PACS1 and HTRA1 was increased and the expression of ORC5 was decreased significantly in patients with postoperative recurrence, compared to those without recurrence.
Four genes were associated with RFS in the discovery set
To evaluate the prognostic impact of the 6 candidate genes on RFS, the former two datasets, including GSE17536 and GSE39582 in the discovery set were combined (n=315) because of their availability of RFS information. Kaplan-Meier survival analyses were conducted, in which patients were dichotomized into high or low groups based on the median expression of each genes. As demonstrated in Figure 2A-D, high levels of KRT17, HCFC1R1, CERCAM and low levels of ORC5 expression were each significantly associated with poor RFS (P<0.05). However, PACS1 or HTRA1 expression did not show statistically significant impact on RFS at least in this cohort (Figure 2E-F), thus these two genes were excluded from further analyses.
KRT17 expression was associated with RFS in a microarray validation cohort
Given that the 4 genes were chosen in the discovery set, we next sought to evaluate the reproducibility of their prognostic performance in an additional independent microarray cohort of stage II CRC. Same as above, Kaplan-Meier survival analyses were conducted, in which patients were dichotomized into high or low groups based on the median expression of each genes. As shown in Figure 3A, KRT17 was found to be the only gene whose expression was significantly associated RFS in Microarray Validation set 1 (P=0.0087, GSE33113, n=89). Although high expression of HCFC1R1 and CERCAM demonstrated a clear trend towards poor RFS (Figure 3B-C), at least partly confirming their predictive power of RFS, they did not reach statistical significance. Whereas, ORC5 expression had no survival impact in this cohort (Figure 3D). Those analyses finally led to the identification of KRT17 expression as a promising candidate for prognostic biomarker in stage II CRC.
Prognostic values of KRT17 expression was validated in an additional validation cohort
To further validate the robustness of our findings, we tested whether the prognostic value of KRT17 expression in stage II CRC could be reproduced in additional independent cohorts. We used Microarray Validation set 2 (n=93) and RNA-seq validation set (n=183) obtained from TCGA,
demonstrating a significant association between high expression of KRT17 and worse RFS in both cohorts (P=0.0158 and P=0.0227, respectively, Figure 4A-B). Furthermore, as shown in Table 3, univariate and multivariate Cox analyses revealed that high expression KRT17 mRNA was significantly associated poor RFS, independent of other clinical factors in all 4 transcriptomic cohorts we analyzed, including Microarray Discovery set (hazard ratio [HR] 2.31; 95% confidence interval [CI] 1.38–3.89; P = 0.002), Microarray Validation set 1 (HR 3.99; 95%CI 1.29-12.28; P=0.016), Microarray Validation set 2 (HR 6.19; 95%CI 1.29-29.83; P=0.023), and RNA-seq Validation set (HR 2.51; 95%CI 1.09-5.78; P=0.030).
The expression of KRT17 in protein levels
We next sought to evaluate the expression of KRT17 protein levels. Primary mouse monoclonal anti-KRT17 antibody was identified using the Human Protein Atlas database [26]. We initially analyzed two microarray datasets of human cancer cell lines on different platforms (GSE36133 and GSE59857), consistently demonstrating multiple cell lines with various levels of KRT17 mRNA expression (Figure 5A). Subsequently, KRT17 mRNA and KRT17 protein expression levels in a panel of CRC cell lines were detected by qRT-PCR and western blot, respectively (Figure 5B). We also used a gastric cancer cell line, NCI-N87, as it was reported to express high levels of KRT17 [28]. We found significant and strong correlation between mRNA and protein expression (r2=0.9041, P<0.0001, Figure 5C). Knock-down of KRT17 in CRC cells analyzed with western blot also supported the specificity of this antibody (Figure 5D). KRT17 protein expression was lower in both of two si-RNA transfection cancer cells.
To evaluate KRT17 protein expression on FFPE specimens by IHC, normal mammary gland tissues were used as a positive control, since it is known that KRT17 is expressed in breast ductal myoepithelial cells (Figure 6A) [29, 30]. We then evaluated the expression of KRT17 using IHC in 110 FFPE tumor samples (designated as IHC Validation set 1) obtained from stage II patients who underwent curative surgery between 2000 and 2009 in our hospital. Representative images are shown in Figure 6B-D. The cytoplasmic expression of KRT17 protein was found in cancer cells and cancer cell clusters, partly or sparsely in the tissue. Of 110 tumors, 19 (17.2%) were determined positive for KRT17 expression.
Prognostic values of KRT17 protein expression in multiple cohorts
To investigate whether the expression of KRT17 in protein levels could also identify stage II patients with poor RFS, survival analysis was conducted in IHC Validation set 1. Kaplan-Meier analysis showed that patients with KRT17-positive tumors had significantly shorter RFS after surgery, compared to those of KRT17-negative (P=0.0294, Figure 7A), which is highly consistent with the prognostic significance of KRT17 expression in mRNA levels. To further validate KRT17 staining as
a prognostic tool, an additional independent set of FFPE tissues were newly obtained from 44 stage II patients who underwent surgical resection between 2010 and 2013 (designated as IHC Validation set 2). As demonstrated in Figure 7B, KRT17-positive tumors were significantly associated with worse RFS than those of KRT17-negative in IHC Validation set 2 (P=0.0006).
KRT17 as an independent prognostic factor in stage II CRC
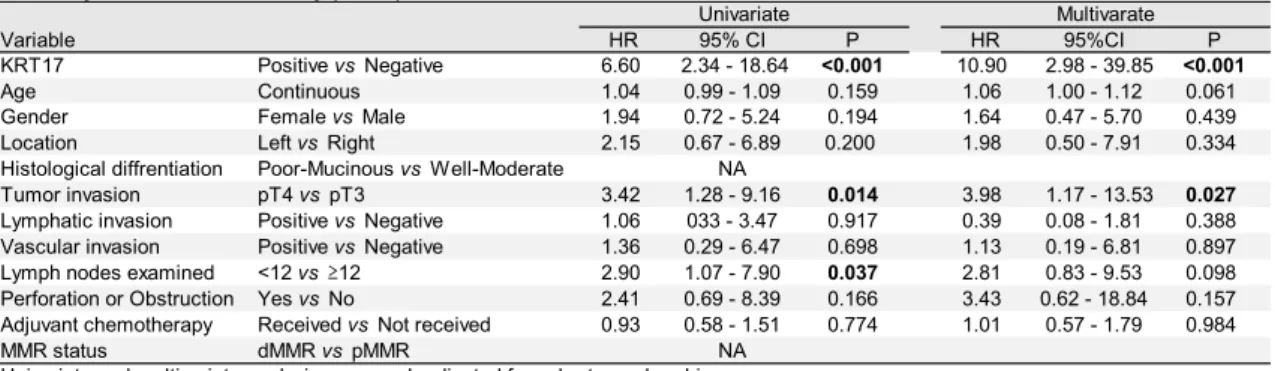
For Cox regression analyses, IHC Validation set 1 and 2 were combined to increase the statistical power. In this combined IHC cohort, no significant association was found between KRT17 expression and clinicopathological parameters, including age, gender, tumor location, histological differentiation, MMR status, or high-risk features (Table 4). Univariate Cox analysis showed that the expression of KRT17 protein significantly associated with RFS (HR 6.61; 95%CI 2.34-18.643;
P<0.001). Moreover, the prognostic significance of high KRT17 protein expression on RFS was independent of conventional clinical factors and known high-risk stage II features by multivariate analysis (HR 10.01; 95%CI 2.74-36.56; P<0.001) (Table 5).
Discussion
In this study, we extensively collected 9 independent cohorts of stage II CRC consisting of 977 patients who underwent surgery. Since our aim was to develop prognostic biomarkers that can stratify stage II patients who are at high risk of relapse, all analysis in this study only used tumor samples from stage II patients. The strength of this study is that it is based on the analysis of large number of samples and cohorts from homogenous patient population, providing highly consistent results across multiple platforms, where the reproducibility of our findings was clearly demonstrated in the intended clinical context. Although genome-wide approaches might yield numerous false discoveries, our step-wise strategy of integrating currently available gene expression data based on microarray and RNA-seq from many laboratories in various countries successfully minimized the frequency of such false positive results.
Rather than attempt to generate new multigene prognostic signatures, this study focused particularly on the identification of single genes whose expression levels are predictive of disease recurrence, with robust reproducibility across multiple independent cohorts. Indeed, in all 7 datasets we analyzed, KRT17 mRNA expression was positively associated with postoperative recurrence. The identification and validation of the prognostic impact of KRT17 transcript was recapitulated by further validation at protein levels using two independent FFPE series with well-characterized information on high-risk stage II features. We consider that the use of FFPE tissues could extend the clinical utility of prognostic tools, as archived FFPE tumor specimens remain the most available and convenient tissue source for biomarker studies and for practical purpose. Indeed, IHC for KRT17 protein is simple that
relies on only a single molecule and can be analyzed on readily-available FFPE tissues. In view of that, KRT17 IHC may have potential to be used as a prognostic biomarker for the management of stage II CRC after surgery in the current clinical setting. KRT17 staining demonstrated significant prognostic impact on poor RFS, independent of previously-known clinicopathological features of high-risk stage II disease. Those findings suggest that KRT17 can add additional discriminative value to identify stage II patients at high risk for relapse, beyond conventional clinicopathological characteristics. Therefore, for patients with positive KRT17 expression, intensive postoperative intervention, including adjuvant chemotherapy with more appropriate postoperative surveillance, may be considered. Since combination of multiple biomarkers can provide more accurate risk stratification than single markers, KRT17 IHC combined with other genetic, epigenetic and clinicopathological modalities would further contribute to precision management for patients with stage II CRC after surgery.
Keratins belong to the superfamily of intermediate filament proteins primarily expressed in epithelial cells, which are encoded by 54 distinct keratin (KRT) genes [31]. The expression of keratins is tightly regulated in a tissue-specific and context-dependent manner, contributing to the maintenance of cellular integrity. Keratins typically retain their epithelial cell type-specific expression during tumorigenesis, and de novo expression also occurs in some types of tumor. Therefore, immunohistochemical detection of keratins has been widely established in clinical cancer pathology, particularly, with the routine use of keratin 7 (CK7) and keratin 20 (CK20) IHC for determining the tissue of origin in cancer of unknown primary [29, 31]. In breast cancer, keratin 19 (CK19) mRNA expression is currently used in identifying tumor cells within sentinel lymph nodes [31].
KRT17 (keratin 17, CK17, K17) is known to be expressed in basal and myoepithelial cells of various glands, including mammary gland, respiratory epithelium, and urothelium [29, 30].
Although KRT17 is not expressed in healthy skin, it is rapidly inducible in skin epithelial cells under stressful condition, such as skin injury, resulting in cell growth [32] and inflammatory reaction [33].
KRT17 leads positive regulation of epithelial cell size and growth by binding to the adaptor protein 14-3-3σ by stimulating Akt/mTOR pathway at the wound. In tumor tissue, likewise, several previous studies reported KRT17 affect the function of protein synthesis and cell growth and is considered to be great importance of cell viability and function through the same way[32]. KRT17 expression is also found in tumor cells, and a number of studies have consistently demonstrated that KRT17 accelerates oncogenic transformation and tumor progression in vitro and in vivo in many types of cancer [28, 33-39]. In gastric cancer, knockdown of KRT17 by RNA interference was able to significantly suppress cell proliferation, migration and invasion in vitro[28]. In addition, silencing of KRT17 induces apoptosis and cell-cycle arrest at G1/S phase of gastric cancer cell. They say that is why high KRT17 expression leads poor prognosis. Moreover, in cervical cancer, KRT17 has been identified and used as a marker of cancer
stem cells [40-42]. It is worth noting that the expression of KRT17 is associated with adverse prognosis in several cancer types, including cervical cancer [34, 43], gastric cancer [38, 44], and breast cancer [45-47]. Collectively, all of those studies clearly implicate the oncogenic function of KRT17 in human cancer, correlated with poor prognostic phenotypes. Although the present study did not address the functional role of KRT17, it is therefore conceivable that KRT17 also plays a tumor-promoting role in CRC.
Our study had several limitations, including its exploratory and retrospective nature. One limitation for the analysis of public cohorts is that there was incomplete or unavailable information on high-risk clinicopathological features for stage II patients. Thus, we were not able to include those covariates in the models. In addition, the predictive value of KRT17 expression for the response to adjuvant treatment remains largely unknown, despite its robust prognostic significance on RFS. This is mostly due to the lack of information on the administration of adjuvant chemotherapy in the majority of the transcriptomic cohorts used in this study. Since stage II patients are usually treated by surgery alone in the current practice, we were not able to directly address the predictive role of KRT17 IHC, owing to relatively small number of patients who received postoperative chemotherapy even in our FFPE cohorts.
In conclusion, with the use of 9 independent cohorts consisting of nearly 1000 patients with stage II CRC who underwent surgery, we extensively conducted a genome-wide screening of single genes, combined with step-wise validation strategies based on multiple platforms. We identified and validated the expression of KRT17 transcript or KRT17 protein as a prognostic biomarker for RFS with high reproducibility. To our knowledge, this is the first study reporting the prognostic role of KRT17 expression in CRC, especially in postoperative stage II patients who are at high probability of disease recurrence. Our study suggests that KRT17 IHC provides additional prognostic stratification beyond the currently-available high-risk factors, highlighting the potential of its performance in precision management for stage II patients in the clinical setting.
Reference
1. Fitzmaurice C, Allen C, Barber RM et al. Global, Regional, and National Cancer Incidence, Mortality, Years of Life Lost, Years Lived With Disability, and Disability-Adjusted Life- years for 32 Cancer Groups, 1990 to 2015: A Systematic Analysis for the Global Burden of Disease Study. JAMA Oncol 2017; 3: 524-548.
2. Ferlay J, Soerjomataram I, Dikshit R et al. Cancer incidence and mortality worldwide:
sources, methods and major patterns in GLOBOCAN 2012. Int J Cancer 2015; 136: E359-386.
3. Brenner H, Kloor M, Pox CP. Colorectal cancer. Lancet 2014; 383: 1490-1502.
4. André T, Boni C, Navarro M et al. Improved overall survival with oxaliplatin, fluorouracil, and leucovorin as adjuvant treatment in stage II or III colon cancer in the MOSAIC trial. J Clin
Oncol 2009; 27: 3109-3116.
5. André T, Boni C, Mounedji-Boudiaf L et al. Oxaliplatin, fluorouracil, and leucovorin as adjuvant treatment for colon cancer. N Engl J Med 2004; 350: 2343-2351.
6. Dienstmann R, Salazar R, Tabernero J. Personalizing colon cancer adjuvant therapy:
selecting optimal treatments for individual patients. J Clin Oncol 2015; 33: 1787-1796.
7. Gray R, Barnwell J, McConkey C et al. Adjuvant chemotherapy versus observation in patients with colorectal cancer: a randomised study. Lancet 2007; 370: 2020-2029.
8. Gill S, Loprinzi CL, Sargent DJ et al. Pooled analysis of fluorouracil-based adjuvant therapy for stage II and III colon cancer: who benefits and by how much? J Clin Oncol 2004; 22:
1797-1806.
9. Figueredo A, Charette ML, Maroun J et al. Adjuvant therapy for stage II colon cancer: a systematic review from the Cancer Care Ontario Program in evidence-based care's gastrointestinal cancer disease site group. J Clin Oncol 2004; 22: 3395-3407.
10. Benson AB, 3rd, Schrag D, Somerfield MR et al. American Society of Clinical Oncology recommendations on adjuvant chemotherapy for stage II colon cancer. J Clin Oncol 2004; 22:
3408-3419.
11. Network. NCC. NCCN clinical practice guidelines in oncology Colon cancer, Rectal cancer. In. http://www.nccn.org/ professionals/physician_gls/PDF/colon.pdf.
12. Schmoll HJ, Van Cutsem E, Stein A et al. ESMO Consensus Guidelines for management of patients with colon and rectal cancer. a personalized approach to clinical decision making. Ann Oncol 2012; 23: 2479-2516.
13. Watanabe T, Muro K, Ajioka Y et al. Japanese Society for Cancer of the Colon and Rectum (JSCCR) guidelines 2016 for the treatment of colorectal cancer. Int J Clin Oncol 2018;
23: 1-34.
14. O'Connor ES, Greenblatt DY, LoConte NK et al. Adjuvant chemotherapy for stage II colon cancer with poor prognostic features. J Clin Oncol 2011; 29: 3381-3388.
15. Park YY, Lee SS, Lim JY et al. Comparison of prognostic genomic predictors in colorectal cancer. PLoS One 2013; 8: e60778.
16. Sanz-Pamplona R, Berenguer A, Cordero D et al. Clinical value of prognosis gene expression signatures in colorectal cancer: a systematic review. PLoS One 2012; 7: e48877.
17. Gröne J, Lenze D, Jurinovic V et al. Molecular profiles and clinical outcome of stage UICC II colon cancer patients. Int J Colorectal Dis 2011; 26: 847-858.
18. Dalerba P, Sahoo D, Paik S et al. CDX2 as a Prognostic Biomarker in Stage II and Stage III Colon Cancer. N Engl J Med 2016; 374: 211-222.
19. Kopetz S, Tabernero J, Rosenberg R et al. Genomic classifier ColoPrint predicts recurrence in stage II colorectal cancer patients more accurately than clinical factors. Oncologist
2015; 20: 127-133.
20. Salazar R, Roepman P, Capella G et al. Gene expression signature to improve prognosis prediction of stage II and III colorectal cancer. J Clin Oncol 2011; 29: 17-24.
21. Di Narzo AF, Tejpar S, Rossi S et al. Test of four colon cancer risk-scores in formalin fixed paraffin embedded microarray gene expression data. J Natl Cancer Inst 2014; 106.
22. Gao J, Aksoy BA, Dogrusoz U et al. Integrative analysis of complex cancer genomics and clinical profiles using the cBioPortal. Sci Signal 2013; 6: pl1.
23. Network TCGA. Comprehensive molecular characterization of human colon and rectal cancer. Nature 2012; 487: 330-337.
24. Noda M, Okayama H, Tachibana K et al. Glycosyltransferase gene expression identifies a poor prognostic colorectal cancer subtype associated with mismatch repair deficiency and incomplete glycan synthesis. Clin Cancer Res 2018.
25. Sobin LH, Gospodarowicz MK, Wittekind C, International Union against Cancer. TNM classification of malignant tumours. Chichester, West Sussex, UK ; Hoboken, NJ: Wiley- Blackwell,2010.
26. Uhlen M, Zhang C, Lee S et al. A pathology atlas of the human cancer transcriptome.
Science 2017; 357.
27. Thar Min AK, Okayama H, Saito M et al. Epithelial-mesenchymal transition-converted tumor cells can induce T-cell apoptosis through upregulation of programmed death ligand 1 expression in esophageal squamous cell carcinoma. Cancer Med 2018.
28. Chivu-Economescu M, Dragu DL, Necula LG et al. Knockdown of KRT17 by siRNA induces antitumoral effects on gastric cancer cells. Gastric Cancer 2017.
29. Moll R, Divo M, Langbein L. The human keratins: biology and pathology. Histochem Cell Biol 2008; 129: 705-733.
30. Troyanovsky SM, Guelstein VI, Tchipysheva TA et al. Patterns of expression of keratin 17 in human epithelia: dependency on cell position. J Cell Sci 1989; 93 ( Pt 3): 419-426.
31. Toivola DM, Boor P, Alam C, Strnad P. Keratins in health and disease. Curr Opin Cell Biol 2015; 32: 73-81.
32. Kim S, Wong P, Coulombe PA. A keratin cytoskeletal protein regulates protein synthesis and epithelial cell growth. Nature 2006; 441: 362-365.
33. Depianto D, Kerns ML, Dlugosz AA, Coulombe PA. Keratin 17 promotes epithelial proliferation and tumor growth by polarizing the immune response in skin. Nat Genet 2010; 42:
910-914.
34. Escobar-Hoyos LF, Shah R, Roa-Pena L et al. Keratin-17 Promotes p27KIP1 Nuclear Export and Degradation and Offers Potential Prognostic Utility. Cancer Res 2015; 75: 3650-3662.
35. Hobbs RP, Batazzi AS, Han MC, Coulombe PA. Loss of Keratin 17 induces tissue-
specific cytokine polarization and cellular differentiation in HPV16-driven cervical tumorigenesis in vivo. Oncogene 2016; 35: 5653-5662.
36. Sankar S, Tanner JM, Bell R et al. A novel role for keratin 17 in coordinating oncogenic transformation and cellular adhesion in Ewing sarcoma. Mol Cell Biol 2013; 33: 4448-4460.
37. Khanom R, Nguyen CT, Kayamori K et al. Keratin 17 Is Induced in Oral Cancer and Facilitates Tumor Growth. PLoS One 2016; 11: e0161163.
38. Hu H, Xu DH, Huang XX et al. Keratin17 Promotes Tumor Growth and is Associated with Poor Prognosis in Gastric Cancer. J Cancer 2018; 9: 346-357.
39. Hobbs RP, DePianto DJ, Jacob JT et al. Keratin-dependent regulation of Aire and gene expression in skin tumor keratinocytes. Nat Genet 2015; 47: 933-938.
40. Wu L, Han L, Zhou C et al. TGF-beta1-induced CK17 enhances cancer stem cell-like properties rather than EMT in promoting cervical cancer metastasis via the ERK1/2-MZF1 signaling pathway. FEBS J 2017; 284: 3000-3017.
41. Ortiz-Sanchez E, Santiago-Lopez L, Cruz-Dominguez VB et al. Characterization of cervical cancer stem cell-like cells: phenotyping, stemness, and human papilloma virus co-receptor expression. Oncotarget 2016; 7: 31943-31954.
42. Feng D, Peng C, Li C et al. Identification and characterization of cancer stem-like cells from primary carcinoma of the cervix uteri. Oncol Rep 2009; 22: 1129-1134.
43. Escobar-Hoyos LF, Yang J, Zhu J et al. Keratin 17 in premalignant and malignant squamous lesions of the cervix: proteomic discovery and immunohistochemical validation as a diagnostic and prognostic biomarker. Mod Pathol 2014; 27: 621-630.
44. Ide M, Kato T, Ogata K et al. Keratin 17 expression correlates with tumor progression and poor prognosis in gastric adenocarcinoma. Ann Surg Oncol 2012; 19: 3506-3514.
45. van de Rijn M, Perou CM, Tibshirani R et al. Expression of cytokeratins 17 and 5 identifies a group of breast carcinomas with poor clinical outcome. Am J Pathol 2002; 161: 1991- 1996.
46. Merkin RD, Vanner EA, Romeiser JL et al. Keratin 17 is overexpressed and predicts poor survival in estrogen receptor-negative/human epidermal growth factor receptor-2-negative breast cancer. Hum Pathol 2017; 62: 23-32.
47. Thike AA, Iqbal J, Cheok PY et al. Triple negative breast cancer: outcome correlation with immunohistochemical detection of basal markers. Am J Surg Pathol 2010; 34: 956-964.
Figure Legends
Figure 1. (A)Workflow for the stepwise identification and validation of prognostic genes in patients with stage II colorectal cancer. (Step 1) Genome-wide screening for genes
differentially expressed between patients experienced recurrence and those who remained disease free using four microarray cohorts, followed by confirmation in relapse-free survival (RFS) analysis for candidate genes. (Step 2) Validation of candidate genes by RFS analysis in three independent microarray and RNA-seq cohorts. (Step 3) Validation of candidate genes at protein levels by RFS analysis in two independent immunohistochemistry cohorts. (B) Venn diagram of 4 cohorts in step 1. Many probes were detected in each cohort and only seven probes were commonly identified in all 4 cohorts.
Figure 2. Kaplan-Meier curves depicting relapse-free survival for patients with stage II colorectal cancer in the microarray discovery cohorts (n=315). Patients were dichotomized as high or low based on the median expression of candidate genes, including KRT17 (A), HCFC1R1 (B), CERCAM (C), ORC5 (D), PACS1 (E), and HTRA1 (F).
Figure 3. Kaplan-Meier curves showing relapse-free survival for patients with stage II colorectal cancer in Microarray validation set 1 (n=89). Patients were dichotomized as high or low based on the median expression of candidate genes, including KRT17 (A), HCFC1R1 (B), CERCAM (C), and ORC5 (D).
Figure 4. Kaplan-Meier curves showing relapse-free survival for KRT17 expression in additional independent cohorts of stage II colorectal cancer, including Microarray validation set 2 (n=93) (A) and RNA-seq validation set (n=183) (B). In each cohort, patients were dichotomized based on the median expression of KRT17.
Figure 5. KRT17 mRNA and KRT17 protein expression in human cancer cell lines. (A) Two microarray datasets of cell lines derived from different types of cancer (GSE36133, left panel) and from colorectal cancer (GSE59857, right panel), showing various expression levels of KRT17 transcript. (B) Western blotting (upper panel) and qRT-PCR (lower panel) analysis for KRT17 protein and mRNA levels, respectively, in a gastric cancer cell line NCI-N87, and a panel of 11 colorectal cancer cell lines. (C) Correlation between the expression of KRT17 mRNA by qRT-PCR and KRT17 protein by western blotting in cancer cell lines. (D) Knock- down of KRT17 in two colorectal cancer cell lines, confirmed by western blotting.
Figure 6. Immunohistochemistry for KRT17 protein expression. (A) KRT17 expressed by breast ductal myoepithelial cells in normal mammary gland. (B) Non-tumor colon mucosa showing negative for KRT17 staining. (C,D) Colorectal cancer tissues showing positive- KRT17 expression in the cytoplasm of cancer cells (C) and negative-KRT17 expression (D).
Figure 7. Kaplan-Meier curves displaying relapse-free survival for KRT17 protein expression by immunohistochemistry in two independent cohorts of stage II colorectal cancer, including IHC validation set 1 (n=110) (A) and IHC validation set 2 (n=44) (B).
Affymetrix Probe ID
Gene
Symbol Description
Log2 fold-
change P
Log2 fold-
change P
Log2 fold-
change P
Log2 fold-
change P
224658_x_at PACS1 phosphofurin acidic cluster sorting protein 1 0.17 0.033 0.14 0.005 0.32 0.025 0.32 0.001 45714_at HCFC1R1 host cell factor C1 regulator 1 (XPO1 dependent) 0.19 0.010 0.28 0.000 0.54 0.004 0.54 0.001 204957_at ORC5 origin recognition complex, subunit 5 -0.33 0.018 -0.17 0.017 -0.52 0.005 -0.52 0.015 218537_at HCFC1R1 host cell factor C1 regulator 1 (XPO1 dependent) 0.13 0.022 0.25 0.000 0.55 0.005 0.55 0.016 224794_s_at CERCAM cerebral endothelial cell adhesion molecule 0.44 0.008 0.28 0.003 0.72 0.016 0.72 0.023
201185_at HTRA1 HtrA serine peptidase 1 0.58 0.016 0.34 0.010 0.84 0.031 0.84 0.023
212236_x_at KRT17 keratin 17 0.93 0.004 0.32 0.032 0.88 0.017 0.88 0.032
GSE17536(n=55) GSE39582(n=260) GSE26906(n=90) GSE18088(n=53) Table 2. Differentially expressed genes between stage II patients experienced recurrence after surgery and those who remained disease free
RNA-seq validation
Total Cohort 1 Cohort 2 Cohort 3 Cohort 4 Cohort 5 Cohort 6 Cohort 7 Cohort 8 Cohort 9
(n=977) (n=55) (n=260) (n=90) (n=53) (n=89) (n=93) (n=183) (n=110) (n=44)
GSE17536 GSE39582 GSE26906 GSE18088 GSE33113 GSE37892 GSE31595
TCGA RNA-seq V1 TCGA RNA-seq V2
FMU 2000-2009
FMU 2010-2013 Age
Mean±SD 68.0±12.3 66.4±12.4 67.3±12.9 66.5±12.6 65.4±12.2 70.3±13.0 70.7±11.7 66.7±12.0 68.1±12.6 71.2±7.6 Gender
Male 535 23 153 43 26 42 48 101 65 34
Female 442 32 107 47 27 47 45 82 45 10
Location
Right-sided 338 0 99 25 28 0 44 86 39 17
Left-sided 488 0 161 65 25 0 48 91 71 27
not specified 151 55 0 0 0 89 1 6 0 0
MSI/MMR status
MSI-High or dMMR 109 0 37 0 19 0 0 36 12 5
MSS/MSI-Low or pMMR 487 0 182 0 34 0 0 134 98 39
Unknown 381 55 41 90 0 89 93 13 0 0
Adjuvant chemotherapy
Received 105 0 56 0 0 0 0 5 30 14
Not received 338 0 203 0 0 0 20 8 77 30
Unknown 534 55 1 90 53 89 73 170 3 0
IHC validation Microarray discovery
Table 1. Patient characteristics in 9 cohorts of stage II colorectal cancer
Microarray validation
Variable HR 95% CI P HR 95% CI P Microarray Discovery set (stage II, n=315)
KRT17 High vs Low 2.33 1.39-3.91 0.001 2.31 1.38-3.89 0.002
Age Continous 1.01 0.99-1.03 0.565 1.00 0.99-1.02 0.656
Gender Female vs Male 0.93 0.57-1.52 0.771 0.93 0.57-1.53 0.771 Microarray Validation set 1 (stage II, n=89)
KRT17 High vs Low 3.99 1.31 - 12.13 0.015 3.99 1.29 - 12.28 0.016
Age Continous 0.98 0.95 - 1.02 0.259 0.99 0.95 - 1.02 0.420
Gender Female vs Male 1.02 0.40 - 2.59 0.963 1.22 0.48 - 3.16 0.676 Microarray Validation set 2 (stage II, n=93)
KRT17 High vs Low 5.52 1.19 - 25.64 0.029 6.19 1.29 - 29.83 0.023
Age Continous 0.99 0.94 - 1.04 0.737 0.98 0.93- 1.03 0.459
Gender Female vs Male 0.83 0.25 - 2.72 0.753 0.64 0.18 - 2.30 0.499 Location Left vs Right 0.75 0.23 - 2.50 0.643 0.85 0.25 - 2.90 0.799 RNA-seq Validation set (stage II, n=183)
KRT17 High vs Low 2.35 1.10-5.04 0.028 2.51 1.09-5.78 0.030
Age Continous 1.69 0.72-3.97 0.233 1.03 0.99-1.07 0.130
Gender Female vs Male 0.51 0.24-1.09 0.082 0.65 0.29-1.45 0.292
Location Left vs Right 1.03 0.50-2.16 0.929 1.08 0.47-2.51 0.850 Tumor invasion T4 vs T3 2.38 0.83-6.82 0.107 2.72 0.89-8.30 0.078 MSI status MSI-H vs MSS/MSI-L 1.09 0.45-2.67 0.851 1.29 0.457-3.67 0.629 Table 3. Univariate and Multivariate Cox regression of KRT17 mRNA expression for relapse-free survival in microarray or RNA-seq cohorts of stage II colorectal cancer
Univariate Multivariate
Univariate and multivariate analysis were each adjusted for cohort membership
Positive Negative Total (n=154) n=34 n=120 P
Age(years) 0.376
Mean±SD 69 67.5±12.7 69.4±11.1
Gender 0.643
Male 99 23 76
Female 55 11 44
Location 0.839
Right 49 11 38
Left 96 23 73
0.458
Well-moderate 143 33 110
Poor-mucinous 11 1 10
Tumor invasion 0.826
pT4 43 10 33
pT3 111 24 87
Lymphatic invasion 0.472
Positive 116 28 88
Negative 33 6 27
Not available 5 0 5
Vascular invasion 0.657
Positive 128 30 98
Negative 21 4 17
Not available 5 0 5
Number of lymph nodes examined 0.682
<12 47 12 35
≧12 98 22 76
Not available 9 0 9
Obstruction or perforation 0.641
Yes 17 3 14
No 137 31 106
0.600
Received 44 9 35
Not received 107 25 82
Unknown 3 0 3
MMR status 0.365
dMMR 17 15 2
pMMR 137 32 105
KRT17 expression
Histrogical differentiation
Adjuvant chemotherapy
Table 4. Association between KRT17 protein expression and clinicopathological characteristics in stage II colorectal cancer
Variable HR 95% CI P HR 95%CI P KRT17 Positive vs Negative 6.60 2.34 - 18.64 <0.001 10.90 2.98 - 39.85 <0.001
Age Continuous 1.04 0.99 - 1.09 0.159 1.06 1.00 - 1.12 0.061
Gender Female vs Male 1.94 0.72 - 5.24 0.194 1.64 0.47 - 5.70 0.439
Location Left vs Right 2.15 0.67 - 6.89 0.200 1.98 0.50 - 7.91 0.334
Histological diffrentiation Poor-Mucinous vs Well-Moderate NA
Tumor invasion pT4 vs pT3 3.42 1.28 - 9.16 0.014 3.98 1.17 - 13.53 0.027
Lymphatic invasion Positive vs Negative 1.06 033 - 3.47 0.917 0.39 0.08 - 1.81 0.388 Vascular invasion Positive vs Negative 1.36 0.29 - 6.47 0.698 1.13 0.19 - 6.81 0.897
Lymph nodes examined <12 vs ≥12 2.90 1.07 - 7.90 0.037 2.81 0.83 - 9.53 0.098
Perforation or Obstruction Yes vs No 2.41 0.69 - 8.39 0.166 3.43 0.62 - 18.84 0.157
Adjuvant chemotherapy Received vs Not received 0.93 0.58 - 1.51 0.774 1.01 0.57 - 1.79 0.984
MMR status dMMR vs pMMR NA
Univariate Multivarate
Table 5. Univariate and multivariate Cox regression of KRT17 protein expression for relapse-free survival in stage II colorectal cancer by immunohistochemistry (n=154)
Univariate and multivariate analysis were each adjusted for cohort membership