Fukushima Medical University
福島県立医科大学 学術機関リポジトリ
This document is downloaded at: 2021-11-07T23:44:03Z
Title Estimation of frequency difference at which stream segregation precedes temporal integration as reflected by omission
mismatch negativity( 本文 ) Author(s) 疋田, 雅之
Citation
Issue Date 2020-09-30
URL http://ir.fmu.ac.jp/dspace/handle/123456789/1346
Rights Fulltext: This thesis is revised from "Biol Psychol. 2020 Mar;151:107848. doi: 10.1016/j.biopsycho.2020.107848. © 2020 Elsevier B.V."
DOI
Text Version ETD
Estimation of frequency difference at which stream segregation precedes temporal integration as reflected by omission mismatch negativity
Masayuki Hikita
Department of Neuropsychiatry, Fukushima Medical University, Hikarigaoka 1, Fukushima, Japan
E-mail: [email protected]
Abstract
Both stream segregation and temporal integration are considered important for auditory scene analysis in the brain. Several previous studies have indicated that stream
segregation may precede temporal integration when both processes are required. In the present study, we utilized mismatch negativity (MMN)—which reflects automatic change detection—to systematically estimate the threshold of the frequency difference at which stream segregation occurs prior to temporal integration when these functions occur together during a state of inattention. Electroencephalography (EEG) data were
2
recorded from 22 healthy Japanese men presented with six blocks of alternating high pure tones (high tones) and low pure tones (low tones). Only high tones were omitted with 5% probability in all blocks. Our results indicated that stream segregation should cancel temporal integration of close sounds, as indicated by omission-MMN elicitation, when the frequency difference is 1000 Hz or larger.
Abbreviations
ASA: auditory scene analysis EEG: electroencephalography EOG: electrooculography ERP: event-related potential MMN: mismatch negativity SOA: stimulus onset asynchrony TWI: Temporal window of integration
3
Introduction
Humans are exposed to an enormous amount of auditory information in natural acoustic environments. The auditory system can decompose the mixture of sounds into
separate sound sources. This process, known as auditory scene analysis (ASA), involves two key mechanisms: stream segregation and temporal integration (Bregman, 1990).
Temporal integration is a process by which acoustic signals presented within a temporal window of approximately 200 ms are integrated into a single perceptual unit (Cowan, 1984; Cowan, 1995; Pedersen & Salomon, 1977; Weber & Green, 1978). Presumably, this process relies on a temporal window of a certain duration (i.e., the temporal window of integration (TWI)) (Näätänen, 1992). The TWI can be studied using
event-related potentials (ERP) known as mismatch negativity (MMN) (Näätänen, 1992).
Discovered by Näätänen et al., auditory MMN is associated with auditory sensory memory, in which change is automatically detected even in the absence of attention (Näätänen, 1992; Näätänen, Gaillard, & Mäntysalo, 1978). Namely, MMN reflects automatic acoustic processing (Näätänen, 1992). Yabe et al. conducted MMN and magnetic MMN (MMNm) studies to investigate the duration of the TWI by omitting one tone in a sequence of repetitive tones of 50 ms in duration with different stimulus onset asynchronies (SOAs) (Yabe, Tervaniemi, Reinikainen, & Näätänen, 1997; Yabe et
4
al., 1998). In these, studies, MMN or MMNm was obtained only when the SOA was shorter than 160 ms, which suggested that the duration of the TWI should range from 150 ms to 170 ms. Furthermore, to estimate the exact duration of the TWI, Yabe et al.
conducted an additional study using a paradigm in which a click sound of 0.1 ms in duration was the standard and its omission was deviant with different SOAs (Yabe et al., 1999). Consequently, the duration of the TWI was estimated at 160 to 170 ms, as a definite MMN was elicited with constant SOAs of 160 ms or shorter, whereas no MMN was elicited with SOAs of 170 ms or longer. Stream segregation, in which a mixture of sounds is perceived as two or more separate sound sources (Bregman, 1990), can be demonstrated by the repeated alternation of high and low tones: At slow speeds, participants perceive a single sound stream. At higher speeds, they perceive two separate sound streams (Bregman, 1990; Van Noorden, unpublished doctoral dissertation).
The role of attention in the stream segregation process remains controversial.
Some evidence suggests that attention regulates perceptual decision-making during stream segregation (Carolyn, Cusack, Foxton, & Robertson, 2001; Cusack, Deeks, Aikman, & Carolyn, 2004; Snyder, Alain, & Picton, 2006). However, considerable ERP evidence suggests that auditory stream segregation can occur without attention (Ritter,
5
Sussman, & Molholm, 2000; Sussman, Ritter, & Vaughn, 1999; Sussman, 2005;
Winkler et al., 2003; Yabe et al., 2001). Sussman et al. examined whether stream segregation occurs automatically using MMN as an index of automatic acoustic processing (Sussman et al., 1999). They created a tone sequence alternating between a rising sequence of three high frequency tones and a rising sequence of three low
frequency tones. The tone sequence included deviants of three falling tones. Half of the deviants occurred in the low stream, and half occurred in the high stream. They
presented the tone sequences to participants at fast and slow paces while the participants were instructed to ignore the auditory stimuli. At the slow pace (750 ms SOA), tones were heard as alternating high and low pitches, and no MMN was evoked in response to deviants. At the fast pace (100 ms SOA), a streaming effect was induced, and MMN in response to both the high and low deviants was observed. These results suggested that stream segregation could occur automatically. Yabe et al. (2001) examined the interplay between auditory stream segregation and temporal integration using three types of sequences: repetitive sequences (3,000 Hz and 3,000 Hz), alternating sequences of two tones with a small frequency separation (3,000 Hz and 2,800 Hz), and alternating sequences of two tones with a large frequency separation (3,000 Hz and 500 Hz).
Subsequently they recorded magnetic brain responses whilst presenting these sequences
6
with an SOA of 125 ms, in which only high tones were omitted occasionally with 5%
probability. Because the duration of the SOA was 125 ms, consecutive tones in the sequence were always within the assumed TWIs, whereas in the two alternating conditions, neighboring identical tones were separated by 250 ms, which exceeds the estimated duration of the TWI. The authors speculated that, if TWI processing precedes frequency-based stream segregation, then MMN to tone omissions should be elicited irrespective of the frequency separation between two alternating tones. In contrast, if temporal integration occurs within streams, tone omission should only elicit the MMN when alternating high and low tones are grouped into a single stream, but not when stream segregation occurs, and the two tones are segregated into separate streams. As a result, sizable MMNm components were elicited by stimulus omissions in the repetitive tone sequence as well as in the alternating sequence with small frequency separation. In contrast, no significant MMNm was elicited in the alternating sequences with large frequency separation. This result suggested that stream segregation preceded temporal integration and that stream segregation is among the early auditory processes that underline the organization of auditory input. Sussman (2005) also investigated the relationship between stream segregation and temporal integration when the two processes occurred together.The author created tone sequences in which high tones
7
(frequency: 1568 Hz) and low tones (frequency: 440 Hz) were alternated with constant SOA of 75 ms. The tone sequences contained high deviants (frequency: 1760 Hz) and low deviants (frequency: 494 Hz). Furthermore, she prepared two presentations. One was a blocked presentation in which the two successive deviants (double deviants) occurred in each stream, and the other was a mixed presentation in which a single deviant and double deviants occurred in each stream. At the blocked presentation, one MMN was elicited in response to the deviants, and two MMNs were elicited at the mixed presentation. The result suggested that integration of sound elements within the sound stream occurred after the segregation of sounds into independent streams, and that stream segregation could occur prior to temporal integration.
However, no systematic studies have focused on the threshold of frequency difference at which stream segregation occurs prior to temporal integration when these functions occur simultaneously during a state of inattention. The aim of this study was to estimate this threshold from a neurophysiological perspective. To achieve this, we created six blocks of tone sequences, with each frequency set more closely than that in the previous study by Yabe et al. (2001). We recorded electroencephalography (EEG) data whilst presenting these tone sequences with an SOA of 120 ms, in which only high tones were omitted occasionally with 5% probability.
8
Participants and methods
Participants
Twenty-two healthy Japanese men (22–50 years old, mean±SD: 31.9±8.8 years) provided written informed consent to participate in this study. All participants had normal hearing and were free of any medication at the time of study. Only male participants were selected to eliminate sex bias. The study was approved by the Ethics Committee of Fukushima Medical University.
Stimuli and procedure
We created six blocks of tone sequences in which high pure tones (high tones) and low pure tones (low tones) were alternated with a constant SOA of 120 ms. In all blocks, the frequency of high tones was fixed at 3,000 Hz. The frequency of low tones was set at 3,000 Hz, 2,500 Hz, 2,000 Hz, 1,500 Hz, 1,000 Hz, and 500 Hz in blocks one through six, respectively. Only high tones were omitted with 5% probability in all blocks (Fig.
1). All stimuli had a sound pressure level of 80 dB and were 50 ms in duration (5 ms rise and fall times).
9
The participants were seated in a comfortable chair in an electrically shielded and sound-attenuated room. During the experiment, participants watched a self-selected silent video. The auditory stimuli were presented to their left ear via an earphone. They were instructed to ignore the auditory stimuli.
EEG data were obtained during presentation of the six blocks, which were separated by 1-min intervals. Each condition included 3,000 auditory trials (2850 tones and 150 stimulus omissions). The order of stimulus blocks was randomized among participants.
Data acquisition and analysis
The EEG data were recorded from 15 sintered Ag/AgCl electrodes placed in accordance with the international 10–20 system at Fp1, Fp2, F3, F4, F7, F8, C3, C4, T3, T4, T5, T6, Fz, and Cz within an electrode cap (Brain cap by EASYCAPGmbH,Herrsching,
Germany). The reference electrode was attached to the nose. The impedance of all electrodes was maintained below 10 kΩ. The vertical and horizontal electrooculogram (EOG) was recorded from an electrode placed 1.5 cm above the outer canthus of the right eye. The EEG was digitized (V-amp by Brain Products GmbH, Gilching,
Germany) at a sampling rate of 1000 Hz (bandpass 0.53–70 Hz). The EEG and the EOG
10
data were recorded with a 16-channel recorder (Vision Recorder by Brain Products GmbH) for offline analysis using Brain Vision Analyzer (Brain Products GmbH). All EEG epochs with EOGs larger than 100 μV were automatically excluded from the analysis.
MMN at Fz in the repetitive tone sequence was specified as a negative ERP component peaking at 100–200 ms after deviant onset. The mean of the peak latency of MMN at Fz in the repetitive tone sequence was calculated as 114 ms. Then, the time window for the MMN voltages was set to 114±10 ms (104–124 ms), and the mean voltages within the time window were calculated at Fz and Cz for each condition and participant.
The mean voltages for each condition at Fz and Cz were analyzed using a two-way analysis of variance (ANOVA) with repeated measures. The ANOVA included the within-subject factors block type (first block, second block, third block, fourth block, fifth block, sixth block) and event type (high tones, low tones, stimulus omissions).
When appropriate, Greenhouse–Geisser correction was performed. In addition, we compared the mean voltages in response to stimulus omissions with the mean voltages in response to high tones (omissions vs. high tones) and low tones (omissions vs. low tones) at Fz and Cz, using Dunnett’s multiple comparison test to determine whether
11
MMN had been elicited. All p-values reported were two-sided, and the significance level was set at p<0.05. Statistical tests were performed using SPSS 11.5 (SPSS Inc.
Chicago, IL).
Results
The grand average waveforms of the responses to high tones (left), low tones (center), and stimulus omissions (right) at Fz, Cz, T5, and T6 in each condition are shown in Fig.
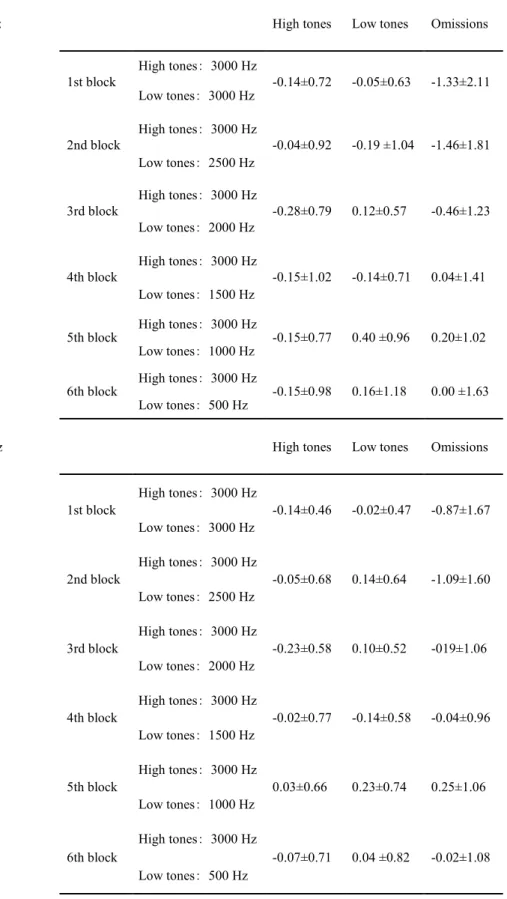
2. Table 1 shows the mean voltages of the ERPs for high tones, low tones, and stimulus omissions.
At Fz, the Geisser–Greenhouse (ε)-corrected repeated-measures ANOVA showed that there was a significant effect of block type (F(5,105)=3.776, P<0.05, ε=0.662) and event type (F(2,42)=4.683, P<0.05, ε=0.905), as well as a significant
block type by event type interaction (F(10,210)=3.169, P<0.05, ε=0.470).
At Cz, the two-way repeated-measures ANOVA showed that there was a significant effect of block type (F(5,105)=3.811, P<0.05, ε=0.695) and event type (F(2,42)=3.362 P<0.05, ε=0.955), as well as a significant block type by event type interaction (F(10,210)=2.476, P<0.05, ε=0.553).
At Fz, the mean voltages in response to omissions were significantly lower
12
than those in response to high tones and low tones in the first block (repetitive sequences) (high tones (3,000 Hz) - omissions: Dunnett’s multiple comparison test, p<0.05, two-tailed; low tones (3,000 Hz) - omissions: Dunnett’s multiple comparison test, p<0.01, two-tailed). In addition, the mean voltages in response to omissions were significantly lower than those in response to high tones and low tones in the second block (high tones: 3,000 Hz; low tones: 2,500 Hz) ) (high tones (3,000 Hz) - omissions:
Dunnett’s multiple comparison test, p<0.01, two-tailed; low tones (2,500 Hz) - omissions: Dunnett’s multiple comparison test, p<0.01, two-tailed).
At Cz, the mean voltages in response to omissions were significantly lower than those in response to high tones and low tones in the first block (repetitive sequences) (high tones (3,000 Hz) - omissions: Dunnett’s multiple comparison test, p<0.05, two-tailed; low tones (3,000 Hz) - omissions: Dunnett’s multiple comparison test, p<0.05, two-tailed). In addition, the mean voltages in response to omissions were significantly lower than those in response to high tones and low tones in the second block (high tones: 3,000 Hz; low tones: 2,500 Hz) (high tones (3,000 Hz) - omissions:
Dunnett’s multiple comparison test, p<0.01, two-tailed; low tones (2,500 Hz) - omissions: Dunnett’s multiple comparison test, p<0.01, two-tailed).
No significant differences between the mean voltages in response to high/low
13
tones and omissions were observed at either Fz or Cz in the other blocks (Fig. 3).
Discussion
This is the first study to systematically investigate the threshold of the frequency differences at which stream segregation occurs prior to temporal integration when these functions work together during a state of inattention. MMN components were elicited by occasional stimulus omissions in the repetitive tone sequence and the alternating sequence with a small frequency separation (high tones: 3,000 Hz; low tones: 2,500 Hz).
In contrast, no significant MMN was elicited by occasional stimulus omissions in conditions with frequency separations larger than or equal to 1,000 Hz.
Infrequent stimulus omissions elicit MMN only when the SOA between
successive tones is less than the 160–170 ms limit of the TWI (Yabe et al., 1997; Yabe et al., 1998; Yabe et al., 1999). Since the SOA between consecutive tones was uniformly 120 ms in all conditions, elicitation of MMN indicated that the time between successive tones was below the duration of the TWI (160–170 ms), suggesting that the tone
sequences were recognized as one stream. Lack of MMN indicated that the time between successive tones exceeded the duration of the TWI, suggesting that the tone sequences were recognized as two streams, with an interval of 240 ms.
14
Thus, from a neurophysiological perspective, our results indicated that stream segregation did not occur in conditions in which the frequency of low tones was 3,000 or 2,500 Hz but did occur when low tones were ≤2,000 Hz. These findings suggest that stream segregation occurred without attention and preceded temporal integration when the two processes occurred together. These findings are consistent with those of
previous studies (Ritter et al., 2000; Sussman et al., 1999; Sussman, 2005; Winkler et al., 2003; Yabe et al., 2001). In accordance with the findings of several previous studies, our findings support the notion that stream segregation is among the early auditory
processes that underlie the organization of auditory input. Because the reference frequency was set to 3,000 Hz, we observed that the threshold at which stream
segregation precedes temporal integration exists between 2,500 Hz and 2,000 Hz, and that stream segregation will precede temporal integration when the frequency difference is 1,000 Hz or larger. As previous studies have shown a close correspondence between MMN and sound perception (Amenedo & Escera, 2000; Tiitnen, May, Reinikainen, &
Näätänen, 1994; Winker, Tervaniemi, & Näätänen, 1997; Winkler et al, 2003; for reviews, see Näätänen, Alho, 1997; Näätänen & Winkler, 1999), the perceptual threshold of frequency difference for stream segregation in the tone sequences was presumed to be consistent with the result of this study. Therefore, we estimated the
15
perceptual threshold of frequency difference at approximately 1000 Hz.
The present study has several limitations of note. First, we only set high tones to 3,000 Hz; thus, the frequency differences at which stream segregation occurs prior to temporal integration when other reference frequencies are used remain uncertain.
Further examination is necessary with various reference frequencies to investigate the relationship between the frequency differences and reference frequency at which stream segregation occurs prior to temporal integration. Second, we did not examine whether similar results could be obtained using low tones with frequencies higher than 3,000 Hz.
Third, experiments were performed during inattention only, and the frequency
differences at which perceptual stream segregation occurred for tone sequences in this study was uncertain. Further examination is necessary to estimate the perceptual threshold for stream segregation for these tone sequences in an active situation. Future studies should consider these aspects to fully elucidate the relationship between stream segregation and temporal integration.
Conclusion
MMN components were elicited by occasional stimulus omissions in the repetitive tone sequence and alternating sequences with small frequency separation (high tones; 3,000
16
Hz, low tones; 2,500 Hz). In contrast, no significant MMN was elicited by occasional stimulus omissions in conditions with frequency separations greater than or equal to 1,000 Hz. Our results suggest that, when the reference frequency is set to 3,000 Hz, stream segregation will precede temporal integration during inattention when the frequency difference is 1,000 Hz or larger.
Acknowledgments
This work was supported by the Grant for Research Support of Fukushima Medical University [grant number: KKI26055]. The funding source was not involved in any aspect of the study.
Author contributions
Hirooki Yabe and Masayuki Hikita designed the study and wrote the protocol. Tetsuya Shiga and Masayuki Hikita managed the literature search and analyses. Masayuki Hikita, Shuntaro Itagaki, Michinari Nozaki, Yuhei Mori, Hirotoshi Hotsumi, and Kazuko Kanno carried out data acquisition. Shuntaro Itagaki, Takashi Matsuoka, Yusuke Osakabe, and Hiroshi Hoshino help to review the content of the manuscript.
Masayuki Hikita and Tetsuya Shiga undertook the statistical analysis and wrote the first
17
draft of the manuscript. All authors contributed to and have approved the final version of the manuscript.
Conflicts of interest
There are no conflicts of interest to declare.
18
References
Amenedo, E., & Escera, C. (2000). The accuracy of sound duration representation in the human brain determines the accuracy of behavioural perception. European Journal of Neuroscience, 12(7), 2570–2574.
https://doi.org/10.1046/j.1460-9568.2000.00114.x
Bregman, A. S. (1990). Auditory scene analysis: the perceptual organization of sound (Vol. 15). Cambridge, Massachusetts: The MIT Press.
Carlyon, R. P., Cusack, R., Foxton, J. M., & Robertson, I. H. (2001). Effects of attention and unilateral neglect on auditory stream segregation. Journal of
Experimental Psychology: Human Perception and Performance, 27(1), 115–127.
https://doi.org/10.1037/0096-1523.27.1.115
Cowan, N. (1984). On short and long audiology stores. Psychonomic Bulletin, 96(2), 341–370.
Cowan, N. (1995). Sensory memory and its role in information processing.
Electroencephalography and Clinical Neurophysiology. Supplement, 44, 21–31.
Retrieved from http://www.ncbi.nlm.nih.gov/pubmed/7649024
Cusack, R., Decks, J., Aikman, G., & Carlyon, R. P. (2004). Effects of location,
frequency region, and time course of selective attention on auditory scene analysis.
Journal of Experimental Psychology: Human Perception and Performance, 30(4), 643–656. https://doi.org/10.1037/0096-1523.30.4.643
Näätänen, R. (1992). Attention and brain function. In Attention and brain function.
London: Routledge. https://doi.org/10.4324/9780429487354
Näätänen, R., & Alho, K. (1997). Mismatch Negativity-The Measure for Central Sound Representation Accuracy. Audiology and Neurotology, 2(5), 341–353.
https://doi.org/10.1159/000259255
Näätänen, R., Gaillard, A. W. K., & Mäntysalo, S. (1978). Early selective-attention effect on evoked potential reinterpreted. Acta Psychologica, 42(4), 313–329.
https://doi.org/10.1016/0001-6918(78)90006-9
19
Näätänen, R., & Winkler, I. (1999). The concept of auditory stimulus representation in cognitive neuroscience. Psychological Bulletin, 125(6), 826–859.
https://doi.org/10.1037/0033-2909.125.6.826
Pedersen, C. B., & Salomon, G. (1977). Temporal integration of acoustic energy. Acta Oto-Laryngologica, 83(1–6), 417–423.
https://doi.org/10.3109/00016487709128866
Ritter, W., Sussman, E., & Molholm, S. (2000). Evidence that the mismatch negativity system works on the basis of objects. NeuroReport, 11(1), 61–63.
https://doi.org/10.1097/00001756-200001170-00012
Snyder, J. S., Alain, C., & Picton, T. W. (2006). Effects of attention on neuroelectric correlates of auditory stream segregation. Journal of Cognitive Neuroscience, 18(1), 1–13. https://doi.org/10.1162/089892906775250021
Sussman, E. S. (2005). Integration and segregation in auditory scene analysis. The Journal of the Acoustical Society of America, 117(3), 1285–1298.
https://doi.org/10.1121/1.1854312
Sussman, E., Ritter, W., & Vaughan, H. G. (1999). An investigation of the auditory streaming effect using event-related brain potentials. Psychophysiology, 36(1), S0048577299971056. https://doi.org/10.1017/S0048577299971056
Tiitinen, H., May, P., Reinikainen, K., & Näätänen, R. (1994). Attentive novelty detection in humans is governed by pre-attentive sensory memory. Nature, 372(6501), 90–92. https://doi.org/10.1038/372090a0
Van Noorden, L. P. A. S. (1975). Temporal coherence in the perception of sound sequences. Unpublished Doctoral Dissertation, Eindhoven University of Technology, Eindhoven, the Netherlands, Doctor.
Weber, D. L., & Green, D. M. (1978). Temporal factors and suppression effects in backward and forward masking. The Journal of the Acoustical Society of America, 64(5), 1392–1399.
20
Winkler, I., Sussman, E., Tervaniemi, M., Horvath, J., Ritter, W., & Näätänen, R.
(2003). Preattentive auditory context effects. Cognitive, Affective, & Behavioral Neuroscience, 3(1), 57–77. https://doi.org/10.3758/CABN.3.1.57
Winkler, I., Tervaniemi, M., & Näätänen, R. (1997). Two separate codes for missing-fundamental pitch in the human auditory cortex. The Journal of the Acoustical Society of America, 102(2), 1072–1082.
https://doi.org/10.1121/1.419860
Yabe, H., Sato, Y., Sutoh, T., Hiruma, T., Shinozaki, N., Nashida, T., … Kaneko, S.
(1999). The duration of the integrating window in auditory sensory memory.
Electroencephalography and Clinical Neurophysiology. Supplement, 49, 166–169.
Retrieved from http://www.ncbi.nlm.nih.gov/pubmed/10533103
Yabe, H., Tervaniemi, M., Reinikainen, K., & Näätänen, R. (1997). Temporal window of integration revealed by MMN to sound omission. NeuroReport, 8(8), 1971–
1974. https://doi.org/10.1097/00001756-199705260-00035
Yabe, H., Tervaniemi, M., Sinkkonen, J., Huotilainen, M., Ilmoniemi, R. J., & Näätänen, R. (1998). Temporal window of integration of auditory information in the human brain. Psychophysiology, 35(5), 615–619.
https://doi.org/10.1017/S0048577298000183
Yabe, H., Winkler, I., Czigler, I., Koyama, S., Kakigi, R., Sutoh, T., … Kaneko, S.
(2001). Organizing sound sequences in the human brain: the interplay of auditory streaming and temporal integration. Brain Research, 897(1–2), 222–227.
https://doi.org/10.1016/S0006-8993(01)02224-7
21
Figure legends
Figure 1. Stimuli used in the experiment We created six tone sequences of alternating high pure tones (high tones) and low pure tones (low tones), which were repeated in an alternating fashion. The frequency of high tones was fixed at 3,000 Hz, while that of low tones was set to 3,000 Hz, 2,500 Hz, 2,000 Hz, 1,500 Hz, 1,000 Hz, and 500 Hz in each block, respectively. In all blocks, high tones were omitted with 5% probability. All stimuli were 50 ms in duration (5 ms rise and fall times). Due to the duration of the SOA (120 ms), if stream segregation did not occur and the tone sequence was recognized as one stream, the time between successive tones always fell within the assumed temporal window of integration (TWI). If stream segregation occurred and the tone sequence was recognized as two streams, neighboring identical tones were
separated by a duration of 240 ms, which exceeds the estimated duration of the TWI.
Figure 2. Grand average waveforms of the responses to standard and deviant stimuli
The six stimuli are presented. The left column shows the grand average waveforms for high tones recorded from four electrodes (Fz, Cz, T5, and T6). The center column shows the grand average waveforms for low tones. The right column shows the grand
22
average waveforms for stimulus omissions. The arrows indicate the mismatch negativity (MMN).
Figure 3. Mean voltages of event-related potential (ERP) responses to standard tones and stimulus omissions
To determine whether mismatch negativity (MMN) had been elicited, we compared the mean voltages in response to stimulus omissions and high tones (omissions vs. high tones) at Fz and Cz, as well as the mean voltages in response to stimulus omissions and low tones (omissions vs. low tones), using Dunnett’s multiple comparison test. At both Fz and Cz, the mean voltages in response to omissions were significantly lower than those in response to high and low tones in the first block (repetitive sequences). In addition, the mean voltages in response to omissions were significantly lower than those in response to high and low tones in the second block (high tones: 3,000 Hz, low tones:
2,500 Hz). *p<0.05; **p<0.01.
Table 1. The mean voltages of event-related potentials (ERPs) for standard tones and stimulus omissions (unit: µV)
Fz High tones Low tones Omissions
1st block High tones: 3000 Hz
-0.14±0.72 -0.05±0.63 -1.33±2.11 Low tones: 3000 Hz
2nd block High tones: 3000 Hz
-0.04±0.92 -0.19 ±1.04 -1.46±1.81 Low tones: 2500 Hz
3rd block High tones: 3000 Hz
-0.28±0.79 0.12±0.57 -0.46±1.23 Low tones: 2000 Hz
4th block High tones: 3000 Hz
-0.15±1.02 -0.14±0.71 0.04±1.41 Low tones: 1500 Hz
5th block High tones: 3000 Hz
-0.15±0.77 0.40 ±0.96 0.20±1.02 Low tones: 1000 Hz
6th block High tones: 3000 Hz
-0.15±0.98 0.16±1.18 0.00 ±1.63 Low tones: 500 Hz
Cz High tones Low tones Omissions
1st block High tones: 3000 Hz
-0.14±0.46 -0.02±0.47 -0.87±1.67 Low tones: 3000 Hz
2nd block High tones: 3000 Hz
-0.05±0.68 0.14±0.64 -1.09±1.60 Low tones: 2500 Hz
3rd block High tones: 3000 Hz
-0.23±0.58 0.10±0.52 -019±1.06 Low tones: 2000 Hz
4th block High tones: 3000 Hz
-0.02±0.77 -0.14±0.58 -0.04±0.96 Low tones: 1500 Hz
5th block High tones: 3000 Hz
0.03±0.66 0.23±0.74 0.25±1.06 Low tones: 1000 Hz
6th block High tones: 3000 Hz
-0.07±0.71 0.04 ±0.82 -0.02±1.08 Low tones: 500 Hz
H H H H H H O H H H H H 120 ms
1st block
High tones:3000 Hz Low tones: 3000 Hz
2nd block
High tones: 3000 Hz Low tones: 2500 Hz
One stream
120 ms
One stream
Or Two streams
3000 Hz
3000 Hz
240 ms 240 ms
120 ms 120 ms
. . .
6th block
High tones: 3000 Hz Low tones: 500 Hz
Fig.1
3000 Hz
240 ms 240 ms
120 ms 120 ms
One stream
Or
Two streams
H H H O H H
L L L L L L
H: High tones L: Low tones O: Omissions
3000 Hz H H H O H H
L L L L L L
2500 Hz
2500 Hz
H H H O H H
L L L L L L
H H H O H H
L L L L L L
3000 Hz 500 Hz
500 Hz
-2 -1 0 1 2
Fz Cz T5 T6 -2
-1 0 1 2
Fz Cz T5 T6 -2
-1 0 1 2
Fz Cz T5 T6 -2
-1 0 1 2
Fz Cz T5 T6 -2
-1 0 1 2
Fz Cz T5 T6 -2
-1 0 1 2
Fz Cz T5 T6
-2 -1 0 1 2 -2 -1 0 1 -22 -1 0 1 2 -2 -1 0 1 2 -2 -1 0 1 -22 -1 0 1 2
-2 -1 0 1 2 -2 -1 0 1 -22 -1 0 1 2 -2 -1 0 1 -22 -1 0 1 2 -2 -1 0 1 2
Fig.2
1st block High tones: 3000 Hz Low tones: 3000 Hz
2nd block High tones: 3000 Hz Low tones: 2500 Hz
3rd block High tones: 3000 Hz Low tones: 2000 Hz
4th block High tones: 3000 Hz Low tones: 1500 Hz
5th block High tones: 3000 Hz Low tones: 1000 Hz
6th block High tones: 3000 Hz
Low tones: 500 Hz
High tones Low tones Omissions
[ms] [ms] [ms]
[μV] [μV] [μV]
-4
-3
-2
-1
0
1
4th block High tones: 3000 Hz Low tones: 1500 Hz
-4
-3
-2
-1
0
1
6th block High tones: 3000 Hz
Low tones: 500 Hz -4
-3
-2
-1
0
1
5th block High tones: 3000 Hz Low tones: 1000 Hz -4
-3
-2
-1
0
1
4th block High tones: 3000 Hz
Low tones: 1500 Hz -4
-3
-2
-1
0
1
3rd block High tones: 3000 Hz Low tones: 2000 Hz -4
-3
-2
-1
0
1
2nd block High tones: 3000 Hz
Low tones: 2500 Hz -4
-3
-2
-1
0
1
1st block High tones: 3000 Hz Low tones: 3000 Hz
-4
-3
-2
-1
0
1
5th block High tones: 3000 Hz
Low tones: 1000 Hz -4
-3
-2
-1
0
1
3rd block High tones: 3000 Hz Low tones: 2000 Hz -4
-3
-2
-1
0
1
1st block High tones: 3000 Hz
Low tones: 3000 Hz
*
Fig.3 Fz.
Cz.
**
** **
* *
[μV] [μV] [μV] [μV]
[μV] [μV] [μV] [μV] [μV] [μV]
-4
-3
-2
-1
0
1
2nd block High tones: 3000 Hz Low tones: 2500 Hz [μV]
** **
-4
-3
-2
-1
0
1
6th block High tones: 3000 Hz
Low tones: 500 Hz [μV]