Development of High Performance Membrane/Electrode
Assemblies for Polymer Electrolyte Fuel Cells Operable
Under Wide-Ranging Temperature and Humidity Conditions
A Doctoral Thesis
Presented to the
Interdisciplinary Graduate School of Medicine and Engineering
University of Yamanashi
March 2014
Contents
Chapter 1 General introduction
1.1. Background………...….. 1
1.2. Polymer electrolyte membrane fuel cells (PEMFCs)……….2
1.3. Issues of PEMFCs 1.3.1. Cost improvement of PEMFCs………...………...6
1.3.2. Improvement of the range of operating conditions of PEMFCs……….…6
1.3.3. Improvement of water management in PEMFCs………...…..…...7
1.4. Objectives of this research………...……...7
1.5. References for Chapter 1………...……...10
Chapter 2 Investigation of the effect of pore diameter of gas
diffusion layers on cold start behavior and cell
performance of polymer electrolyte membrane fuel
cells
2.1. Introduction………..142.2. Experimental 2.2.1. Characterization of GDLs……….17
2.2.2. Preparation of membrane-electrode assembly (MEA) and experimental cell...17
2.2.3. Fuel cell operation 2.2.3.1. Electrochemically active surface area measurement………..18
2.2.3.2. Measurement of current-potential curves………...19
2.2.3.4. Cold start performance………...20
2.3. Results and Discussion 2.3.1. Characterization of GDLs………...…22
2.3.2. Effect of diameter on ECSA………...……24
2.3.3. Performances of 24BCH and 25BCH-cells under high and low humidity conditions……….25
2.3.4. The anti-flooding performance of the 24BCH and 25BCH cells…...………27
2.3.5. Measurement of differential pressure between gas inlet and outlet at the cathode……….………..30
2.3.6. Investigation of cold start properties………...………...35
2.4. Conclusions……….……… 45
2.5. References for Chapter 2……….……….47
Chapter 3 Investigation of the effect of a hydrophilic layer in the gas
diffusion layer of a polymer electrolyte membrane fuel
cell on the cell performance and cold start behaviour
3.1. Introduction………...503.2. Experimental 3.2.1. Characterization of GDLs………...…...53
3.2.2. Preparation of membrane-electrode assembly (MEA) and experimental cell………54
3.2.3. Fuel cell operation 3.2.3.1. Electrochemically active surface area measurement………..55
3.2.3.3. Cold start performance………...56
3.3 Results and Discussion 3.3.1. Characterization of GDLs………...………57
3.3.2. Effect of the hydrophilic layer of GDL on ECSA………..64
3.3.3. Performances of HL and conventional cells under high and low humidity conditions………64
3.3.4 Investigation of cold start properties………...68
3.4. Conclusions………..75
3.5. References for Chapter 3………..77
Chapter 4 General conclusions
………...………...81List of publications………...……….87
Meeting abstracts………...………...……….88
- 1 -
Chapter 1
General introduction
1.1. Background
Global energy consumption is increasing with the rapid growth of population and economy, which causes concerns about the exhaustion of fossil fuels and the destruction of the global environment. For solving these problems, the development of new energy sources friendly to the environment is required. Fuel cells have been attracting attention as a means of resolving environmental problems and have been studied by a number of research institutions.
Sir William Robert Grove introduced the principles of the fuel cells in 1839. He discovered the principle that when two platinum electrodes were immersed on one end in a solution of sulfuric acid and the other two ends were separately sealed in containers of oxygen and hydrogen, a constant current was found to be flowing between the electrodes [1,2]. The polymer electrolyte fuel cell (PEFC) is one of the types of fuel cell that has received the most attention. The polymer electrolyte membrane (PEM) was developed by the General Electric Company. PEFCs were used in the Gemini 5 spacecraft as electrical sources [1]. The PEFC with perfluorosulfonated acid membrane (Nafion) as the PEM was developed by Ballard Power Systems Inc. [3]. This cell showed higher durability and performance than those of past cells, which led to the PEFC being focused on as an electrical source for residential co-generation systems, fuel cell vehicles (FCVs) and portable devices.
In the 2000s, demonstration projects for fuel cells for residential co-generation systems have been in progress in Japan. In 2009, the sale of PEFCs for residential
- 2 -
co-generation systems to the general public was started, with the help of subsidies from the government of Japan. With regard to FCVs, Honda Motor Co., Ltd. started leasing these in 2008. Leading Japanese auto-makers plan the full-scale introduction of FCVs in 2015.
1.2. Polymer electrolyte fuel cells (PEFCs)
Fuel cells are classified as follows: the polymer electrolyte fuel cell (PEFC), the alkaline fuel cell (AFC), the phosphoric acid fuel cell (PAFC), the molten carbonate fuel cell (MCFC), and the solid oxide fuel cell (SOFC). Each type of fuel cell has a different electrolyte, which leads to a different operating temperature. Hydrogen is often used as the fuel for fuel cells. This is one of the advantages of fuel cells, because hydrogen can be produced from various precursors such as methanol or liquid petroleum gas. Fuel cells also have other advantages:
1. Chemical energy can be converted to electrical energy in fuel cells without the efficiency limitation of the Carnot cycle.
2. The fuel cell can generate power on site, which leads to the ability to attain higher efficiency by the co-generation system, in which waste heat from the cell is used for space heating.
3. The emissions of CO2, NOx and SOx are low, because the fuel is not combusted
directly.
4. Fuel cells can be operated for an indefinite time period by continuing to supply the reactants externally.
- 3 -
Based on the above advantages, fuel cells are anticipated to be used as power sources for a wide range of applications such as vehicles, home electrical power, cell-phones and personal computers.
The PEFC has been focused on as an electrical source for residential co-generation systems, vehicles (FCVs) and portable devices due to its low operating temperature (below 0oC – over 80oC) and high power density. A schematic diagram of a PEFC is shown in Fig. 1-1. In general, the PEFC is composed of a PEM and two gas diffusion electrodes (GDEs), and the structure of the PEM sandwiched between the two GDEs is called a membrane-electrode assembly (MEA). A perfluorosulfonated acid membrane such as Nafion is typically used as the PEM due to its high proton conductivity. However, in recent years, aromatic hydrocarbon-based membranes have been focused upon in terms of cost [4-8].
The GDE consists of catalyst layer (CL) and gas diffusion layer (GDL). The CL is composed of an electrocatalyst, which consists of platinum (Pt) or Pt-alloy nanoparticles supported on high surface carbon blacks, and a proton-conducting binder. The GDL is composed of wet-proofed carbon paper (CP) and wet-proofed carbon nanoparticles (microporous layer, MPL). Polytetrafluoroethylene (PTFE) is generally used as a water repellent agent.
Hydrogen and oxygen are supplied to the anode and the cathode as the reactant gases, respectively. The hydrogen oxidation reaction (HOR) and oxygen reduction reaction (ORR) take place on the anode and cathode, respectively. These reactions can be written as follows:
- 4 - Anode : H2 → 2H+ + 2e- (Eq. 1-1)
Cathode : 1/2O2 + 2H+ + 2e- → H2O (Eq. 1-2)
Cell reaction : H2 + 1/2O2 → H2O (Eq. 1-3)
When all of the reactants in Eq.1-3 are in standard states, the theoretical electromotive force E0 is written as follows:
E0 = -ΔG0 / 2F (Eq. 1-4)
Here, ΔG0 is the Gibbs free energy of Eq. 1-3, and F is the Faraday constant. In the case of the PEFC, E0 would be 1.23 V at 25oC; however, when the cell is operating, polarization must occur due to ohmic resistance, activation overpotential and concentration overpotential. These losses are converted to heat, which can be made available for water heating in residential co-generation systems. This is one of the advantages of PEFCs, because the use of waste heat leads to increased efficiency. PEFCs have the following additional advantages:
1. There is no leakage of electrolyte due to the electrolyte being solid-state.
2. PEFCs can be operated under a pressured condition due to the fact that the PEM can act as a partition for gasses.
3. PEFCs have high voltage and power density.
4. The warm-up of the cell is faster than that for high temperature fuel cells due to its relatively low operating temperature.
l
low operatinng temperat
Fi ture.
ig. 1-1. Sche
- 5 -
- 6 -
1.3 Issues of PEMFCs
1.3.1. Cost improvement of PEMFCs
While the PEMFC have many advantages as mentioned above, various problems exist that impede the popularization of PEMFC systems. The issue of cost of the MEA components is one of the most important problems.
The production process of perfluorosulfonated acid membranes such as Nafion used as the PEM is complicated, which leads to high production costs. In recent years, the aromatic hydrocarbon-based membrane has been focused upon in terms of cost reduction [4-8].
Because PEFCs are operated at low temperature, Pt catalysts, which have high catalytic activity at low temperature, are generally used. It is considered that the Pt catalyst accounts for 30% of the cost of the total PEFC system. A decrease in the usage of Pt catalyst can contribute to a cost reduction for PEFCs. Therefore, Pt alloy catalysts, which combine Pt with a non-precious metal [9-12], and non-Pt catalysts [13,14] have been focused on.
1.3.2. Improvement of the range of operating conditions of PEMFCs
Generally, PEFCs will be operated in the range of temperature from room to 80oC. However, especially in the case of PEFCs for FCVs, the cells will be operated over a wider temperature range of temperatures, for example, from below 0oC to over 100oC. When the cell is operated at temperatures over 100oC, the mechanical strength of the perfluorosulfonated acid membrane can be degraded, and the proton conductivity can be decreased due to dehydration. Therefore, novel PEMs that have higher durability and conductivity at high temperatures are required.
- 7 -
When the cell is operated below 0oC, a decrease in catalytic activity can occur, which leads to a decrease in cell performance. Also, the generated water can be frozen in the pores of the CL and the interface between the GDE and PEM, which leads to the destruction of the MEA components due to the volume increase of water when it freezes. With the heater having been removed in order to simplify the system, the cell must be heated by its own waste heat. Higher cell performance is also required in startup from subfreezing temperatures.
1.3.3. Improvement of water management in PEFCs
When the water content of the PEM and proton-conducting binder in CL is sufficiently high, these have high proton conductivity. Protons generated in the anode are transported with hydration water to the cathode CL via the proton-conducting binder and the PEM. Generally, the proton-conducting binder and PEM are humidified by the gas supplied from a humidifier. At present, PEM degradation by OH radicals can be a critical issue under low humidity conditions. Therefore, sufficient humidification of the MEA is required. However in this case, liquid water is formed easily in the pores of the MEA, which leads to a decrease and destabilization of the cell potential due to the interruption of the reactant supply to the catalyst surface by the liquid water. This behavior is described as flooding. Thus, a MEA with high performance under conditions of both high and low humidity is required.
1.4. Objectives of this research
In order to popularize PEFCs, the improvement of performance over a wide range of operating conditions, including high and low humidities and cell temperatures ranging
- 8 -
from subfreezing to normal operating temperature, is required.
The issue of water management at normal operating temperature (for example, 80oC) has been investigated intensively, and various improvements in cell construction have been proposed to deal with the wide range of possible ambient humidities [15-22]. At high humidity, generated water can condense, blocking the air supply, while at low humidity, water loss can lead to membrane drying and decreased proton conductivity. Therefore, it has been necessary to design special types of gas diffusion structures that are immune to both flooding and drying [15,16].
Furthermore, during startup at subzero temperatures, the freezing of water generated by oxygen reduction in the cathode is an important issue, and various approaches have also been proposed to alleviate the problems caused by the resulting ice, which plugs the gas diffusion networks in the air cathode, leading to cell voltage degradation [22-28]. Since the PEMFC can be operated under all of these conditions, the development of better solutions for water management in the membrane-electrode assembly (MEA) are needed to cover all conditions.
The PEM, electrocatalysts, proton-conducting binder and gas diffusion layers (GDLs) constitute the MEA and work together to determine the PEFC performance. The GDL is the principal component used for the maintenance of reactant gas diffusion capability as well as the wetting of the proton-conducting electrolyte. As pointed out above, since the vaporization and the condensation or freezing of the generated water lead to the decrease of the cell performance, the enhancement of the GDL can provide the key to improving the PEMFC performance under various conditions such as high or low humidity and subfreezing temperatures. Therefore we focused on the structure of the GDL for improvement of the cell performance over a wide range of operating
- 9 - conditions.
Various types of useful information concerning GDLs have been summarized recently [15,16]. The most common type of GDL is composed of hydrophobically treated carbon paper (CP) and a microporous layer (MPL), which contains carbon powder. The carbon paper substrate can function as a gas diffuser and as a mechanical support for the electrode. The MPL can reduce the contact resistance between the catalyst layer (CL) and CP due to the fact that it forms a flat, uniform layer.
In Chapter 2, we report the effect of the pore diameter of the GDL on cold startup performance. The pore diameter is one of the most important factors, because it is expected that it influences the performance under cold startup conditions, controlling the rate at which the generated water condenses. Moreover, not only the cold startup performance but also the performance at a standard temperature such as 80oC must be improved for the development of PEFCs. The effects of the pore diameter of the GDL on PEFC performance at both standard and subfreezing temperatures are linked and discussed in Chapter 2.
In Chapter 3, we have focused on the effect of a GDL with a hydrophilic layer (HL) placed between the MPL and the CP. Because the HL can absorb the generated water from the CL, it was expected that this GDL could improve the performance of water removal or retention. Under both high humidity and subfreezing conditions, generated water can condense easily, and thus, the improvement of water removal is expected to alleviate the blocking of gas diffusion by condensed water in the CL. Under low humidity conditions, water can vaporize easily, and thus, the improvement of water retention by the HL is expected to inhibit dehydration and decreased proton conductivity of the electrolyte. In this Chapter, the effect of the GDL with HL
- 10 -
(HL-GDL) on the PEFC performance has been investigated, not only under standard temperature conditions but also under subfreezing conditions.
In Chapter 4, I conclude this thesis.
1.5. References for Chapter 1
[1] J.M. Andujar, F. Segura, Fuel cells: History and updating. A walk along two centuries, Renewable and Sustainable Energy Reviews 13 (2009) 2309.
[2] Grimes PG, Historical pathways for fuel cells. IEEE Aerospace and Electronic Systmes Magazine 2000; 15 (12) 1.
[3] Gregor Hoogers, Fuel Cell Technology Handbook, 2003
[4] K. Miyatake, N. Asano, M. Watanabe, Synthesis and Properties of Novel Sulfonated Polyimides Containing 1,5-Naphthylene Moieties. Journal of Polymer Science 41 (2003) 3901.
[5] K. Miyatake, Y. Chikashige, and M. Watanabe, Novel Sulfonated Poly(arylene ether): A Proton Conductive Polymer Electrolyte Designed for Fuel Cells, Macromolecules, 36 (2003) 9691
[6] K. Miyatake and M. Watanabe, Recent Progress in Proton Conducting Membranes for PEFCs, Electrochemistry, 73 (2005) 12.
[7] A. Kabasawa, J. Saito, H. Yano, K. Miyatake, H. Uchida, and M. Watanabe, Durability of a Novel Sulfonated Polyimide Membrane in Polymer Electrolyte Fuel Cell Operation, Electrochimica Acta, 54 (2009) 1076.
[8] T. Okanishi, Y. Tsuji, Y. Sakiyama, S. Matsuno, B. Bae, K. Miyatake, M. Uchida, and M. Watanabe, Effect of PEFC Operating Conditions on the Durability of Sulfonated Poly(arylene ether sulfone ketone) Multiblock Membranes, Electrochimica Acta 56
- 11 - (2011) 8989
[9] T. Toda, H. Igarashi, and M. Watanabe, Role of Electronic Property of Pt and Pt Alloys on Electrocatalytic Reduction of Oxygen, Journal of Electrochemical Society 145 (1998) 4185.
[10] T. Toda, H. Igarashi, H. Uchida, and M. Watanabe, Enhancement of the Electroreduction of Oxygen on Pt Alloys with Fe, Ni, and Co, Journal of Electrochemical Society 146 (1999) 3750.
[11] H. Yano, M. Kataoka, H. Yamashita, H. Uchida, and M. Watanabe, Oxygen Reduction Activity of Carbon-Supported Pt-M (M = V, Ni, Cr, Co, and Fe) Alloys Prepared by Nanocapsule Method, Langmuir, 23 (2007) 6438
[12] K. Okaya, H. Yano, H. Uchida, and M. Watanabe, Control of Particle Size of Pt and Pt Alloy Electrocatalysts Supported on Carbon Black by the Nanocapsule Method, ACS Applied Materials and Interfaces 2 (2010) 888.
[13] A. Serov, C. Kwak, Review of non-platinum anode catalysts for DMFC and PEMFC application, Applied Catalysis B: Environmental 90 (2009) 313.
[14] A. Brouzgoua, S.Q. Songb, P. Tsiakarasa, Low and non-platinum electrocatalysts for PEMFCs: Current status, challenges and prospects, Applied Catalysis B: Environmental 127 (2012) 371.
[15] S. Park, J-W. Lee, B. N. Popov, A review of gas diffusion layer in PEM fuel cells: Materials and designs, International Journal of Hydrogen Energy 37 (2012) 5850.
[16] L. Cindrella, A. M. Kannan, J. F. Lin, K. Saminathan, Y. Ho, C. W. Lin, J. Wertz, Gas diffusion layer for proton exchange membrane fuel cells – A review, Journal of Power Sources 194 (2009) 146.
- 12 -
Diffusion layer parameters influencing optimal fuel cell performance, Journal of Power Sources 86 (2000) 250.
[18] S. Park, J-W. Lee, B. N. Popov, Effect of carbon loading in microporous layer on PEM fuel cell performance, Journal of Power Sources 163 (2006) 357.
[19] J. H. Chun, K. T. Park, D. H. Jo, J. Y. Lee, S. G. Kim, S. H. Park, E. S. Lee, J. Y. Jyoung, S. H. Kim, Development of a novel hydrophobic/hydrophilic double micro porous layer for use in a cathode gas diffusion layer in PEMFC, International Journal of Hydrogen Energy 36 (2011) 8422.
[20] T. Kitahara, H. Nakajima, K. Mori, Hydrophilic and hydrophobic double microporous layer coated gas diffusion layer for enhancing performance of polymer electrolyte fuel cells under no-humidification at the cathode, Journal of Power Sources 199 (2012) 29.
[21] T. Kitahara, H. Nakajima, M. Inamoto, M. Morishita, Novel hydrophilic double microporous layer coated gas diffusion layer to enhance performance of polymer electrolyte fuel cells under both low and high humidity, Journal of Power Sources 234 (2013) 129.
[22] S. Hirakata, T. Mochizuki, M. Uchida, H. Uchida, M. Watanabe, Investigation of the effect of pore diameter of gas diffusion layers on cold start behavior and cell performance of polymer electrolyte membrane fuel cells, Electrochimica Acta 108 (2013) 304.
[23] K. Tajiri, Y. Tabuchi, C-Y. Yang, Isothermal cold start of polymer electrolyte fuel cells, Journal of the Electrochemical Society 154 (2007) B147.
[10] F. Jiang, W. Fang, C-Y. Yang, Non-isothermal cold start of polymer electrolyte fuel cells, Electrochimica Acta 53 (2007) 610.
- 13 -
[24] E. L. Thompson, J. Jorne, W. Gu, H. A. Gasteiger, PEM fuel cell operation at -20oC . I. Electrode and membrane water (charge) storage, Journal of the Electrochemical Society 155 (2008) B625.
[25] E. L. Thompson, J. Jorne, W. Gu, H. A. Gasteiger, PEM fuel cell operation at -20oC . II. Ice formation dynamics, current distribution, and voltage losses within electrodes, Journal of the Electrochemical Society 155 (2008) B887.
[26] Y. Ishikawa, H. Hamada, M. Uehara, M. Shiozawa, Super-cooled water behavior inside polymer electrolyte fuel cell cross-section below freezing temperature, Journal of Power Sources 179 (2008) 547.
[27] Y. Hiramitsu, N. Mitsuzawa, K. Okada, M. Hori, Effects of ionomer content and oxygen permeation of the catalyst layer on proton exchange membrane fuel cell cold start-up, Journal of Power sources 195 (2010) 1038.
[28] Z. Miao, H. Yu, W. Wei, L. Hao, Z. Shao, Q. Shen, J. Hou, B. Yi, Characteristics of proton exchange membrane fuel cells cold start with silica in cathode catalyst layers, International Journal of Hydrogen Energy 35 (2010) 5552.
- 14 -
Chapter 2
Investigation of the effect of pore diameter of
gas diffusion layers on cold start behavior
and cell performance of polymer electrolyte
membrane fuel cells
2.1. Introduction
Recently, polymer electrolyte fuel cells (PEFCs) have been a subject of enormous interest for applications as energy sources for electric vehicles, residential cogeneration systems, and portable devices. For further popularization of these devices, PEFCs require high performance over a wide range of cell temperatures, not only standard operating conditions, but also subfreezing temperatures.
When a PEFC is operated at subfreezing temperatures, the water generated by oxygen reduction in the cathode freezes, leading to cell voltage degradation, because the ice blocks the air supply or decreases the conductivity of the electrolyte. When a PEFC is operated at a usual temperature (for example, 80oC), the generated water can condense and also block the air supply. Alternatively, the water could vaporize too rapidly, drying the membrane and decreasing its conductivity. Therefore, solutions for the optimum management of water in the membrane-electrode assembly (MEA) are required for operation under all of these conditions.
The MEA is composed of a polymer electrolyte membrane, electrocatalyst, proton-conducting binder, and gas diffusion layers (GDLs). These are important factors
- 15 -
for determining the fuel cell performance. The GDL is one of the especially important components for the maintenance of gas transport and wettability of proton-conducting electrolytes and for the improvement of the cell performance at high or low humidity and under subfreezing conditions.
PEFC performance for cold startup from subfreezing temperatures is important for automobile applications, which are being focused on by many researchers. The generated water forms ice during the cold startup in the MEA unless the cell temperature exceeds 0oC; the degradation of fuel cell components has thus been a concern [1-7]. Yang et al. [1] investigated the cause of cell performance degradation in terms of kinetic, ohmic, and mass transport losses with their uniquely designed cold-start cycling test protocol. In addition, the microstructural and chemical changes in aged MEAs were investigated by transmission electron microscopy (TEM), scanning electron microscopy (SEM), and X-ray diffraction (XRD) using cross-sectioned MEA samples. The results show that the cycling test leads to increased ohmic and mass transport losses due to the delamination between the cathode catalyst layer and GDL, as well as the collapse and densification of cathode catalyst layer. Guo et al. [2] presented the effects of freeze-thaw cycles between 20 and -30oC on the physical properties and performance of MEAs. They found that cracks and catalyst domain segregation were observed in a fully hydrated MEA; however, no degradation of components was observed in a dehydrated MEA.
Visualization experiments utilizing a microscope were also performed for the improved understanding of the mechanism and location of the degradation of MEA components [8-11]. Ishikawa et al. [8] constructed a cell for observing the cross-section from the cathode catalyst layer to the bipolar plate during operation at subfreezing
- 16 -
temperatures. This experiment clarified the water freezing location and the presence of super-cooled water. Li et al. [9] investigated the location of water freezing by means of a field emission scanning electron microscope (FESEM) with a cryogenic stage and sample preparation unit. The MEA was placed in the SEM while taking precautions not to thaw the freezing water after an isothermal cold start. The results showed that the pores of the cathode catalyst layer of the MEA operated up to the point at which further isothermal operation was impossible at the subfreezing temperature due to the pores being nearly filled by generated water.
However to date, the effect of various parameters of the MEA components, especially the pore diameter of the GDL, on PEFC cold startup from subfreezing temperatures has not been reported in the literature. Moreover there are no reports that have discussed both the performance during cold startup and under usual conditions for one particular MEA.
In this research, the effect of the pore diameter of the GDL on cold startup performance was focused on. The pore diameter is one of the most important factors, because it is expected that it influences the performance under cold startup conditions, controlling the rate at which the generated water condenses. Moreover, not only the cold startup performance but also the performance at a standard temperature such as 80oC must be improved for the development of PEFCs. The effects of the pore diameter of the GDL on PEFC performance at both standard and subfreezing temperatures are linked and discussed in this chapter.
- 17 -
2.2. Experimental
2.2.1. Characterization of GDLs
In this study, 24BCH (lower porosity) and 25BCH (higher porosity) (SGL Technologies, GmbH, Fuel Cell Components Division) gas diffusion layers (GDLs) were used. These consist of a hydrophobized sheet of carbon paper, either lower or higher porosity, with a standard microporous layer (MPL) attached on one side in both cases. Their pore-size distributions were measured by use of a mercury porosimeter (Auto Pore 9500, Shimadzu Corporation). Also, the pore-size distributions of the hydrophobized carbon papers alone were measured in order to examine the influence of the MPL on the pore-size distribution. These samples were cut into sections of about 15 cm2 with a cutting die. Then these were shredded and placed into the experimental cell, and the pore-size distributions were analyzed. Table 2 shows the GDL parameters. The average pore diameters of 24 BCH and 25 BCH, as analyzed by the manufacturer, were 2.4 and 4.3 μm, respectively. These values are mainly used for identification of the lower and higher porosity GDLs, since they are based on an overall average of the very large pores of the carbon paper and the much smaller pores of the MPL and thus have no direct significance.
2.2.2. Preparation of membrane-electrode assembly (MEA) and experimental cell
The catalyst paste was prepared by mixing the Pt/CB (TEC10E50E, Tanaka Kikinzoku Kogyo K. K.), Nafion binder (ion exchange capacity, IEC = 0.9 meq/g, DE521, E. I. Du Pont de Nemours & Co., Inc.), pure water and ethanol by ball milling for 30 min. The mass ratio of Nafion binder to the carbon support (Nafion/C) was adjusted to 0.70. The catalyst layers were formed either on the wet-proofed GDLs or on
- 18 -
both sides of the electrolyte membrane by spraying the catalyst paste by use of a pulse-swirl-spray apparatus (Nordson), and were dried at 60oC. The geometric area and the Pt-loading amount of all catalyst layers were 29.2 cm2 and 0.58 mg/cm2, respectively. The MEAs were prepared by hot-pressing either a commercial catalyst-coated Nafion membrane or an uncoated membrane (NRE212 and 211, DuPont, 50 and 25 μm thick, respectively) sandwiched between two GDLs or gas diffusion electrodes (GDEs) at 140oC and 10 kg・f/cm2 for 3 min. The MEA was mounted into a Japan Automobile Research Institute (JARI) standard cell. Both cathode and anode carbon separators had serpentine flow channels. In this chapter, the cells utilizing the 24BCH and 25BCH GDLs will be denoted as the 24BCH-cell and 25BCH-cell, respectively.
2.2.3. Fuel cell operation
2.2.3.1. Electrochemically active surface area measurement
The effects of the pore diameter of the GDL on the electrochemically active surface area (ECSA) of the Pt catalyst at the cathode catalyst layer were investigated by cyclic voltammetry (CV, PGST30 Autolab System, Eco-Chemie) at Tcell = 40oC. Fully
humidified hydrogen and nitrogen were supplied to the anode and cathode, respectively, by use of a gas supply station (890-G, Toyo Corporation). The hydrogen anode was used as the reference electrode. Prior to obtaining the cyclic voltammogram, 100 ml min-1 of hydrogen and 150 ml min-1 of nitrogen were supplied to anode and cathode at fully humidity, respectively, and a potential sweep was performed from 0.08 to 1.0 V at 20 mV/sec, until the voltammogram was reproducible, in order to ensure complete cleaning of the Pt surface in the catalyst layer. Prior to the potential sweep, the cathode
- 19 -
potential was maintained at 0.08 V. Then, the N2 flow was stopped, and the potential
was swept from 0.08 V to 1.0 V at 20 mV s-1. The value of ECSA was calculated from the hydrogen adsorption charge in the negative-going potential scan, referred to ΔQH0 =
0.21 mC cm-2, adopted conventionally for clean polycrystalline platinum [12, 13].
2.2.3.2. Measurement of current-potential curves
To evaluate the cell performance under standard operating conditions, current-potential (I-E) curves were measured at Tcell = 65oC (100% RH) or 80oC (53%
RH). Pure hydrogen and pure oxygen or air was supplied to the anode and the cathode, respectively. The gas utilizations at the anode and the cathode were 70% and 40%, respectively. In this measurement, the high frequency resistance (HFR) of cell was observed with an AC milliohmmeter, (Model 3356 Tsuruga Electric Corporation) at 1 kHz. To investigate the difference of diffusivity between 24BCH and 25BCH, the O2
gain performance (difference in potentials under air vs. O2) was calculated at 0.5 and
0.7 A cm-2. The mass activity, which is an indicator of catalyst utilization in the oxygen reduction reaction (ORR), was calculated by dividing the current density by the Pt loading amount in g cm-2.
2.2.3.3. Investigation of anti-flooding properties in the MEAs
Investigation of the anti-flooding properties in each of the MEAs was performed under the same standard operating conditions of Tcell = 65oC (100% RH) or 80oC (53%
RH). In these experiments, the fuel cells were operated at constant current density, either 0.2 or 0.5 A cm-2, and the air utilization was controlled at 40, 60, 70, and 75%. These data were logged for 900 s for each air utilization condition. In order to
- 20 -
investigate the flooding phenomena of these cathodes under each of the gas utilization conditions, the differential pressure between the gas inlet and outlet on the cathode side was simultaneously observed by use of a differential pressure meter (DT-8890, MK Scientific, Inc.).
2.2.3.4. Cold start performance
For the investigation of cold start performance from subzero temperatures, startup tests from -5 and -10oC were evaluated. A cold start-compatible fuel cell performance evaluation station (Panasonic Corporation) has been constructed with an environmental chamber (ESPEC CORP, SU-241). The single cell was placed in the chamber.
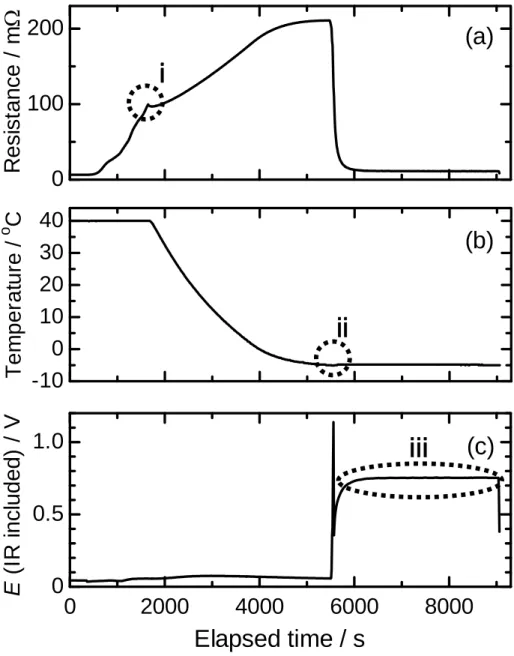
Figure 2-1 shows the behaviors of potential, temperature and resistance of the cells under the test protocol of the cold start from subzero temperature. At first, fully humidified nitrogen was supplied to both anode and cathode side until the cell voltage and resistance were stable. In order to investigate the independent effects of residual water and generated water, for sufficient drying of the electrodes, dry nitrogen gas was supplied to both anode and cathode until the cell resistance achieved 100 mΩ (shown as (i) in Fig. 1(a)). Then, the dry nitrogen purging and heating of the cell were stopped, and the cell was cooled to the target temperature in the environmental chamber (shown as (ii) in Fig. 1). In the cell cooling step, the nitrogen gas atmosphere has been maintained in the cell. After the cell temperature reached the target value, dry hydrogen and air were supplied to the anode and the cathode, respectively. After the open circuit voltage exceeded 1 V, the cell was started up at 0.05 A cm-2 (shown as (iii) in Fig. 1(b)). After that, the cell was operated in one of two modes, either constant current (0.05 A cm-2) or ramped current (current was increased by an additional 0.05 A cm-2 whenever the cell
- 21 - voltage reached 0.6 V).
The cyclic voltammogram of the cell was measured at -5oC to evaluate the ECA changes before and after the cold start test. The experimental method was the same as that described in Section 2.2.3.1 with the exception of using dry gases.
ⅰ
ⅱ
ⅲ
0
2000
4000
6000
8000
0
0.5
1.0
Elapsed time / s
(
IR
i
n
cl
uded)
/
V
E
(c)
0
100
200
R
e
s
is
tanc
e /
m
-10
0
10
20
30
40
T
e
m
per
at
ur
e /
oC
(a)
(b)
Fig. 2-1. Time dependent behavior of (a) cell resistance, (b) temperature and (c) potential of a conventional cell during PEFC cold start tests from -5oC in the constant current mode.
- 22 -
2.3. Results and Discussion
2.3.1. Characterization of GDLs
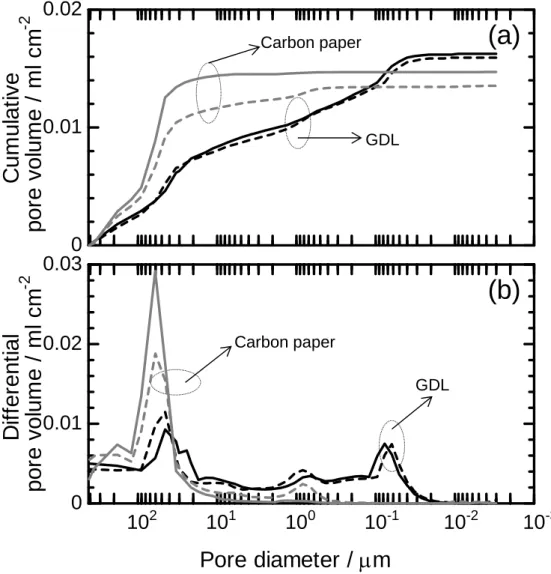
The pore-size distributions for cumulative and differential pore volume of the GDLs (24BCH and 25BCH) and the respective carbon papers are shown in Fig. 2-2. The pertinent data for these GDLs are listed in Table1. The major difference between 24BCH and 25BCH GDLs was the pore-size distribution inside the carbon paper, which has an effect on the air permeability (Table 2-1). The average pore sizes of 24BCH and 25BCH, as analyzed by the manufacturer, were 2.4 μm and 4.3 μm, respectively, but as already mentioned, these values only reflect an overall average and have little direct significance other than to designate the materials as lower and higher porosity. From these results, it can be seen that the average pore diameters of the overall GDLs were smaller than those of the carbon papers alone due to the averaging of both materials. It should be noted that the average values were different from the simple averages of both materials separately, because some of the carbon particles of the MPL were impregnated into the pores of the carbon paper. Comparing the pore-size distributions of both carbon papers, 25BCH has larger pores than those of 24BCH. The gas channel side of the GDL had the same pore characteristics as the carbon paper alone, because the MPL was impregnated into approximately half the thickness of the carbon paper on the membrane side. These results are consistent with the average pore diameter of 24BCH being smaller than that of 25BCH.
- 23 -
Thickness (µm)
Porosity (%)
Mean pore diameter (µm) Air permeability (cm3 cm-2 s-1) 24BCH 214 73.0 2.4 0.35 25BCH 200 76.4 4.3 0.65 GDL GDL Carbon paper Carbon paper
0
0.01
0.02
Cu
m
u
la
ti
v
e
p
o
re
vol
u
m
e
/
m
l cm
-210
-310
-210
-110
010
110
20
0.01
0.02
0.03
Pore diameter / m
Dif
fe
re
n
tia
l
p
o
re
v
o
lu
me
/ m
l c
m
-2(a)
(b)
Fig. 2-2. Dependence on pore diameter of (a) cumulative and (b) differential pore volume of 24BCH (dashed line) and 25BCH (solid line) and the corresponding curves for the carbon papers alone (gray lines).
current mode.
- 24 -
2.3.2. Effect of diameter on ECSA
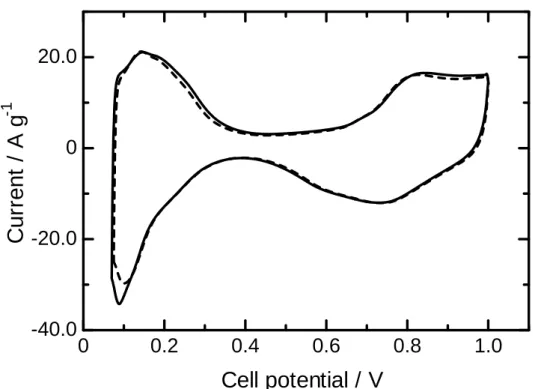
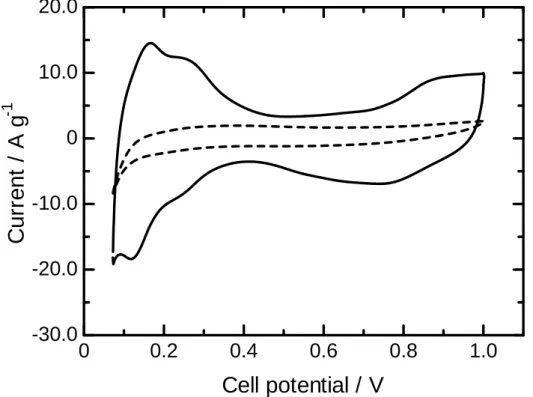
Figure 2-3 shows cyclic voltammograms of electrodes with 24BCH and 25BCH at Tcell = 40oC (100% RH). It was found that these voltammograms were nearly identical.
Their ECSA values, calculated from the hydrogen adsorption charge, were also nearly identical: 83.1 and 77.4 m2 g-1, respectively. It is thus clear that the difference in the effects of GDLs with different pore diameters on the ECSA is negligible. These electrodes had nearly equal catalyst utilization values and formed excellent proton transport networks.
0
0.2
0.4
0.6
0.8
1.0
-40.0
-20.0
0
20.0
Cell potential / V
C
u
rr
e
n
t / A
g
-1Fig. 2-3. Cyclic voltammograms comparing MEAs containing 24BCH (dashed line) or 25BCH (solid line) at Tcell = 40 oC (100% RH). lines).
- 25 -
2.3.3. Performances of 24BCH and 25BCH-cells under high and low humidity conditions
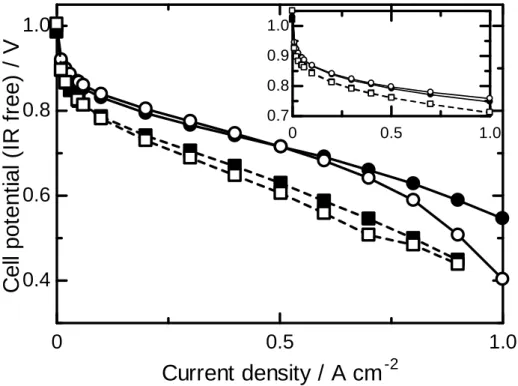
The I-E curves were measured for the investigation of the effects of the GDL pore diameter on the cell performance. Figure 2-4 shows the I-E curves measured at Tcell =
65oC (100% RH) and 80oC (53% RH). In the case of pure oxygen supply to the cathode side, both cells showed similar performance under both operating conditions. In the case of air supply to the cathode side, the 25BCH-cell showed more favorable performance than that of the 24BCH-cell in the high current density region (over 0.5 A cm-2) at 65oC (100% RH). The cell potential degradation using the 24BCH material in the high current density region was caused by mass transport overpotential in the cathode due to sluggish reactant supply. Under these conditions, the Nafion membrane and binder were humidified sufficiently by the humid gas and the generated water, and the proton transport network was effectively formed. Thus, the main factor in increasing the mass transport overpotential was that the gas supply to the cathode was blocked by droplets of generated water under the high humidification conditions. This result is consistent with the air permeability for 24BCH being smaller than that for 25BCH (Table 1).
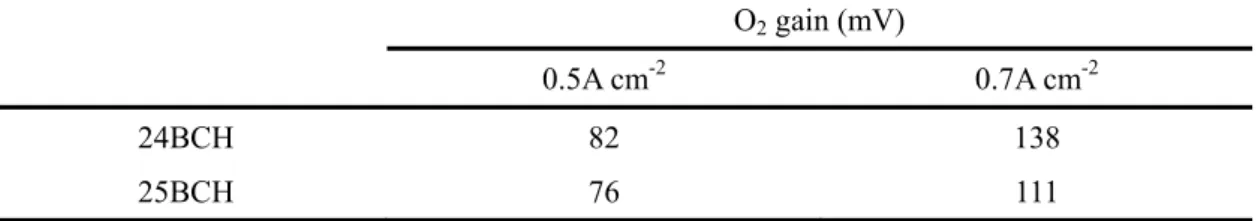
Tables 2-2 and 2-3 show the mass activity at 0.9 V (IR corrected) and the O2 gain
values calculated from cell potentials at 0.5 and 0.7 A cm-2. The mass activities for both cells were similar, and it was found that there was no difference in the catalyst utilization. This result corresponds to the results for ECSA shown in Section 2.3.2. The O2 gains for both cells at 0.5 A/cm2 were similar, but at 0.7 A cm-2, the O2 gain for the
25BCH-cell was smaller than that for the 24BCH-cell. Hence, this indicates that the 25BCH material has more favorable gas diffusibility and thus a better air diffusion network, due to its larger pores compared to those of the 24BCH material.
- 26 -
At Tcell = 80oC (53% RH), there were no significant differences in cell performance
between the two cells. Under the low humidity condition, the generated water evaporated without water droplet formation, and therefore there was no increase in mass transport overpotential. Mass activity (A g-1) O2 Air 65oC(100% RH) 80oC(53% RH) 65oC(100% RH) 80oC(53% RH) 24BCH 69.7 32.7 33.6 17.2 25BCH 68.1 34.7 29.3 16.5
0
0.5
1.0
0.4
0.6
0.8
1.0
Current density / A cm
-2C
e
ll pot
ent
ial
(
IR
f
ree)
/
V
0 0.5 1.0 0.7 0.8 0.9 1.0Fig. 2-4. I-E curves comparing MEAs containing 24BCH (open) and 25BCH (solid) at Tcell = 65 oC (100% RH) (circles) and Tcell = 80 oC (53% RH) (square) with air. The
inset shows the I-E curves with O2. current mode.
- 27 -
2.3.4. The anti-flooding performance of the 24BCH and 25BCH cells
To investigate the effect of the GDL pore diameter on the flooding behavior, the time dependence of the cell potential was measured at constant current density and under various air utilization (Uair) conditions. The anti-flooding performance was
estimated by the stability of the cell potential. These experiments were performed at Tcell
= 65oC (100% RH) so that the generated water may condense easily (i.e., flooding behavior will occur readily) and at Tcell = 80oC (53% RH), so that the generated water
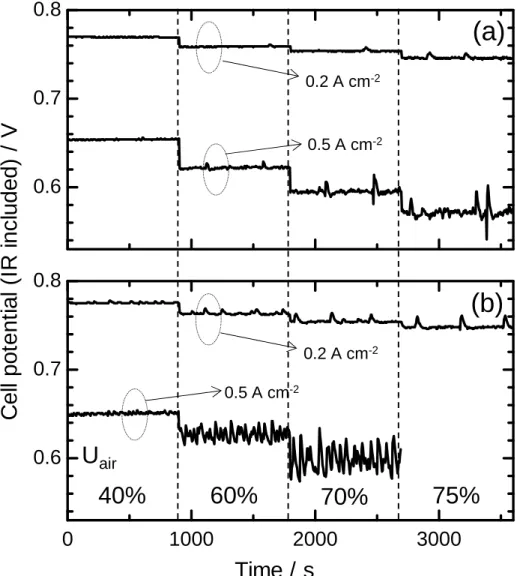
may evaporate easily. These cells were operated at both 0.2 A cm-2 and 0.5 A cm-2. Figure 5 shows the time dependences of the cell potential of (a) 24BCH-cell and (b) 25BCH-cell at Tcell = 65oC (100% RH) for various Uair values. The 24BCH-cell, with its
smaller pore diameter, showed very stable cell potentials at all Uair values in 0.2 A cm-2.
This result means that the 24BCH material has favorable anti-flooding performance. The potential of the 25BCH-cell, with its larger pores, was also stable at Uair = 40% in
0.2 A cm-2, but it became unstable with increasing Uair. The cell potential of the
25BCH-cell exhibited spiked peaks going from the baseline to positive values for utilizations greater than Uair = 60%. The magnitude and frequency of these peaks
increased with increasing Uair.
The potentials of both cells decreased with increasing Uair. Thus, it is considered that O2 gain (mV)
0.5A cm-2 0.7A cm-2
24BCH 82 138
25BCH 76 111
- 28 -
the mass transport overpotential increased with decreasing gas supply rate.
The potentials of these cells had been stabilized at Uair = 40% in 0.5 A cm-2. The
potential of the 24BCH-cell exhibited some spiked peaks for utilizations greater than Uair = 60%, and the fluctuations of the peaks increased with increasing Uair. On the other
hand, the potential of the 25BCH-cell was very unstable at 0.5 A cm-2. The baseline was indistinct for values greater than Uair = 60%. The 25BCH-cell was not able to operate at
Uair = 75%. These results suggest that the smaller pore diameter of the GDL improved
the anti-flooding performance.
The time dependences of the potential for both cells operated at Tcell = 80oC (53%
RH) at various Uair values were also measured. The potentials of both of these cells
were stable at all of the Uair conditions at both 0.2 and 0.5 A cm-2. The generated water
vaporized easily under the dry conditions at 53% RH, compared with 100% RH. These results show that the gas supply was not blocked by the condensation of generated water.
- 29 -
0.6
0.7
0.8
Time / s
Ce
ll p
o
te
n
tia
l (
IR in
c
lu
d
e
d
) /
V
0
1000
2000
3000
0.6
0.7
0.8
U
air40%
60%
70%
75%
0.2 A cm-2 0.5 A cm-2 0.2 A cm-2 0.5 A cm-2(a)
(b)
Fig. 2-5. Time dependences of cell potential with (a) 24BCH and (b) 25BCH for various air utilizations at Tcell = 65oC (100% RH) in 0.2 and 0.5 A cm-2.
- 30 -
2.3.5. Measurement of differential pressure between gas inlet and outlet at the cathode
In order to examine the flooding behavior under the high humidity conditions of the experiment in Section 2.3.4, the pressure differences between the gas inlet and outlet of the cathode side were measured. The time dependences of the differential pressure and the potentials of the same cells were measured simultaneously under various Uair
conditions. We expected that the changes of the differential pressure indicated changes in the gas flow conditions in the flow channels, which comprise the greater portion of the volume in the cell. If condensed water blocks the flow channel, the differential pressure should increase, because the gas flow rate is maintained at a constant value by a mass flow meter. On the other hand, when the condensed water is removed from the gas flow channel, the differential pressure should decrease.
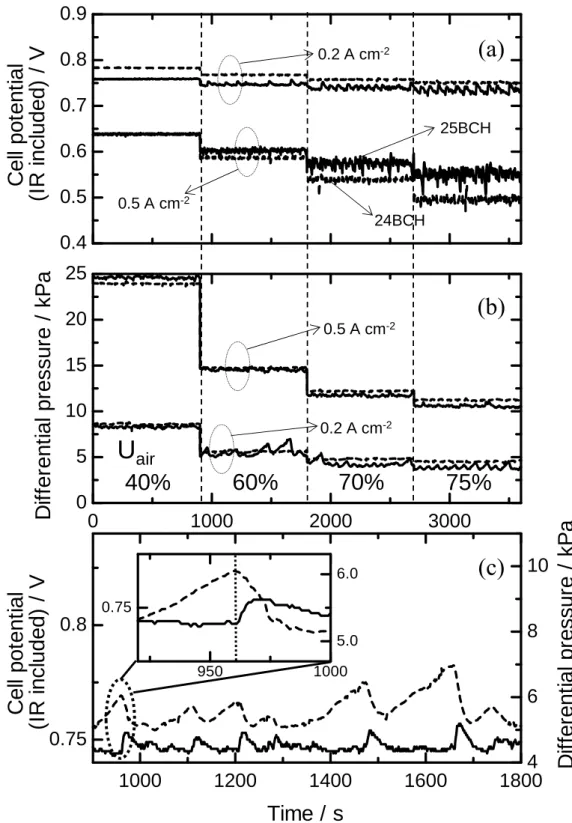
Figure 2-6 shows the time dependences of (a) the cell potential and (b) the differential pressure of the cells at Tcell = 65oC (100% RH) and various Uair. The
potential of 24BCH-cell was stable, similar to the result of Fig. 2-5. The differential pressure of the 24BCH-cell was also stable. This indicates that there was negligible blocking of the flow channel due to condensed water in the 24BCH-cell.
In the case of the 25BCH-cell, the potential and differential pressure were stable only at Uair = 40%. However, for values greater than Uair = 60%, it was found that not
only the cell potential but also the differential pressure became unstable. This result indicates that the flow channel blockage by condensed water was occurring continuously. In addition, as shown in Fig. 2-6(c) changes of both the differential pressure and the potential of the same cell were occurring synchronously, indicating that the positive peaks of the cell potential were caused by the changes of the partial
- 31 -
pressure of air, which decreased due to condensed water blockage and then increased due to elimination of the water, which resulted in increased air supply to the catalyst layer. Figure 6 shows that the changes of the cell potential were synchronized with those of the differential pressure. Such spikes are certainly caused by a flooding of the GDL, i.e., water droplets formed by the cathode reaction blocked pores in the GDL to decrease the O2 supply rate [14-18].
The capillary pressure also influences the diffusion of liquid water in the GDL. The capillary pressure is inversely proportional to the pore diameter. Therefore, the 24BCH GDL, with smaller pores exhibits a higher capillary pressure than the 25BCH GDL, with larger pores. This would imply that the smaller pore material would be blocked more easily by condensed water. However,Wilson et al. were the first to point out the droplet size effect with larger pores in gas diffusion media. They found that larger pores were associated with poorer performance, due to the fact that such pores allowed larger water droplets to form, which more effectively blocked the gas supply to the cathode [19]. Popov and coworkers have recently reviewed the interplay of various GDL characteristics on performance, including the average pore sizes in the carbon paper vs. the microporous layer, as well as the respective hydrophobicities [20].
Figure 2-7 shows schematic depictions of the mechanisms for the water removal phenomenon in the cathodes using (a) 24BCH and (b) 25BCH. Water condensation occurred easily, because the water vapor pressure was maximal under the fully humidified conditions. The temperature of the GDL gradually decreases toward the flow channel of the separator due to the reaction heat of the catalyst layer. Hence, water condensation would be expected to occur specifically in the GDL or the flow channel of the separator. Our group observed changes in the flooding resistance for MEAs with
- 32 -
two types of GDLs having different pore sizes [18]. By use of an optical technique for imaging water droplets, the phenomena were explained by changes in the sizes of the water droplets. Water condensed increasingly in the GDL with increasing current density and was exhausted to the flow channel of the separator. The 24BCH material has a smaller pore diameter and a lower porosity than those for 25BCH. The condensed water formed in 24BCH can thus form smaller droplets, which would have a larger contact surface area with the air supply air in the flow channel. Therefore, the generated water may be removed by vaporization, without increasing the differential pressure in case of 24BCH, as shown in Fig. 2-7(a).
In contrast, for 25BCH, as shown in Fig. 2-7(b), the condensed water formed larger droplets on the walls of the flow channel due to its larger pore diameter, and then the droplets grew simultaneously with increasing differential pressure, due to the controlled constant gas flow rate. In the case of the standard JARI cell, the separator has a single serpentine flow channel. Hence, the condensed water can be easily removed under increasing differential pressure. These behaviors were directly observed [18]. It was found that small water droplets were formed in the flow channel of the 24BCH-cell, and large water droplets were formed in the 25BCH-cell. We also conclude based on the above results that the peaks of the cell potential in Figs. 2-5 and 2-6 were caused by changes in the partial pressure of air, which increased due to blocking by condensed water and then decreased due to elimination of the water. Therefore, the changes in the cell potential are synchronized with those of the differential pressure.
- 33 -
U
air40%
60%
70%
75%
0.2 A cm-2 0.5 A cm-2 25BCH 24BCH 0.5 A cm-2 0.2 A cm-2 950 1000 0.75 5.0 6.0 0.4 0.5 0.6 0.7 0.8 0.9 0 1000 2000 3000 0 5 10 15 20 25Ce
ll p
o
te
n
tia
l
(I
R
i
n
c
luded)
/
V
D
iffe
re
n
ti
a
l p
re
s
s
u
re
/ k
P
a
1000 1200 1400 1600 1800 0.75 0.8 4 6 8 10Time / s
Ce
ll p
o
te
n
tia
l
(I
R
i
n
c
luded)
/
V
D
if
fe
rent
ia
l pr
es
s
u
re
/
k
P
a
Fig. 2-6. Time dependences of (a) potential and (b) differential pressure of cells with 24BCH (dashed line) and 25BCH (solid line) for various air utilizations at Tcell = 65oC
(100% RH) in 0.2 and 0.5 A cm-2. Figure (c) shows the time dependences of the cell potential (solid line) and the differential pressure (dashed line) of the 25BCH-cell between 900 and 1800 s. The inset in (c) shows an expanded image of the first spiked peak.
(a)
(b)
- 34 -
(a)
(b)
Temperature High Low CL GDL Flow channel Air 100%RH High Low Air 100%RH CL GDL Flow channel Temperature High Low TemperatureFig. 2-7. Mechanism of the water removal from MEAs containing (a) 24BCH and (b) 25BCH.
- 35 -
2.3.6. Investigation of cold start properties
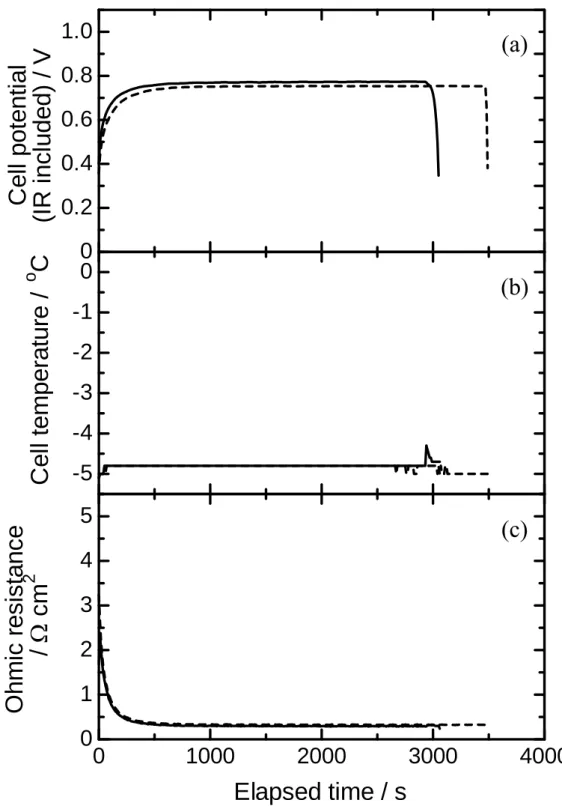
The effects of GDL pore diameter on the performance for cold startup from subfreezing temperatures were investigated. The time dependences of cell potential and cell temperature in constant current mode at -5oC are shown in Fig. 2-8. The cell operation times of the 24BCH-cell and 25BCH-cell were 3480 and 3060 s, respectively. These experiments were performed at least two times [11, 21]. The operation times at subfreezing temperatures were different in each experiment. However, the superiority of the 24BCH-cell was clearly shown. The results indicate that the 24BCH-cell, with the smaller pore diameter GDL, was able to operate longer. No increases in cell temperature were found in either cell, because the reaction heat was small, due to the current density being low (0.05 A cm-2) and the cell voltage being greater than ca. 0.7 V (i.e., low overpotential). After both cells were operated for the times mentioned above, drastic decreases of cell potential occurred, and then further operation became impossible. It is proposed that the supply of reactant gases or protons was blocked by the ice formed in the cells.
To investigate the reaction area during ice formation, cyclic voltammetry (CV) was measured before and after the cold startup experiments. After cooling the cells to -5oC, dry hydrogen and dry nitrogen were supplied to the anode and the cathode, respectively. Then the cells were operated at the subfreezing temperature. After the cell potential was observed to decrease, operation was stopped, dry nitrogen was supplied to cathode, and the CV was measured again at the controlled temperature of -5oC. Figure 9 shows the cyclic voltammogram before and after the cold startup experiments. Before the cold start, the current for hydrogen adsorption/desorption and for Pt oxidation/reduction, shown as a dashed line, were hardly distinguishable. It is considered that the
- 36 -
proton-conducting network had not formed in the vicinity of the Pt catalyst particles, because negligible water existed. In contrast, after the cold start, increased currents for hydrogen adsorption/desorption and Pt oxidation/reduction were observed, shown as a solid line. It was considered that the hydration of the Nafion binder located near the Pt catalyst particles had occurred and was evident even after the cell potential decreased. These results indicate that the reaction area of the Pt catalyst and the proton-conducting network were preserved even after the ice formed. Thus, the decrease of the cell potential did not occur due to a failure of the proton-conducting network. This statement is also supported by the fact that the cell resistance did not increase at the time of the cell potential decrease in Fig. 8(c). Therefore, it is considered that the cell potential failure was caused by a loss of mass transport capability of the reactant gases. The cathode side becomes wetted as a result of the water generation occurring in the cathode catalyst layer. Hence, ice formation occurs easily in the components of the cathode, i.e., catalyst layer, GDL, and the flow channel of the separator. These phenomena can clearly lead to interruption of the air supply.
From the above results, it can be seen that the cells failed to start up, because the cell temperature did not rise above 0oC in the constant current mode. In the case of a fuel cell vehicle (FCV), there is required to be a rise in Tcell to 0oC with the only heat being
supplied by the ORR, without external heating. Therefore, it is expected that the ramped current mode is similar to the operation mode of an FCV under cold start conditions [22]. Also, in the recent development of fuel cells, because the thinner Nafion® NRE211 electrolyte membrane has been used to lower the cell resistance, this membrane was applied in experiments of cold start in the ramped current mode.
- 37 -
mode at -5oC and -10oC are shown in Fig. 10 and 11, respectively. Increasing cell temperatures were confirmed in both cells because of the lower cell potentials compared to those for the constant current mode, due to heat generated due to the existence of an overpotential. In practical FCVs, such overpotential heating with a ramped current mode has been used for cold startup [22]. If the cell temperature were able to rise above 0oC, the FCV would be able to start up under the subfreezing conditions. For this purpose, the cell requires the facile removal of the generated water from the GDL in order to prevent an interruption of the air supply.
Both cells succeeded in starting up from -5oC, as shown in Fig. 10(a), and Tcell of the
24BCH-cell and the 25BCH-cell reached 0oC in 780 s and 1065 s, respectively. These experiments were performed at least two times. The operation times at subfreezing temperature were different in each experiment [11, 21]. However the superiority of 24BCH-cell was clearly observed. This result means that the 24BCH material has favorable cold start performance. In this case, the differences in water removal performance between 24BCH and 25BCH affect the cell performance in a way similar to that for operation under high humidify conditions (see Sections 3.4 and 3.5). It is considered that the utilization of the catalyst in the 24BCH-cell was higher, because the air was able to diffuse smoothly from inlet to outlet due to the smaller water droplets than those in the 25BCH-cell. Therefore, the 24BCH-cell was able to operate at higher current than the 25BCH-cell, as shown in Fig. 10(b). In contrast, the water droplets formed in the 25BCH-cell were larger, causing a decrease of catalyst utilization due to blockage of the air supply from inlet to outlet.
Figure 11(a) also shows the time dependences of cell potential and cell temperature in the ramped current mode at -10oC. Both cells failed to start up. A drastic decrease in
- 38 -
the duration of cell operation was observed compared with operation at -5oC. It appeared that a decrease in the gas diffusion network occurred due to rapid ice formation in the catalyst layer caused by the decreasing of cell temperature. As shown in Fig. 11(b), only a few increasing current density steps were possible, and the cell temperature hardly increased.
The relationships between the amounts of water generated at -5 or -10oC and the pore volume of the GDE in the current ramped mode are shown in Fig. 12. The pore volume of the catalyst layer can be calculated from the densities of the Nafion binder and catalyst, which included platinum and carbon support, together with the geometric area and thickness of the catalyst layer.
VCL-pore=VCL (VPt+Vcarbon support+Vbinder) (1)
where VCL-pore, VCL, VPt, Vcarbon support and Vbinder are pore volume of catalyst layer,
geometric volume of catalyst layer, volume of platinum, volume of carbon support and volume of Nafion binder, respectively. The volume expansion of the binder by water absorption was not considered, because the volume change of the binder was estimated to be negligible compared with the pore volume of the electrode. The pore volumes of the GDLs were calculated by reference to the porosity and thickness values that were provided by the manufacturer.
VGDL-pore=VGDL×∅GDL÷100 (2)
- 39 -
of the GDL and the porosity of GDL (%). However, the volume of water was converted to the mass of the liquid phase. The amount of generated water was calculated from the current density and cell operation time by Faraday’s Law. Figure 12 shows that both cells were able to start up from -5oC, even though the amounts of water generated in both cells at -5oC were equal to or larger than the total pore volume of the both anode and cathode GDEs. This is because the generated water was not frozen, due to the increase in the cell temperature, and was thus removed from the cell. In contrast, the amounts of water generated in both cells at -10oC were almost the same as the pore volume of the cathode catalyst layer alone, which was negligible in comparison with the pore volume of the GDEs. This suggests that the blockage of the air supply occurred in the catalyst layer. The differences between the GDLs hardly affected the water removal performance below -10oC.
In this research, the effects of the pore diameter of the GDL on the performance of PEFCs were investigated. The pore diameter of the GDLs affected the performances both during high humidity operation and during startup from subfreezing temperatures. However, it affected hardly the cold startup from below -10oC. It is suggested that for improvement of the performance under such conditions, investigations of other components of the MEA are required, in the catalyst layer, electrocatalyst, membrane, and ionomer binders, for example.
- 40 -
0
0.2
0.4
0.6
0.8
1.0
C
e
ll pot
ent
ia
l
(I
R
i
n
c
luded)
/
V
-5
-4
-3
-2
-1
0
C
e
ll t
e
mperat
ur
e /
oC
0
1000
2000
3000
4000
0
1
2
3
4
5
Oh
m
ic r
e
sista
n
ce
/
cm
2Elapsed time / s
Fig. 2-8. Time dependences of (a) cell potential, (b) temperature and (c) resistance of cell with 24BCH (dashed line) and 25BCH (solid line) at Tcell = -5oC in the constant
current mode.
(a)
(b)
- 41 -
0
0.2
0.4
0.6
0.8
1.0
-30.0
-20.0
-10.0
0
10.0
20.0
Cell potential / V
C
u
rr
e
n
t / A
g
-1Fig. 2-9. Cyclic voltammograms comparing before (dashed line) and after (solid line) cold start tests at Tcell = -5oC.
- 42 -
0
0.2
0.4
0.6
0.8
-5
0
5
10
15
0
1000
2000
0
0.2
0.4
0.6
0.8
Elapsed time / s
Ce
ll p
o
te
n
tia
l
(I
R
i
n
c
luded)
/ V
C
e
ll tem
per
atur
e /
oC
C
u
rr
e
n
t den
s
ity
/ A
c
m
-2Fig. 2-10. Time dependences of (a) the cell potential and temperature and (b) current density with 24BCH (dashed line) and 25BCH (solid line) at Tcell = -5oC in the ramped
current mode.
(a)
Fig. den ram . 2-11. Time nsity with 24 mped current e dependenc 4BCH (dash t mode. ces of (a) th hed line) an - 43 - he cell poten nd 25BCH (s
ntial and tem solid line) a mperature an at Tcell = -10
(b)
(a)
and (b) curre 0oC in the ent- 44 -
Pore volume
Water volume
24BCH 25BCH
-5oC -10oC
GDE (Anode + Cathode) CCL
0
0.01
0.02
0.03
0.04
0.05
0.06
V
o
lu
me of por
e or
generated w
a
ter
/ c
m
3cm
-2Fig. 2-12. Pore volume of gas diffusion electrode and amount of generated water at -5oC until the Tcell increases to 0oC, and at -10oC until cell voltage failure.
- 45 -
2.4. Conclusions
In this research, the effect of the pore diameter of the GDL for PEFC performance, in terms of I-E curves, anti-flooding performance and cold startup from subfreezing temperatures, were investigated. The I-E curves indicated that the 25BCH-cell, with larger pore diameter, showed a higher limiting current than that of the 24BCH-cell, with smaller pore diameter, in the high current density region (over 0.5 A cm-2) at 65oC (100% RH). This result is due to 25BCH having a more effective air diffusion network due to its larger pore diameter.
The cell potential and the differential pressure between inlet and outlet of the 24BCH were more stable than those of the 25BCH-cell gas utilization values greater than Uair = 60%. These phenomena were considered as follows: in the case of the
24BCH-cell, in which the condensed water formed were smaller, the contact area between the air supply and the condensed water in the separator flow channel can be larger than that in the 25BCH-cell. Therefore, the generated water could be removed more easily by vaporization in the case of the 24BCH-cell. In the case of the 25BCH-cell, the condensed water formed larger water droplets on the walls of the flow channel, due to its larger pore diameter. The differential pressure increased as the droplets grew, because the gas flow rate was maintained constant by a mass flow meter. At the upper limit of the differential pressure, the condensed water was easily removed by increased pressure. This phenomenon was observed from the fact that the changes of the cell potential were synchronized with those of the differential pressure.
The 24BCH-cell showed favorable cold start performance in the ramped current mode at -5oC. The cell temperature of the 24BCH-cell reached 0oC more quickly due to the early switching to high current density, because the air was able to diffuse smoothly
- 46 -
from inlet to outlet due to the smaller water droplets.
Both cells failed to start up at -10oC, and no differences in the performance of both cells were observed. The amounts of water generated in both cells at -10oC were negligible in comparison with the pore volume of the GDE but were nearly the same as the pore volume of the cathode catalyst layer. This result indicates that the blockage of the air supply had occurred in the catalyst layer, and the differences between the GDLs hardly affected the water removal performance below -10 oC.
- 47 -
2.5. References for Chapter 2
[1] X. G. Yang , Y. Tabuchi, F. Kagami, C. Y. Wang, Durability of Membrane Electrode Assemblies under Polymer Electrolyte Fuel Cell Cold-Start Cycling, Journal of the Electrochemical Society 155 (2008) B752.
[2] Q. Guo and Z. Qi, Effect of freeze-thaw cycles on the properties and performance of membrane-electrode assemblies, Journal of Power Sources 160 (2006) 1269.
[3] E. A. Cho, J. J. Ko, H. Y. Ha, S. A. Hong, K. Y. Lee, T. W. Lim, I. H. Oh, Characteristics of the PEMFC repetitively brought to temperatures below 0°C, Journal of the Electrochemical Society 150 (2003) A1667.
[4] J. Hou, H. Yu, S. Zhang, S. Sun, H.Wang, B. Yi, P. Ming, Analysis of PEMFC freeze degradation at −20 ◦C after gas purging, Journal of Power Sources 162 (2006) 513. [5] J. Hou, H. Yu, B. Yi, Y. Xiao, H. Wang, S. Sun, P. Ming, Comparative study of PEM fuel cell storage at −20°C after gas purging, Electrochemical and Solid-State Letters 10 (2007) B11
[6] R. Alink, D. Gerteisen, M. Oszcipok, Degradation effects in polymer electrolyte membrane fuel cell stacks by sub-zero operation—An in situ and ex situ analysis Journal of Power Sources 182 (2008) 175
[7] J. Hou, H. Yu, M. Yang, W. Song, Z. Shao, B. Yi, Reversible performance loss induced by sequential failed cold start of PEM fuel cells, International Journal of Hydrogen Energy 36 (2011) 12444
[8] Y. Ishikawa, H. Hamada, M. Uehara, M. Shiozawa, Super-cooled water behavior inside polymer electrolyte fuel cell cross-section below freezing temperature, Journal of Power Sources 179 (2008) 547
- 48 -
freeze-start process – CRYO-SEM investigation, Electrochimica Acta 53 (2008) 5391 [10] S. Ge, C. Y. Wang, Characteristics of subzero startup and water/ice formation on the
catalyst layer in a polymer electrolyte fuel cell, Electrochimica Acta 52 (2007) 4825 [11] P. Oberholzer, P. Boillat, R. Siegrist, R. Perego, A. Kästner, E. Lehmann, G. G. Scherer, A. Wokaun, Cold-start of a PEFC visualized with high resolution dynamic in-plane neutron imaging, Journal of the Electrochemical Society 159 (2012) B235 [12] M. Watanabe, and S. Motoo, Electrocatalysis by ad-atoms Part I. Enhancement of the oxidation of methanol on platinum and palladium by gold ad-atoms, Journal of Electroanalytical Chemistry 60, 259-266 (1975)
[13] M. Watanabe, and S. Motoo, Electrocatalysis by Ad-atoms Part III. Enhancement of the carbon monooxide on platinum by ruthenium ad-atoms, Journal of Electroanalytical Chemistry 60, 275-283 (1975)
[14] M. Uchida, Y. Aoyama, N. Eda, A. Ohta, Investigation of the microstructure in the catalyst layer and effects of both perfluorosulfonate ionomer and PTFE-loaded carbon on the catalyst layer of polymer electrolyte fuel cells, Journal of the Electrochemical Society 142 (1995) 4143
[15] V. A. Paganin, E. A. Ticianelli, E. R. Gonzalez, Development and electrochemical studies of gas diffusion electrodes for polymer electrolyte fuel cells, The Journal of Applied Electrochemistry 26 (1996) 297
[16] J. Chen, T. Matsuura, M. Hori, Novel gas diffusion layer with water management function for PEMFC, Journal of Power Sources 131 (2004) 155
[17] P. M. Wilde, M. Mändle, M. Murata, Structural and physical properties of GDL and GDL/BPP combinations and their influence on PEMFC performance, N. Berg, Fuel