Electrochemical Performances of Ni-based Cermet Anodes for Direct Methane Solid Oxide Fuel Cells
You Hongxin
GRADUATE SCHOOL OF SCIENCE AND TECHNOLOGY HIROSAKI UNIVERSITY
2017
Electrochemical Performances of Ni-based Cermet Anodes for Direct Methane Solid Oxide Fuel Cells
by
You Hongxin
A Dissertation Presented to
the Graduate School of Science and Technology
of the Hirosaki University in partial fulfillment of the requirement for the degree of Doctor of Philosophy in Energy Engineering
HIROSAKI UNIVERSITY
2017
Abstract
Solid Oxide Fuel Cell (SOFC) operates directly with hydrocarbon fuels is widely expected to be an important objective for power generation in the future. However, when hydrocarbon fuels such as methane is directly used as the fuel in an SOFC system, the performance decreases obviously with the susceptibility of conventional Ni-based anodes to carbon deposition. Therefore, it is necessary to investigate the reaction mechanisms of methane on the anode (Chapter 3, 4). Besides, the optimization of nickel based anodes (Chapter 5, 6 and 7) and the development of alternative materials (Chapter 8) is another approach for the direct utilization of hydrocarbon fuels.
In order to investigate the reactions mechanism of dry methane on the Ni-YSZ (or Ni-ScSZ) anode, different concentration of dry methane was used to as fuels. The anode exhaust gases, measured by on-line chromatography, were summarized to analysis the reactions of concentration of dry methane on anodes. And the reaction pathway mathematical relationships between dry methane flux and current for different anode reaction was obtained by analyzing the activation energy of methane elementary reactions. As the oxygen ion concentration at the anode three-phase boundary increasing continuously, the following reactions with low concentration methane occurs in sequence CH4 + O2- → CO + 2H2 + 2e-, CH4 + 2O2- → CO + H2O + H2 +4e-, CH4 + 3O2- → CO +2H2O + 6e-, CH4 + 4O2- → CO2 +2H2O + 8e-, the first two or three reactions occur with intermediate methane concentration, and the first reaction occurs only with high methane concentration, both on Ni-YSZ and Ni-ScSZ anode. The judgment of methane in low, medium or high concentration depends on v(CH4)≤I/(4F) , I/(4F)≤v(CH4)≤I/(2F) , v(CH4)≥I/(2F) respectively, which are based on Faraday's first law and the relationship among reactant species. In addition, the influence of dry methane concentration on the output performance of cell with Ni-ScSZ anode was investigated in Chapter 4. For low concentrations of dry methane, the cell performance degraded rapidly at relative high current density. This phenomenon could be attribute to the production of H2O in transition of reaction, resulting in the increase of p(H2O)/p(CH4) at anode side, as well as the polarization, which caused the anode degradation.
For the direct utilization of hydrocarbon fuels, in Chapter 5, a series of novel NixCu1-x (x = 0.8, 0.5, 0.2) alloy materials were prepared by hard template method using activated carbon fiber (ACF) as template, and a cubic crystal structure were observed. Scanning electron microscope (SEM) showed that NixCu1-x alloy powders with a columnar shape were closely connected with each other to form porous structure. The cells with such NixCu1-x alloy anodes exhibited good performance under methane, and its power density increased with the Ni content in NixCu1-x anode increase, and Ni Cu anode achieved the highest value of 315 mW·cm-2 at 1073 K. Also,
ii
compared with the rapid degradation of conventional Ni-based anode when methane used as fuel, the NixCu1-x anodes showed a stable property after 10 h operation, indicating that the Ni-Cu bimetallic material could effectively inhibit carbon deposition in anode.
Impregnated nanoparticles into porous anode framework are very effective in improving the electrochemical performance of SOFC anodes possibly due to the extension of reaction sites and/or the enhancement of catalytic activity. Thus, in Chapter 6, the tubular YSZ with the stereo structure was firstly prepared by hard template method to form a three dimensionally porous anode framework, and then Ni0.5Cu0.5Ox as catalysts was impregnated into YSZ skeleton to fabricate Ni0.5Cu0.5Ox-YSZ composite anode. YSZ electrolyte-supported single cell with Ni0.5Cu0.5Ox-YSZ anode was fabricated for the power generation performance test and the long-term stability test at 1073 K. The maximum power densities were reached more than 900, 315.52 and 241.77 mW·cm-2 when H2, dry CH4 and wet CH4 (3%H2O) were used as fuel, respectively. The high performance of Ni0.5Cu0.5Ox impregnated tubular YSZ anode demonstrates that the improved performance is mainly attributed to the significantly improved extension of three phase boundary. Moreover, by comparing the results of the 100 h long-term stability tests under dry CH4 and wet CH4 (3%H2O) respectively, the cell with dry CH4 showed an obvious voltage drop of 5.27% but the one with wet CH4 showed the more stable property, indicating that the presence of 3%H2O had an obvious impact on inhibiting carbon deposition on the anode. SEM and EDS results confirmed that the porous anode structure was quite steady, as well as less carbon was formed in the anode using wet CH4 (3%H2O) as fuel after 100 h operation. Therefore, the stereo structure design with YSZ micro tube as skeleton and impregnated Ni0.5Cu0.5Ox as catalyst is indeed an alternative and effective technique to enhance cell performance, stability and reliability for SOFCs.
Ni0.5Cu0.5Ox-YSZ was verified as a potential anode material. However, to further enhance the anode coking resistance for directly using dry CH4, Ce0.8Sm0.2O1.9 (SDC) was adopted to replace YSZ as anode scaffold and Ni0.5Cu0.5Ba0.05Ox was used as the impregnated catalyst to prepare Ni0.5Cu0.5Ba0.05Ox/SDC anode. It is expected to obtain excellent cell performance with high anti-coking property by optimizing the anode composition. In addition, Ni0.5Cu0.5Ba0.05Ox powder was prepared by sol-gel method and then mixed with SDC powder as a comparison anode (Ni0.5Cu0.5Ba0.05Ox-SDC), and the single cells with such two contrastive anodes were fabricated to investigate the anode microstructure effect on the cell performance due to the consistence of the cathode and electrolyte fabricating process. The cell with Ni0.5Cu0.5Ba0.05Ox/SDC anode generated maximum power density of 384.54 mW·cm-2 under dry CH4 at 1073 K, which was higher than that of the Ni0.5Cu0.5Ba0.05Ox-SDC anode of 324.99 mW·cm-2. According to the SEM analysis results, it is inferred that the high performance of Ni0.5Cu0.5Ba0.05Ox/SDC anode could be mainly attributed to the effective covering from Ni0.5Cu0.5Ba0.05Ox particles on the surface of tubular SDC backbone,
as well as a steady and porous stereoscopic structure was formed for gas diffusion, leading to increase TPB. Besides, the cell with Ni0.5Cu0.5Ba0.05Ox/SDC anode showed a good stability for 100 h operation in dry CH4, while the cell with Ni0.5Cu0.5Ba0.05Ox-SDC dropped rapidly after 10 h.
SEM results shows Ni0.5Cu0.5Ba0.05Ox/SDC anode presented a stable structure, suggesting that the fabrication of anti-carbon catalyst combined with three-dimensional electrode is potential measure to enhance durability for direct utilization of dry methane as fuel in SOFCs.
Besides the optimizations of conventional Ni based anodes, developing new alternative materials such as perovskites is another effective approach to avoid carbon deposition. In Chapter 8, SrMoO4 based materials are preliminarily investigated as good candidates for SOFC anodes.
SrMoO4 was synthesized by hard template method, using ACF a template. No observable impurity phases are formed when SrMoO4 mixed and co-fired with YSZ as a potential anode. However, the cell with SrMoO4-YSZ showed a lower electrochemical performance due to its limited catalytic activity, both in H2 and CH4. Gd0.2Ce0.8O1.9 (GDC) was introduced into SrMoO4 by wet impregnation to further improving its potential as SOFC anode materials. The introduction of GDC showed excellent effects of enhancing catalytic activity, resulting in a higher cell performance. In addition, the effects of different composition within YSZ and SrMoO4 and GDC impregnation on the cell performance were further investigated, respectively. When the mass ratio of SrMoO4 to YSZ was 5:5, and the GDC impregnation loading reached an optimal value, 50wt%
(relative to SrMoO4 and YSZ), the cell exhibited a high performance, with a maximum power density of 361.01 mW·cm-2 in dry CH4 at 1073 K.
Table of Contents
Abstract ... i
Table of Contents ... iv
List of Tables... viii
List of Figures ... ix
Chapter 1: Introduction ... 1
1.1 Solid oxide fuel cell... 1
1.1.1 Introduction ... 1
1.1.2 Principle of operation ... 1
1.2 Thermodynamics of SOFC... 2
1.3 Reaction dynamics of SOFC ... 5
1.3.1 Polarization... 5
1.3.2 Activation energy ... 6
1.4 Utilization mode of methane in SOFC ... 8
1.4.1 Reforming of internal methane steam in SOFCs ... 8
1.4.2 CO2 reforming of methane ... 12
1.4.3 Autothermal reforming of methane ... 12
1.4.4 Direct electrochemical oxidation of dry methane in SOFC ... 14
1.5 Analysis method of anode exhausts gas ... 19
1.6 Anode materials... 20
1.6.1 Ni based anode ... 21
1.6.2 Cu based anode... 22
1.6.3 Perovskits anode material... 23
1.6.4 Three phase boundary ... 24
1.7 Motivation and objectives ... 26
1.8 Organization and outline of the thesis ... 26
References ... 28
Chapter 2: Experimental ... 38
2.1 Preparation of anode material ... 38
2.2 Fabrication of single cell ... 39
v
2.4 Experimental set-up... 43
2.5 Characterization ... 46
Chapter 3: The mathematical relationship between dry methane flux and current in the solid oxide fuel cells with Ni-YSZ anode ... 48
3.1 Introduction ... 48
3.2 Experiment ... 49
3.3 Results and discussion ... 50
3.3.1 Electrical performance ... 50
3.3.2 Analysis of outlet gases ... 50
3.3.3 Anode reaction mechanism when dry methane flow rate changes ... 53
3.4 Conclusions ... 56
References ... 56
Chapter 4: Influence of dry methane reactions on the cell output characteristics of solid oxide fuel cells ... 58
4.1 Introduction ... 58
4.2 Experiment ... 59
4.2.1 Single cell preparation ... 59
4.2.2 Cell power test ... 59
4.3 Experimental results and discussion ... 60
4.3.1 Cell power performance ... 60
4.3.2 The anode exhaust gas... 61
4.3.3 Anode reaction ... 63
4.3.4 Reasons for the voltage drop ... 66
4.4 Conclusion ... 67
References ... 68
Chapter 5: NiCu alloy anode material prepared with hard template method ... 70
5.1 Introduction ... 70
5.2 Experimental ... 71
5.2.1 Preparation of NiCu alloy powders using hard template method ... 71
5.2.2 Fabrication of single cell and performance test ... 71
5.2.3 Physical characterizations ... 72
5.3 Results and discussion ... 72
5.3.1 Phase analysis ... 72
5.3.2 Microscopic structure analysis ... 74
5.2.3 The cell performance ... 74
5.3.4 Ten hous stability test ... 75
5.4 Conclusions ... 76
References ... 76
Chapter 6: Fabrication of Ni0.5Cu0.5Ox coated YSZ anode by hard template ... 79
method for solid oxide fuel cells ... 79
6.1 Introduction ... 79
6.2 Experimental ... 80
6.2.1 Preparation of anode materials ... 80
6.2.2 Fabrication and measurement of single cell ... 81
6.3 Results and discussion ... 81
6.3.1 Phase analysis ... 81
6.3.2 Microscopic structure analysis ... 82
6.3.3 Performance test of power generation by single cell ... 83
6.3.4 The influence of moisture on single cell performance ... 84
6.3.5 Long-term stability test ... 85
6.3.6 Analysis of carbon deposition phenomenon for single cell ... 86
6.3.7 SEM and EDS analysis for single cells after experiment ... 87
6.4 Conclusions ... 90
Reference ... 91
Chapter 7: Coking tolerance improvement of Ni0.5Cu0.5Ba0.05 coated SDC composite anode by hard template method for solid oxide fuel cells ... 94
7.1 Introduction ... 94
7.2 Experimental ... 95
7.2.1 Preparation of anode materials ... 95
7.2.2 Fabrication and measurement of single cell ... 96
7.3 Results and discussion ... 97
7.3.1 Characterization of anode material ... 97
7.3.2 Microscopic structure analysis ... 99
7.3.3 Cell performance test ... 99
7.3.4 Long-term stability test ... 101
7.3.5 SEM analysis for single cells after test ... 102
vii
7.4 Conclusion ... 105
Reference ... 105
Chapter 8: Fabrication of composite anode GDC–SrMoO4–YSZ by hard template method for solid oxide fuel cell ... 108
8.1 Introduction ... 108
8.2 Experimental ... 109
8.2.1Sample preparation ... 109
8.2.2 Fabrication of single cells ... 109
8.2.3 Measurement and characterization of single cells ... 110
8.3 Results and discussion ... 110
8.3.1 Phase and microstructure analysis... 110
8.3.2 Cell performance test ... 112
8.3.3 The influence of addictive YSZ on the GDC-SrMoO4-YSZ anode performance ... 113
8.3.4 The influence of GDC impregnation on the SrMoO4-YSZ anode performance ... 114
8.3.5 SEM of tested cell ... 114
8.4 Conclusion ... 115
Reference ... 116
Chapter 9: Conclusions and perspectives ... 118
9.1 Findings and conclusions ... 118
9.2 Future outlook ... 120
List of publications ... 123
List of publications and presentations ... 123
List of papers presented in conferences ... 124
Acknowledgements ... 126
Curriculum Vitae ... 127
List of Tables
Table 1.1 Oxidation reaction mechanism of CH4 over YSZ [15].
Table 1.2 Reactions of methane on the anode
Table 1.3 The ΔH、ΔG and E0 of different reaction at the anode at 1073K and 1273K Table 2.1 Experiment reagents for SOFC
Table 2.2 Experiment equipment for SOFC.
Table 2.3 Chromatography calibration results and error for GC 960
List of Figures
Figure 1.1 Principle of SOFC [4-5]
Figure 1.2 I-V curves representing different polarization during power generation of single cell [8]
Figure 1.3 Oxidation process of CH4 on Ni catalyst [14]
Figure 1.4 The possible paths of methane internal reforming process in SOFC [7]
Figure 1.5 The possible paths of methane indirectly internal reforming process in SOFC [7]
Figure 1.6 The possible paths of methane partial oxidation reforming process in SOFC [7]
Figure 1.7 Three types of geometries for SC-SOFCs [29]
Figure 1.8 Results of K. Kendall’s work. (a) Theoretical OCV for methane, hydrogen and CO oxidation as a function of temperature (b) Comparison of Nernst theory and results for methane and hydrogen with steam [47]
Figure 1.9 Conductivity of cermets as function of nickel concentration of Ni-YSZ cermet at 1000℃
[65]
Figure 1.10 Triple phase boundary structure in the anode [103]
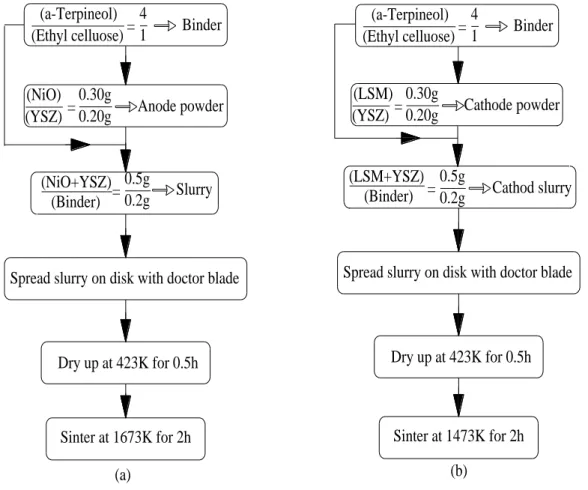
Figure 2.1 The process of NiCu alloy prepared by sol-gel method
Figure 2.2 The process of fiber tubular YSZ prepared by the template method
Figure 2.3 The process of NiCu coated fiber tubular YSZ anode material by hard template.
Figure 2.4 The process of NiCuBaO coated fiber tubular SDC material by hard template method Figure 2.5 The process of GDC-SrMoO4-YSZ composite anode material based on hard template
method.
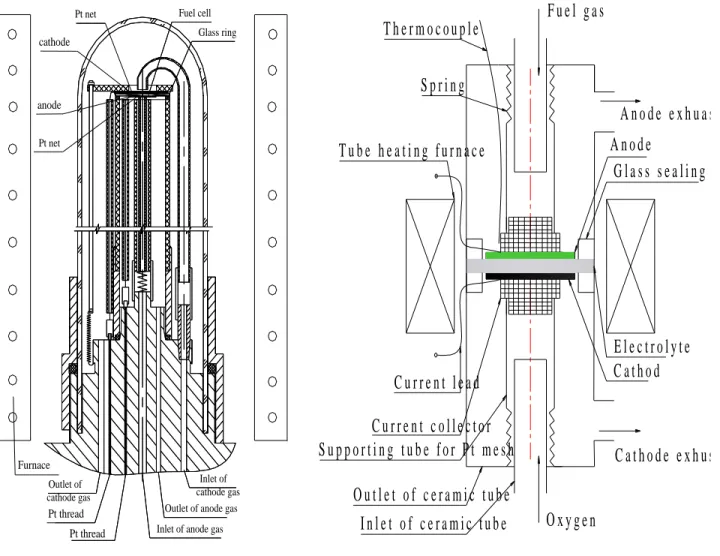
Figure 2.6 The process of Ni-YSZ anode preparation Figure 2.7 A photo for anode of prepared single cell Figure 2.8 The process of LSM cathode preparation Figure 2.9 A photo for cathode of prepared single cell Figure 2.10 Schematic diagram of experimental device
Figure 2.11 Photo of the apparatus for researching reactions at anode of dry Figure 2.12 Photo of the apparatus for studying anode materials
Figure 2.13 Schematic structure of cell reactor for researching reactions at anode of dry methane Figure 2.14 Schematic packaging structure of the fuel cell reactor for studying anode materials
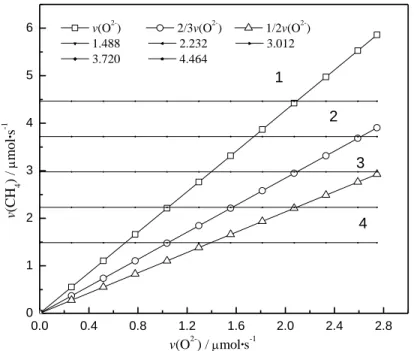
Figure 3.1 I-V and power density characteristics for different CH4 flux on the cell with Ni-YSZ anode at 1273K (a)4.464μmol·s-1 CH4 Ni-YSZ/YSZ(0.5mm)/LSM-YSZ (b) 3.720μmol·s-1, 2.232μmol·s-1 and 1.488μmol·s-1 CH4 Ni-YSZ /YSZ (1mm) / LSM-YSZ.
Figure 3.2 The production rates for different methane flux on the cell with Ni-YSZ anode at 1273K (a) 4.464μmol·s-1 (b) 3.720μmol·s-1 (c) 2.232μmol·s-1 (d) 1.488μmol·s-1.
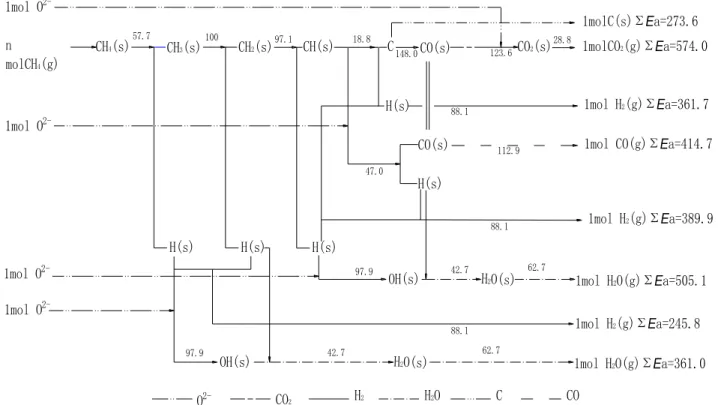
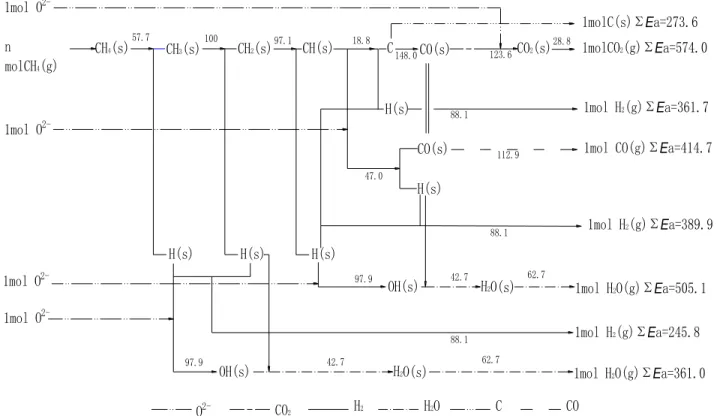
Figure 3.3 The reactions routs of methane at the Ni-YSZ anode.
Figure 3.4 The relationship between v (CH4) and V (O2-)
Figure 4.1 J-V characteristics and power density with different methane concentrations at1273K.
Figure 4.2 Impedance spectra at open for the different methane concentrations at 1273K.
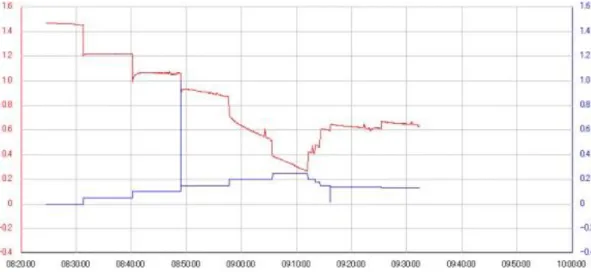
Figure 4.3 The process of power generation of the cell with 7.41% CH4.
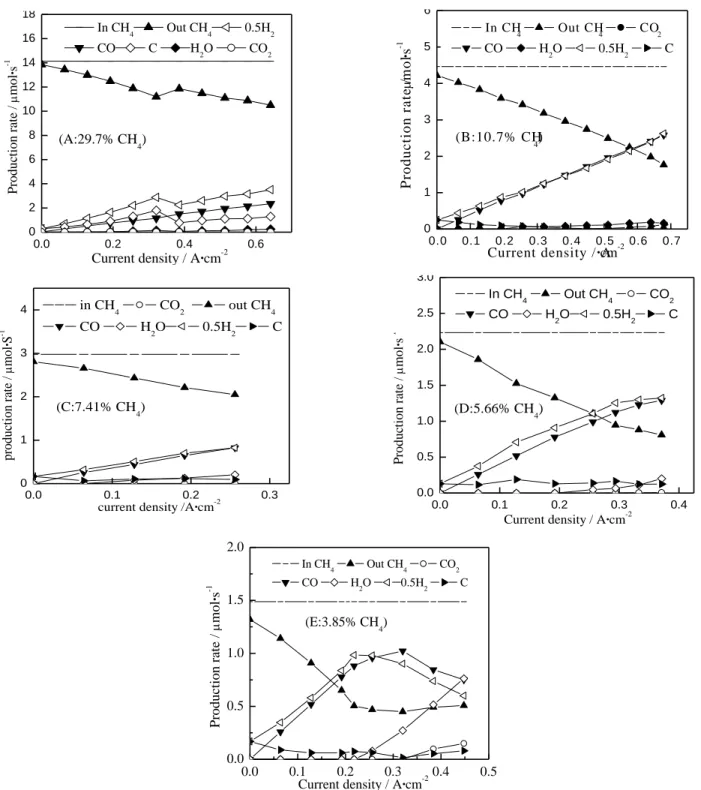
Figure 4.4 The production rates for different methane concentration on the cell with Ni-ScSZ anode at 1273K.
Figure 4.5 The reactions routes of methane at the Ni base anode
Figure 5.1 XRD patterns of NiCu alloys with different Ni/Cu molar ratios calcined at 1773K for 1h.
Figure 5.2 SEM images for NiCu alloy calcined at 1773K for 1h.
Figure 5.3 SEM image for anode surface before reaction and used.
Figure 5.4 SEM for anode surface after the experiment.
Figure 5.5 Current density and power density of the cells with different proportions of NiCu alloy at 1073K.
Figure 5.6 The voltage with time for different anodes.
Figure 6.1 XRD patterns of the composite anode materials before and after reduced by H2 (a) Ni0.5Cu0.5Ox-YSZ; (b) Ni0.5Cu0.5-YSZ.
Figure6.2 SEM images of Ni0.5Cu0.5Ox coated tubular YSZ material.
Figure6.3 The power generating performances of the prepared single cell with H2 fuel.
Figure6.4 The power generating performances of the prepared single cell with the fuel of dry methane.
Figure6.5 The power generation performances of the prepared single cell under wet methane (3%
H2O).
Figure6.6 The voltage change with time for the single cell worked in different fuels.
Figure6.7 Photos of carbon deposition phenomenon on the prepared single cell under different fuels after running for 100 h: (a), (b) dry methane; (c), (d) wet methane (3%H2O).
Figure6.8 Morphologies of surface and cross section of cell with Ni0.5Cu0.5Ox coated tubular YSZ anode after long-term test in dry methane: (a) anode surface; (b) cross section; (c) enlarged view of cross section.
Figure6.9 Morphologies of surface and cross section of cell with Ni0.5Cu0.5Ox coated tubular YSZ anode after long-term test in wet methane for 100 h:(a) anode surface; (b) cross section.
Figure6.10 Energy spectrums of single cell worked in different fuels for 100 h:(a) dry methane; (b) wet methane (3%H2O).
Figure7.1 XRD patterns of the as-prepared anode material with different methods.(a):
Ni0.5Cu0.5Ba0.05Ox; (b): SDC; (c): Ni0.5Cu0.5Ba0.05Ox coating tubular SDC.
Figure7.2 EDS analysis for different anodes of unit cell after experiment.(a):
Ni0.5Cu0.5Ba0.05Ox-SDC;(b): Ni0.5Cu0.5Ba0.05Ox/SDC.
Figure7.3 SEM images of the anode material prepared by different methods. (a): Ni0.5Cu0.5Ba0.05Ox; (b): Ni0.5Cu0.5Ba0.05Ox coating tubular SDC.
Figure7.4 Power generating performances of unit cell with Ni0.5Cu0.5Ba0.05Ox-SDC as anode (a): in hydrogen; (b): in dry methane.
Figure7.5 Power generating performances of unit cell with Ni0.5Cu0.5Ba0.05Ox/SDC as anode (a): in hydrogen; (b): in dry methane.
Figure7.6 Voltage change with time for the as-prepared unit cells.
Figure7.7 SEM images of the different anode surface and cross section after the experiment (a),(b):
Ni0.5Cu0.5Ba0.05Ox-SDC; (c),(d): Ni0.5Cu0.5Ba0.05Ox/ SDC.
Figure7.8 Photos of carbon deposition phenomenon on unit cells with different anodes after running 100 h (a): Ni0.5Cu0.5Ba0.05Ox-SDC; (b): Ni0.5Cu0.5Ba0.05Ox/SDC.
Figure7.9 EDS analysis results of different unit cells after long-term stability test :( a) Ni0.5Cu0.5Ba0.05Ox-SDC; (b) Ni0.5Cu0.5Ba0.05Ox/SDC.
Figure8.1 XRD patterns of SrMoO4 powder (a); standard PDF card of SrMoO4 (b); SrMoO4-YSZ (c); SrMoO3-YSZ (d)
Figure8.2 SEM images of composite anode material prepared by hard template method :(a) SrMoO4
powder ; (b) SrMoO4-YSZ powder impregnated by GDC.
Figure8.3 The generating performances of SOFC fed in hydrogen (a) or methane (b) with 50wt%GDC impregnated SrMoO4-YSZ at 1273K
Figure8.4 The generating performances of SOFC fed in hydrogen (a) or methane (b) with different mass ratio of GDC impregnated SrMoO4-YSZ at 1273K
Figure8.5 SEM images of anode after test (a) anode surface microstructure of single cell; (b) cross-sectional microstructure of single cell
Chapter 1
Introduction
1.1 Solid oxide fuel cell 1.1.1 Introduction
Fuel cell is a power device that can convert chemical energy into electric power through direct electric catalytic oxidation of a fuel with an oxidant. Compared with the conventional battery device, it can utilize the continuous fuel supplied from external to generate electricity within the fuel cell, and it is not limited by Carnot cycle. Its invention is attributing to Grove knight and named by Mond and Langer. The common fuel cells include five types as follows: Alkaline Fuel Cell (AFC), Phosphorous Acid Fuel Cell (PAFC), Molten Carbonate Fuel Cell (MCFC), Proton Exchange Membrane (PEMFC), and Solid Oxide Fuel Cell (SOFC). Among them, SOFC as a solid state power device have attracted more and more attention due to its high electrical efficiency, low emissions, wide fuel flexibility and low manufacture cost. According to the configuration structure, cells are being fabricated in many different configurations, such as planar cells [1], tubular cells [2] or flat-plates cells [3].
1.1.2 Principle of operation
Similar to the conventional fuel cell, a SOFC is constructed with a sandwich structure mainly consisted of three parts: anode, electrolyte and cathode [4-5]. Fig. 1.1 shows the typical schematic diagram of SOFC.
At cathode side, the oxidant (oxygen or ambient air) is supplied and the oxygen is absorbed on the cathode. Then, oxygen was reduced and obtained two electrons from an external circuit to form oxygen ions. Meanwhile, fuel is oxidized at the anode. The overall reaction of oxygen at cathode is as follows.
1/2O2+2e- →O2- (1.1) The generated oxide ions, driven by the difference in oxygen activity of the two gases at the electrodes, transported to the anode side through the ceramic electrolyte. At the anode side, the oxygen ions combined with fuel such as hydrogen at the three phase boundary composed of
through external connections and back to the cathode. As such, the total circuit was completed and electrical energy was generated. The overall reaction of H2 at anode is as follows.
Electrolyte Anode
Cathode
e-
e-
-
+
Air (Oxygen) Fuel gas
O2+4e- 2O2- H2+O2- H2O+2e-
Load
O2- O2- O2-
Fig 1.1 Principle of SOFC [4-5]
O2-+H2→H2O+2e- (1.2) However, for CH4 used as fuel, the reaction mechanism at anode is significantly different from H2
as fuel. Abuliti [6] fabricated the single cell consisting of Ni-YSZ anode and used different concentrations (flux) dry CH4 as fuel research to investigate the reactions at anode by measuring the anode exhausted gases combined with comparing the electron number of anode exhaust gas and the need of generated current. Following reactions occur at anode.
CH4→2H2+C (1.3) C + O2-→CO+2e- (1.4) CH4 + 4O2-→CO2+ 2H2O + 8e- (1.5) That is CH4 was firstly decomposed C at anode; At low current density, the generated C in three phase boundary was reacted with the oxygen ions to form CO, and the partial oxidation reaction of CH4 was happened; At high current density, CH4 was reacted and formed CO2 and H2O, and the complete oxidation reaction of CH4 was occurred.
1.2 Thermodynamics of SOFC
SOFC provides a reaction zone in which the chemical energy can convert electrical energy. In a SOFC system, thermodynamics is not only related to the output, but also determine the occurrence of a chemical reaction. The system energy state function is enthalpy in thermodynamics [5, 7-8], commonly represented with symbol H.
H = U + p·V (1.6)
where, U is the system internal energy, p is system pressure and V is system volume.
Entropy is another thermodynamic state function, which represents the uncertainty of a system. A chemical reaction whether occur or not is judged in two possible conditions. One is that system enthalpy H decreases, i.e. ΔH <0. Another is that entropy S increases, i.e. ΔS >0.
Besides, another state function, the Gibbs energy, represents the chemical reaction driving force, is given by the expressions:
G = H-T·S (1.7) where, T is the temperature.
ΔG is defined as the Gibbs free energy change of a reaction in Equation [1.8].
ΔG = ΔH-T·ΔS (1.8) It can be inferred that Gibbs free energy change ΔG couples the system enthalpy and entropy change.
Therefore, the positive and negative of ΔG can be used to judge whether a reaction occur spontaneously or not.
The reaction can occur spontaneously when ΔG < 0. Electric power can be extracted from the reaction.
The reaction can not occur spontaneously when ΔG > 0. Reverse reaction occur spontaneously.
When ΔG = 0, the positive reaction is equilibrated with the reverse reaction, and the electric power can not be extracted from the reaction.
The Gibbs free energy change of a reaction will be fully converted into electrical power in a fuel cell system with redox reaction. The intrinsic relationship between the Gibbs energy change△G and the electromotive force E is
nFE G
(1.9) where, n is the unleashed number of free electrons when the fuel with oxygen-ion take place electrochemical catalytic reaction at the anode; F is the Faraday constant. △G and E can be replaced by △G0 and E0 respectively under standard conditions.
0
0 nFE
G
(1.10) The electromotive force is affected by temperature, pressure, and material activity.
The chemical potential of vi is introduced for i components involved in a reaction. Chemical potential reflects the change in Gibbs free energy as the chemical properties of the system varies. Each chemical reaction system has a chemical potential. Each substance in reaction system has a chemical
i
m j
G
,n
,P i T
i (1.11) where, mi is the number of moles of i component. (∂G/∂ni)T,P,nj≠i represents the change of Gibbs free energy when i substance has an infinitely small increase. When changing the amount of chemical substances in the fuel cell, the free energy of the system will be changed, thus affecting the electromotive force.
The i substance chemical potential is associated with the concentration of i substance by activity of αi .
i 0
i
i RTln
(1.12) where,i0 is the chemical potential of i substance in standard state.
Material activity is determined by its chemical properties. If all the gases are ideal gases in electrode chamber, then the activity of i gas αi is related to pressure pi and p0, which is given by expression
αi= pi / p0 (1.13) where, pi is the partial pressure of i gas, p0 is the standard state pressure (atmospheric pressure at 298K, which is 101.325kPa).
A chemical reaction,such as
aA + bB ↔ cC + dD (1.14) where, A and B is reactant, C and D is reaction product. a, b, c, d is the number moles of A, B, C, D respectively. Equation (1.15) shows that △G can be calculated by the chemical potential of reactants and products
bB 1 A c 0 C
B 0 A 0
D 0
C d a b R ln
c
T Dd
G
(1.15) Chemical potential at standard state is represented by the free energy change in the standard state
△G0. So it can be inferred that
b B a A
d D c 0 C
ln
R
T G G
(1.16) Using the relationship between Gibbs free energy change and the electromotive force, the Nernst equation for reaction is obtained.
c d
0 C D
1 b
A B
RT ln
E E
nF
(1.17)
This equation is one of the cores for fuel cell thermodynamics, which represents the relationship of electromotive force with materials in the fuel cell reaction at a certain temperature.
Equation (1.17) is substituted into equation (1.10) and (1.13) to give the reaction electromotive force at any temperature and pressure for calculation equation (1.18).
0 b
B a 0 A
d 0 D c 0 C 0
) / ( ) / (
) / ( ) / ln (
p p p p
p p p p nF RT nF E G
(1.18)
1.3 Reaction dynamics of SOFC
Thermodynamics in SOFC can be viewed as an extreme case of chemical kinetics while time approximating to an infinite equilibrium state. Thermodynamics of a cell is a case where a cell is in equilibrium. Electrodynamic potential obtained for a cell is maximum electrodynamic potential from a theoretic perspective, also an extreme case where no current exists.
Without presence of current, SOFC as a generating device is meaningless. When a current exists, the electrochemical reaction occurs inside a cell, which leads to transmission of electrons in circuits.
As the transmission is driven by power, thus polarization happens.
1.3.1 Polarization
When current passes through electrode, the electrode potential of a cell deviates from equilibrium potential, thus polarization is generated. Resistance during electrochemical reaction is the main reason for polarization, and energy consumption is needed to overcome the resistance, leading to loss of voltage.
Dependent on different reasons for polarization, types of polarization to be defined vary, mainly including activation polarization, ohmic polarization and concentration polarization.
i) Activation Polarization
In essence, electrochemical reaction is a process of reactant receiving or losing electrons, during which corresponding resistance must be overcome. This resistance is called activation energy, and the polarization resulting from activation energy is called activation polarization. Different activation energies lead to different electrochemical reactions.
ii) Ohmic Polarization
Ohmic polarization is resulted from such internal resistance as ionic conduction resistance of electrolyte and resistance of electron conduction on anode.
iii) Concentration Polarization
unavoidable process for polarization. If there is current passing by the substance flow surrounding electrode changes when compared with its original flow, which leads to deviation of electrode potential. The concentration polarization is resulted from hindrance of material migration and transformation of chemical reaction.
Concentration polarization relates double electrode layers inside the cell, which is divided into compact layer and dispersion layer. When both electrode surface charge density and reaction medium concentration are small, the electrostatic energy inside the double electrode layer is far less than ionic energy of thermal motion; when both electrode surface charge density and reaction medium concentration are large, the electrostatic energy inside the double electrode layer is far more than ionic energy of thermal motion. The ratio of potential difference in dispersion layer in total potential difference is increasingly smaller.
I-V curve representing different polarization during power generation of single cell is shown in Fig.1.2 [8].
0 200 400 600 800 1000
0 0.2 0.4 0.6 0.8 1.0 1.2
Fuel cell current/mA.cm-2
Fuel cell voltage / V
Theoretical open circuit voltage
Activation Polarization Ohmic Polarization
Concentration Polarization
Fig.1.2 I-V curve representing different polarization during power generation of single cell [8]
1.3.2 Activation energy
Chemical Reaction Kinetics discusses chemical reaction rate and reaction mechanism, with its research object including elementary reaction. In chemical reaction kinetics, reaction mode and activation energy are research hotspots.
Judgment on whether reactions are spontaneous is from the ΔG perspective of thermodynamics, while dynamic hindrance must be overcome in many reactions of thermodynamic energy. Therefore, Ryan [9] considered it is necessary to consider thermodynamics and dynamics of reactions as a whole.
Under the condition that what sorts of reaction of methane happening on SOFC anode are unknown, it is difficult to carry out thermodynamic analysis.
According to the collision of reaction theory, in order to enable reaction, reaction particles or free radicals must collide with each other, and reaction occurs only when collision takes place [10]. Aside from collision, no reaction takes place unless reaction particles or free radicals are provided with an energy called activation energy. Out of two comparable reactions, the one with less activation energy is liable to take place [11]. According to the transition state theory of reaction kinetics, when activated molecules of reactants collide with each other, it is necessary to generate an activated complex that has a state potential energy higher than primary and final state potential energies, followed by a transition state that is to be decomposed into intermediates or products.
Zhang [12] believed that the basic law of energy change has to be abided by in every procedure of organic reaction accompanied with change of energy, although types of organic reaction vary. While determining the direction of chemical reaction, the lowest energy principle is a compulsory condition of energy to be followed. As for complicated reaction processes, analyzing the activation energy in every step of reaction is a key to clarification of reaction pathway.
The decomposition process of methane on catalyst Ni is [13]:
CH4 → CH3(ads) + H (ads) (1.19a) CH3 (ads) → CH2 (ads) + H (ads) (1.19b) CH2 (ads) → CH (ads) + H (ads) (1.19c) CH (ads) → C (ads) + H (ads) (1.19d) Main paths to generate CO and CO2 through the reaction of CH4/O2 on catalyst Ni are shown in Fig.1.3 [14], where the subscript s represents solid phase and g represents gas phase.
O
4, ,
O
2, 2,
CH CH CO CO
CO CO
S
S
g x s s g
s g
Fig. 1.3 Oxidation process of CH4 on Ni catalyst [14]
Wu [14] studied the mechanism of partial oxidation reaction of methane on catalyst Ni using the bond-order conservation method. In the partial oxidation reaction of methane, CH oxidizing reaction is a main path to generate CO, while deep oxidation of CO will generate CO2. Thermodynamic comparison of the activation energy of 148KJ·mol-1 for CO generated from C + O and the activation energy of 47 KJ·mol-1 for CO generated from CH + O shows CH is easier than C to be oxidized for generation of CO.
The reaction mechanism of hydrocarbon on Ni-YSZ is shown in Tab. 1.1 [15]. The mechanism initially developed and used for verification of the steam assisted oxidation of methane. Out of 42
which reaction rate goes by equation Arrhenius and viscosity coefficient. Activation energies of reactions 12, 20, 21 & 23 shown in Tab. 1.1 are to be calculated with CO(s) coverage rate θco(s) based on the following formula:
RT RT
AT E
k bexp exp CO(s)CO(s)
(1.20) Wherein, k stands for reaction rate constant, A for prefactor, also the constant (frequency factor) of collision with reactant molecule, T for temperature, E for activation energy, R for gas constant, b for times exponents, εCO (s) for mole internal energy of CO molecule.
Thermodynamic analysis helps determine whether a reaction takes place, polarization analysis of reaction kinetics states that it is inevitable for output voltage drops with the increase of current density during cell operation, and the activation energy in reaction kinetics is a key to understand anode reaction mechanism. Reactions in SOFC are different from conventional chemical reactions where no formation and transmission of oxygen anion is involved, while reactions on anode in SOFC relates to not only quantity of methane but also quantity delivered of O2-, resulting in difficulties to identify anodic reaction mechanisms.
1.4 Utilization mode of methane in SOFC
H2 is an optimal fuel for SOFC. However, about 96% of hydrogen is produced from such hydrocarbon fuels as natural gas by steam-reforming reaction. Therefore, extensive researches were conducted on substituting hydrocarbon gas (such as methane) for hydrogen as a SOFC fuel, which can significantly reduce system complexity, energy costs and increase cell efficiency.
Dependent on types of anodic reaction, the utilization modes of methane in SOFC mainly include Steam Reforming, Dry Reforming of Methane, Partial Oxidation Reforming, and Direct Electrochemical Oxidation.
1.4.1 Reforming of internal methane steam in SOFCs
The mixture of methane and water steam can take place the reaction of reforming of methane, which is given by the expressions.
CH4 + H2O → CO + 3H2. (1.21) After being simultaneously introduced into cell anode, methane and water steam are reformed. This utilization mode of methane is called internal reforming of methane. If surplus water steam is exposed to the internal reforming reaction, the shift reaction,
CO+H2O → CO2+H2 (1.22) may happen.
Tab1.1 Oxidation reaction mechanism of CH4 over Ni- YSZ [15]
Reaction A B E/ KJ·mol-1
1 2 3 4 5 6 7 8 9 10 11 12 13 14 15 16 17 18 19 20 21 22 23 24 25 26 27 28 29 30 31 32 33 34 35 36 37 38 39 40 41
H2 + Ni(s) + Ni(s)→H(s) + H(s) H(s) + H(s)→Ni(s) + Ni(s) + H2
O2 + Ni(s) + Ni(s)→O(s) + O(s) O(s) + O(s) →Ni(s) + Ni(s) + O2
CH4 + Ni(s) →CH4(s) CH4(s) → Ni(s) + CH4
H2O + Ni(s) →H2O(s) H2O(s) → Ni(s) + H2O CO2 + Ni(s) → CO2(s) CO2(s) →Ni(s) + CO2
CO + Ni(s) →CO(s) CO(s) →Ni(s) + CO
O(s) + H(s) →OH(s) + Ni(s) OH(s) + Ni(s) → O(s) + H(s) OH(s) + H(s) →H2O(s) + Ni(s) H2O(s) + Ni(s) →OH(s) + H(s) OH(s) + OH(s) →O(s) + H2O(s) O(s) + H2O(s) →OH(s) + OH(s) O(s) + C(s) →CO(s) + Ni(s) CO(s) + Ni(s) →O(s) + C(s) O(s) + CO(s) →CO2(s) + Ni(s) CO2(s) + Ni(s) → O(s) + CO(s) HCO(s) + Ni(s) → CO(s) + H(s) CO(s) + H(s) →HCO(s) + Ni(s) HCO(s) + Ni(s) →O(s) + CH(s) O(s) + CH(s) →HCO(s) + Ni(s) CH4(s) + Ni(s) →CH3(s) + H(s) CH3(s) + H(s) →CH4(s) + Ni(s) CH3(s) + Ni(s) →CH2(s) + H(s) CH2(s) + H(s) →CH3(s) + Ni(s) CH2(s) + Ni(s) →CH(s) + H(s) CH(s) + H(s) →CH2(s) + Ni(s) CH(s) + Ni(s) →C(s) + H(s) C(s) + H(s) →CH(s) + Ni(s) O(s) + CH4(s) →CH3(s) + OH(s) CH3(s) + OH(s) →O(s) + CH4(s) O(s) + CH3(s) →CH2(s) + OH(s) CH2(s) + OH(s) →O(s) + CH3(s) O(s) + CH2(s) →CH(s) + OH(s) CH(s) + OH(s) →O(s) + CH2(s) O(s) + CH(s) →C(s) + OH(s)
1.000x10-02 5.593x10+19 1.000x10-02 2.508x10+23 8.000x10-03 5.302x10+15 1.000x10-01 4.579x10+12 1.000x10-05 9.334x10+07 5.000x10-01 4.041x10+11
CO(S) 5.000x10+22 2.005x10+21 3.000x10+20 2.175x10+21 3.000x10+21 5.423x10+23 5.200x10+23 1.418x10+22
CO(S) 2.000x10+19
CO(S) 3.214x10+23 3.700x10+21
CO(S) 2.338x10+20 3.700x10+24 7.914x10+20 3.700x10+21 4.438x10+21 3.700x10+24 9.513x10+22 3.700x10+24 3.008x10+24 3.700x10+21 4.400x10+22 1.700x10+24 8.178x10+22 3.700x10+24 3.815x10+21 3.700x10+24 1.206x10+23
+21
0.0 0.0 0.0 0.0 0.0 0.0 0.0 0.0 0.0 0.0 0.0 0.0 0.0 0.0 0.0 0.0 0.0 0.0 0.0 -3.0 0.0 -1.0 0.0 -1.0 -3.0 0.0 0.0 0.0 0.0 0.0 0.0 0.0 0.0 0.0 0.0 0.0 0.0 0.0 0.0 0.0 0.0
0.00 88.12 0.00 470.39 0.00 33.15 0.00 62.68 0.00 28.80 0.00 112.85 -50.0 97.90 37.19 42.70 91.36 100.00 209.37 148.10 115.97 -50.0 123.60 -50.0 86.50 0.00 -50.0 127.98 95.80 114.22 57.70 58.83 100.00 52.58 97.10 76.43 18.80 160.49 88.30 28.72 130.10 21.97 126.80 45.42 48.10
H2 and CO was electrochemical oxidized generated from on anode, as well as power generation occurs. Among the reactions on anode, water steam reforming reaction (1.21) and reaction (1.22) are chemical reactions, in which fuel gases convert.
Electrochemical oxidation of methane is an ideal choice, but carbon deposition may undermine cell performance by reducing anode activity. A gas mixture such as H2 and CO resulted from methane reforming is an effective measure to restrain carbon deposition. Here below are two major modes of methane reforming:
i) External reforming refers to the process that the gas mixture of CO and H2 resulted from methane reacting with water steam outside the cell enters the SOFC for power generation. This may prevent anode carbon deposition from happening, but needs investment in external reforming device with complicated process.
ii) Internal reforming refers to that two processes such as reforming conversion and electrochemical oxidation are simultaneously completed on anode surface after methane and water steam are directly input into SOFC in high-temperature running so as to remove external reformer and simplify the system. This is an important topic for current SOFC research. Some researchers adopted the anodic gas circulation method [16] and the progressive methane steam reforming method [17] to add a certain amount of water steam into methane as a fuel gas.
Fig.1.4 and Fig.1.5 show possible paths in the methane reforming process in SOFC [7]. In a direct reforming process, anode functions in catalyzing conversion of hydrocarbon fuel into H2 and CO, H2
and CO oxidized into H2O and CO2 by electro-catalyzing and electric and ion conduction.
CH4+H2O Anode CO+H2 Anode+O2- CO2+H2O+Energy
C+H2 H2O+Energy
Carbon deposition Anode+O2-
Fig.1.4 The possible paths of methane internal reforming process in SOFC [7]
CH4+Excessive H2O(g) Internal reformer CO+H2 Anode+O2- CO2+H2O+Energy
CO2+H2 CO2+H2O+Energy Anode+O2-
+H
2O
Fig.1.5 The possible paths of methane indirectly internal reforming process in SOFC [7]
Reforming of methane steam inside the cell has the following advantages:
i) Good cooling effect on cell is brought about by endothermal reaction of reform;
ii) High thermodynamic efficiency of steam reform approximates to that of direct oxidation of methane;
iii) No need of external reformer reduces investment and simplifies the system.
Methane steam reforming reaction and its kinetic behavior is another topic of SOFC research.
Methane steam reforming is an extremely complicated process, which not only involves mass transfer of reactants and resultants on catalyst surface and inside catalyst, but also involves many parallel reactions, particular electrochemical reactions.
General studies focus on the internal reforming process in SOFC under the condition of methane added with small amount of water steam. An earlier study on internal reforming in SOFC was carried out by Murray [18], who concluded that the performance of cell is basically similar with that of dry methane by conducting a test with 3%H2O+97% CH4 on composite anode Ni-YSZ/YDC; following steady cell running at earlier 100h, cell performance is unsteady at lower voltage due to anode deactivation. In a relevant study conducted by Kawano [19], the cell performance of 97%CH4+ 3%H2O as a fuel for SOFC was tested on different anodes.
Anode is provided with two reaction functions, namely methane steam reforming and electrochemical oxidation of hydrogen in sequence. Theoretically, different anode materials (catalysts) may be selected based on different anodic functions so that selection scope of anode materials could be widened. While selecting anode materials, it is required to follow the principle that under the condition that the fuel mixture contains no water, carbon deposition on anode shall not undermine its catalytic activity. Research shows that anode Ru/LaCrO3 [20] has a good catalytic performance, methane is almost completely converted and no carbon deposited even after 100 h operation under the condition of 973k and the ratio of n(Steam): n(CH4) less than 1.
Electrochemical oxidation of CO may be disregarded [21-22], as compared with it, electrochemical oxidation of hydrogen is faster, and most CO can be converted into CO2 and H2 through the water gas shift reaction CO+ H2O →CO2+ H2.In practice, a small amount of steam and methane are required to mix them up at beginning to push forward subsequent reactions. That is the reason why a small amount of water is added into the methane fuel for SOFC [16, 23], and the reason why circulation of anodic gas and progressive methane steam reforming are adopted [17].
Carbon deposits cannot be completely removed by adding a small amount of water steam into methane as a fuel gas, the practice of which is helpful for steam reforming reaction. Kawano [19] and
deposits on cell anode, because of O2− reacting with C and CH4, or H2O generated electrochemically on anode reacts with C or CH4.
1.4.2 CO2 reforming of methane
CO2 Reforming of methane is also called dry reforming of methane. The process of preparation of mixture gas through CH4-CO2 reforming is an effective path to utilization of CH4 and CO2. In this process, the ratio of H2/CO is about 1 in mixture gas, and H2/CO can be directly used as raw materials for carbonyl synthesis and the Fischer-Tropsch reaction. The CO2 reforming reaction is
CH4 + CO2 → 2CO + 2H2 (1.23) CH4 +2CO2 → 3CO +H2+ H2O (1.24) Internal methane reforming and dry reforming of methane with reaction time of several seconds is a slower reaction relative to electrochemical reaction [25].
Belyaev [26] investigated CO2 reforming of CH4 on the Pt|0.9ZrO2+ 0.1Y2O3|Pt+PrO2-X cell by using CH4 and CO2 as fuels to generate mixture gas. Taking effect of current into account, the experiment concluded that under the condition of CO2/CH4≈6.7 at 1073K, the percentage of CO and H2 reduces as current rises.
The heat of CO2 reforming reaction of methane reaches 247kJ·mol-1 at 1073K and internal thermal equilibrium also exists in this strongly endothermic reaction similar with internal reforming of methane. Carbon deposition is a major disadvantage existing during CO2 reforming. Although CO2
functions in removing carbon deposits and moderate amount of CO2 may relieve inactivation of carbon deposit on anode, sustaining steady operation of cells, the cell performance will, after every carbon deposition-carbon removal process, not restore to the status prior to carbon deposition; and carbon deposition will, after every carbon deposition-carbon removal process, be easier than ever before [27].
1.4.3 Autothermal reforming of methane
Combining advantages of both processes of conventional steam reforming reaction and partial oxidation, autothermal reforming is a process synchronizing partial oxidation of methane and its electrochemical reaction and performing integrated energy matching.
Hibino[28] is an earlier researcher putting forward the concept of single-chamber solid oxide fuel cells (SC-SOFC), the Ni-YSZ/YSZ/Au cell is introduced with a mixture gas of methane and oxygen at the mole ratio of 2:1 at 1223k, and open-circuit voltage of 350mV and the maximum power density of 2.3 mW·cm-2 are obtained.
Singhal [7] believed that three reaction paths may exist for methane and oxygen in SOFC during autothermal reforming, as shown in Fig.1.6.
CH4+O2
CO+H2 +O2- CO2+H2O+Energy
C+H2 H2O+Energy
+O2- CO2+H2O
Carbon deposition
Fig. 1.6 The possible paths of methane partial oxidation reforming process in SOFC [7]
Yano [29] summarized the advance of single-cell autothermal reforming and the geometry of single cell subject to three autothermal reforming processes is shown in Fig.1.7. When methane is used as fuel gas, H2 and CO are generated from exothermal partial oxidation of methane occurred on anode of single cell, O2- that is transmitted via electrolyte reacts with H2 and CO to generate H2O and CO2.
Fig. 1.7 Three types of geometries for SC-SOFCs [29]
Heinzel [30] conducted a research on the autothermal reforming of methane process, and performed a comparative analysis on steam reforming and autothermal reforming. Based on experiment and calculation of thermodynamic equilibrium, Heinzel found that under the experimental condition of 1atm and 973K, the outlet gas composition during steam reforming and autothermal reforming approximates to thermodynamic equilibrium, and maximum H2 and CO flow is achieved. 80% H2
flow is for the steam reforming process and 30% H2 flow for the autothermal reforming process.
Making a single cell by combining 4 conventional NiO-YSZ/YSZ/LSM/ cells and taking CH4 as fuel at 1023K, Wei [31] measured the cell power of 421 mW.
Although the autothermal reforming single cell has advantages of simple structure, fast start speed and no need of sealing material, its power generation performance is affected by many factors, including inlet flow, proportion of inlet mixture in addition to electrode and electrolyte materials.
Difference between the partial oxidation and reforming process and direct electrochemical oxidation of methane is detailed as follows:
i) In the partial oxidation and reforming process, O2 reacts with methane, the process of which is a chemical reaction; while in the direct electrochemical oxidation of methane process, O2- (from cathodic O2) reacts with methane, the process of which is an electrochemical reaction.
ii) No electric energy is generated from the partial oxidation and reforming process, but its reactants such as H2 and CO can further react with O2- electrochemically, with current generated;
while in the direct electrochemical oxidation of methane process, methane directly reacts with O2- electrochemically, with current generated.
With oxygen and methane that undergo the autothermal reforming process entering into the cell, the lower explosion limit of methane in air is 5.3% and its upper limit is 14% [32], the above limits of which must be avoided, and higher requirements on leak proofness of cells and cell stacks in real applications and tests. Moreover, proper matching of methane and oxygen is very important for the partial oxidation and reforming process. According to analysis as shown in Fig.1.6, existence of some oxygen after partial oxidation and reforming of methane is necessary for the reformed gas to continue its electrochemical oxidation.
1.4.4 Direct electrochemical oxidation of dry methane in SOFC
As for direct electrochemical catalysis and oxidation of dry methane, different researchers found multiple reactions occurring on anode. Aside from the electrochemical reaction in which dry methane reacts with O2- on the cell anode, dry methane could also react with coexist gases. Tab. 1.2 is electrochemical and chemical reactions for methane in the cell anode, in which methane reacts with O2- on anode: partial oxidation reaction in which methane reacts with O2- to generate CO and H2 and release electrons [6,33], complete oxidation reaction in which methane reacts with O2- to generate CO2
and H2O and release electrons [6,33-34], carbon deposition reactions [35], including the reaction (1.3), the reaction (1.25) and the reaction (1.26).
2CO → C + CO2 (1.25) CO + H2 → C + H2O (1.26) The reaction of methane on the cell anode is closely related with such factors as methane flow, transfer rate of O2- and reaction temperature.
i) Reaction
Taking the Pt/YSZ/Pt cell as the research object, Ma [36] conducted a research on direct electrochemical oxidation of methane in SOFC. Dependent on operating temperature and reaction airspeed of the cell, multiple reaction mechanisms exist in the oxidation process of methane on anode.
The reaction of methane in SOFC is a partial oxidation instead of complete oxidation. With the increase of reaction airspeed, the conversion quantity of methane and production of H2 and CO tend to drop down and go steady. Gas composition analysis shows that carbon imbalance exists before and after the reaction and carbon deposition occurs on anode.
Tab.1.2 Reactions of methane on the anode The anode reactions
Electrochemical reactions
CH4 + O2- → CO + 2H2 + 2e-
CH4 + 2O2- → CO + H2O + H2 + 4e- [33]
CH4 + 3O2- → CO + 2H2O + 6e- [37-39]
CH4 + 4O2- → CO2 +2H2O + 8e- [6,33-34]
H2 + O2- → H2O + 2e- [34,40]
CO + O2- → CO2 + 2e- [40-41]
C + O2- → CO + 2e- [40-41]
Chemical reactions
CH4 → C + 2H2 [6,42]
CH4 + H2O → CO + 3H2 [34,40]
CO + H2O → CO2 + H2 [43]
CH4 + CO2 → 2CO + 2H2 [18]
2CO → C + CO [44]
C + H2O → CO + H2 [45]
Possibility of reactions should be taken into account for direct oxidation of methane. According to thermodynamic data of relevant reactions shown in Tab. 1.3, which is calculated by the software of Hsc and the Nernst equation, Gibbs energy changes of 4 oxidation reactions of methane are negative, and these 4 reactions are spontaneous.
With the increase of the proportion of O2- in reaction, electromotive force E0 gradually reduces. In a power-generating test, with the gradual increase of current, the number of O2- increases and the initial electromotive force of the cell decreases; and the test voltage suddenly drops down as abrupt transition of reaction happens. As shown in Tab. 1.3, maximum change occurs in electromotive force when the reaction CH4 + 1/2O2 → CO + 2H2 transits toward the reaction CH4 + O2 → CO + H2O + H2; while smaller change occurs in electromotive force when transition occurs between other reactions; furthermore, the decline amplitude of electromotive force, which is caused during transition
![Fig. 1.9 Conductivity of cermets as function of nickel concentration of Ni-YSZ cermet at 1273K [65]](https://thumb-ap.123doks.com/thumbv2/123deta/5923892.2055572/37.918.353.586.539.818/fig-conductivity-cermets-function-nickel-concentration-ysz-cermet.webp)