†
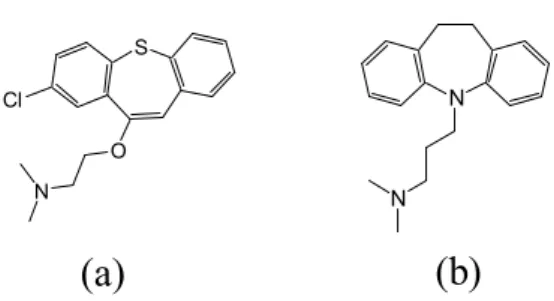
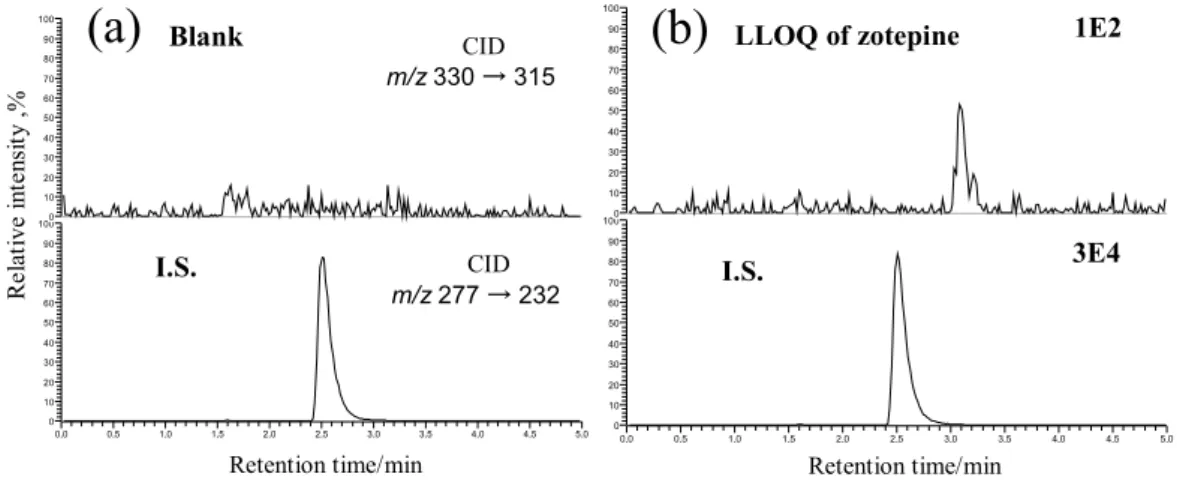
Antipsychotic Drug Zotepine in Human Serum
5
0
0
全文
(2)
(3)
(4)
(5)
図

関連したドキュメント
A selective, sensitive and rapid method for determining 8-OHdG in human urine was developed using hydrophilic interaction chromatography- tandem mass spectrometry (HILIC-MS/MS)
established ELISA, liquid chromatography tandem mass spectrometry (LC-MS/MS), and an automated high-throughput mass spectrometry (HT-MS/MS) system (RapidFire) to identify
Simultaneous Measurement of NAD Metabolome in Aged Mice Tissue Using Liquid Chromatography Tandem-Mass Spectrometry (LC/MS/MS). Overexpression of Nmnat3 efficiently increases
To determine the ratio of both constituents, we noticed that electrospray ionization mass spectrometry (ESI-MS) developed for the analysis of weakly charged species like proteins
The detection of Co was achieved by injecting a 1 μl aliquot of isoamyl alcohol containing Co-DDC complex directly into an electrospray ionization tandem mass
Recently, endocrine examination using liquid chromatography-tandem mass spectrometry (LC-MS!MS) has been developed to enable concurrent measurement of multicomponents of
A method in which liquid chromatography was coupled with tandem mass spectrometry (LC-MS/MS) was developed for determining the residues of malachite green,
量分析 k el Elimination rate constant 消失速度定数 LC-MS/MS Liquid chromatography
