A novel therapeutic strategy for pancreatic
cancer : targeting cell surface glycan using
rBC2LC-N lectin-drug conjugate(LDC)
著者
下村 治
year
2018
その他のタイトル
rBC2LC-Nレクチン(レクチン薬剤複合体)を用いた
膵癌細胞表面の特異的糖鎖をターゲットにした新規
癌治療法の開発
学位授与大学
筑波大学 (University of Tsukuba)
学位授与年度
2017
報告番号
12102甲第8703号
URL
http://doi.org/10.15068/00152483
筑 波 大 学
A novel therapeutic strategy for pancreatic
cancer: targeting cell surface glycan using
rBC2LC-N lectin-drug conjugate (LDC)
(
rBC2LC-N レクチン(レクチン薬剤複合体)
を用いた膵癌細胞表面の特異的糖鎖をターゲッ
トにした新規癌治療法の開発)
2 0 1 7
筑波大学大学院博士課程人間総合科学研究科
下 村 治
Table of contents
1.
Introduction
3
2.
Aim of research
5
3.
Materials and methods
5
3-1. Cell lines
3-2. Patient samples and tissue collection
3-3. Lectin microarray
3-4. Lectin staining
3-5. Production of rBC2-PE38
3-6. Cell assays
3-7. Haemagglutination assay
3-8. Toxicology study of rBC2-PE38 (LDC) in wild-type mice
3-9. Animal models of PDAC
3-10. rBC2-PE38 (LDC) treatment for in vivo PDAC mouse models
4.
Result
15
4-1. Selection of PDAC cell lines that display clinical PDAC and
cancer stem-cell-like characteristics
lines
4-3. The rBC2 LC-N lectin exhibited specific affinity for Capan-1 cells
and clinical PDAC samples
4-4. Construction of LDC and its cytocidal activity in vitro
4-5. Safety of intravital administration of LDC (rBC2-PE38)
4-6. Therapeutic effect of LDC in various mouse tumour models
5.
Discussion
23
6.
Conclusion
29
7.
Figures
30
8.
Supplementary materials
46
9.
References
67
10.
Acknowledgements
76
1. Introduction
Cancer-targeting antibody drugs, including antibody-drug conjugates (ADC) (1,
2), are attractive therapies, but their clinical success rates have been limited (3). The
targets of these drugs are usually peptides of cell transmembrane proteins; however, it is
important to note that cell surfaces are covered by a glycan layer that is referred to as the
glycocalyx (4). The glycomes of cancer cell surfaces are often unique, with aberrant
glycosylation including sialylation, fucosylation, glycan truncation, and N-and
O-linked glycan branching (5-7). Therefore, targeting outer-layer glycans might be a more
effective cancer-targeting strategy than targeting the underlying core proteins. While
carbohydrate-binding monoclonal antibodies have now been investigated for tumour
targeting for several decades, none have yet been approved in the clinic (8). Thus, novel
powerful therapeutic methods targeting cancer cell surface glycans that are not based on
the principal of antigen-antibody affinities should shed light on intractable cancers such
as pancreatic ductal adenocarcinoma (PDAC) (9).
Lectins, proteins that recognize glycans and thus have glycan-binding potential,
are an alternative to antibodies. However, exogenous lectins, such as those collected from
plants, fungi, and snake venom, often have erythrocytic agglutination activity, which has
lectin haemagglutination activity is quite variable (10). More than 100 putative
endogenous lectins, such as selectin and galectin (12), have been identified in humans
(11) and contribute to various physiological processes (10).
In this report, we tested whether lectins could be a drug carrier for cancer therapy
that is applicable in vivo. We first identified a lectin that possesses specific affinity to the
glycans of cancer cell surfaces using a rare and valuable PDAC cell line that has a
well-to-moderately differentiated morphology. The selected lectin was then fused to a bacterial
toxin to construct a lectin-drug conjugate (LDC), and its prominent cytocidal effect was
demonstrated using an in vitro assay. The therapeutic effects of LDC on PDAC were
tested in vivo using a cell line-based xenograft (cell-xeno) model and a patient-derived
2. Aim of research
To find out the pancreatic cancer specific glycan and lectins with specific affinity to
cancer cells and evaluate the anti-tumour effect of lectin-drug conjugate (LDC) for
pancreatic cancer cells both in vitro and in vivo.
3. Materials and methods
3-1. Cell linesA total of 6 human pancreatic cancer cell lines with various cell differentiation
states in their origin were used. AsPC-1 (CRL-1682, Sep. 19, 2013), BxPC-3 (CRL-1687,
Aug. 4, 2015), Capan-1 (HTB-79, July 26, 2013), MIAPaCa-2 (CRL-1420, Sep. 5, 2013),
and PANC-1 (CRL-1469, March 4, 2015) were purchased from American Type Culture
Collection (ATCC, VA, USA), and SUIT-2 (JCRB1094, July 28, 2015) was obtained from
the National Institute of Biomedical Innovation (Osaka, Japan). The morphologies of their
clinical PDAC origin were as follows: well-differentiated for Capan-1; and those of the
other 5 lines were poorly or poorly moderately differentiated (13). Capan-1, MIAPaCa-2
and AsPC-1 cells were verified by STR-PCR in March 2016 (report number: KBN0366,
National Institute of Biomedical Innovation, Osaka, Japan). The remaining cell lines were
3-2. Patient samples and tissue collection
Fresh human pancreatic cancer tissue was obtained with patient consent as
approved by the Research Ethics Board of the University of Tsukuba. A total of 69
resected pancreatic adenocarcinoma specimens (7 poorly differentiated (P/D) cases, 53
moderately differentiated (M/D) cases and 9 well-differentiated cases) were used in this
study. For the use of these clinical samples for research purposes, written informed
consent was obtained from all patients, and approval was obtained from the Tsukuba
Clinical Research & Development Organization (T-CReDO protocol number: H28-90).
3-3. Lectin microarray
The high-density lectin microarray was prepared as previously described (14).
Briefly, proteins from each cell line were prepared from whole-cell lysates of six different
wells and fluorescently labelled with the monoreactive dye Cy3 (GE Healthcare). Then,
0.5 μg/ml Cy3-labelled lysate was added to each well of a microarray plate, and the plate
was incubated at 20°C overnight. Fluorescence images were then acquired using an
evanescent field-activated fluorescence scanner (GlycoStationTM Reader; GlycoTechnica
Array-Pro Analyser version 4.5 (Media Cybernetics, Bethesda, MD, USA),
mean-normalized, log-transformed, and analysed via the average linkage method using Cluster
3.0 (yellow: high; black: intermediate; blue: low).
3-4. Lectin staining
Lectin histochemistry: Antigen retrieval in 2-µm slide sections of formalin-fixed and paraffin-embedded (FFPE) tissues was performed by autoclaving, endogenous
peroxidase activity was blocked with 3% H2O2 with methanol, and horseradish
peroxidase-labelled rBC2 was applied and visualized by applying the chromogen
diaminobenzidine (Nichirei, Japan). The clinical cases were judged as 0, 1+, 2+, 3+ with
regard to rBC2 reactivity, and the correlation with cell differentiation was assessed.
Live-cell staining by rBC2 lectin: Live cells were incubated for 12 h in medium containing FITC-conjugated rBC2 LNC (1 μg/ml); images were captured using a
BIOREVO BZX-710 fluorescence microscope (KEYENCE).
3-5. Production of rBC2-PE38
The recombinant N-terminal domain of BC2L-C (rBC2LC-N) (156 amino acids)
(399–613 residues; 215 amino acids) carrying a C-terminal 6x-His tag (HHHHHH) and
a KDEL sequence via a ten-amino-acid linker (GSG3)2 (Fig. 2A). The generated
rBC2-PE38 (371 amino acids) was expressed in E. coli and purified via one-step affinity
chromatography on an L-fucose-Sepharose column. The yield was 10 mg/l of bacterial
culture. rBC2-PE38 was detected as a major band at the predicted molecular weight of 54
kDa by SDS-PAGE in the presence and absence of 2-mercaptoethanol (Supplementary
Fig. S1).
3-6. Cell assays
Lectin binding analysis: Cells were harvested and stained with various concentrations of rBC2-FITC for 30 min on ice. The MFI of the cells was determined
using an LSR Fortessa X-20 flow cytometer. The data were analysed using a nonlinear
regression fitting programme in GraphPad Prism 6 (GraphPad Software Inc., La Jolla,
CA, USA).
MTT assay: The cytotoxicity of rBC2-PE38 was measured in a cell viability assay using WST-8 (Dojindo Molecular Technologies) as recommended by the
for 24 h, rBC2 or rBC2-PE38 was applied to the medium at the indicated concentrations
(0.1 pg/ml to 10 µg/ml). After further incubation for 48 h, the culture medium was
replaced with the appropriate fresh medium, and the cells were incubated for an additional
24 h. We used 48 h + 24 h and not a continuous 72 h because many cells died after 48 h
due to the action of LDC, which was internalised into cells during the first 48 h. Cell
viability was then assessed via an MTT assay (WST-8) according to the manufacturer’s
instructions. After solubilisation of the purple formazan crystals, absorbance was
measured at 450 nm (background wavelength, 650 nm) using a plate spectrophotometer.
The IC50 was calculated using GraphPad Prism 6.
3-7. Haemagglutination assay
Blood samples were obtained from 4 healthy volunteers of each blood type, i.e.,
A, B, O, and AB. A 5-ml aliquot of freshly whole blood was washed 3 times with 20–25
ml of PBS (centrifugation at 500 g for 5 min, followed by removal of the plasma and
white cell ghost layer at the top of the pellet). The suspension of untreated (without using
trypsin) erythrocytes was then mixed with an equal volume of incubation buffer (0.1 M
acetate buffer containing 1 mM CaCl2, pH 5.5) containing 1 unit/ml neuraminidase (from
samples were again washed 3 times with PBS and then prepared as a 2% (v/v) erythrocyte
suspension in PBS. Concanavalin A or rBC2 lectin solution (50 µg/ml) was applied to the
left well of a U-shaped 96-well plate, and a series of two-fold dilutions were prepared in
a horizontal line. The same volume of erythrocyte suspension was applied to each well,
and agglutination was observed.
3-8. Toxicology study of rBC2-PE38 (LDC) in wild-type mice
To evaluate the LD50 (50% lethal dose) of LDC, female wild-type mice (5–6
weeks old, 18-20 g, Charles River Laboratories International, Japan) were given an
intraperitoneal (i.p.) or intravenous (i.v.) injection with a single dose of 1.0 to 15.0 μg of
rBC2/mouse or rBC2-PE38/mouse (50 to 750 μg/kg) in 300 μl of PBS. The mice were
observed for survival until day 14.
3-9. Animal models of PDAC
Animal experiments were conducted in compliance with the ethical regulations
approved by the Animal Care Committee, University Health Network, University of
Subcutaneous cell xenograft model: A total of 3×10⁶ Capan-1 or SUIT-2 cells
were subcutaneously injected into female nude mice (BALB/c nu/nu, 6 to 8 weeks old,
CLEA Japan, Tokyo, Japan).
Subcutaneous patient-derived xenograft (PDX) model: Fresh human pancreatic cancer tissue originated from a nodules of liver metastasis of clinical PDAC
that showed moderately-to-poorly differentiated morphology was implanted into
subcutaneous pockets on the back skin of CB17/Icr-scid/SCID mice (female, 6 to 8 weeks
old, CLEA Japan, Tokyo, Japan). After the establishment of 1st-generation subcutaneous
nodules, the tumour nodules were minced into 2-mm cubic fragments, and 3 pieces were
implanted into subcutaneous pockets on the back skin of SCID mice. This PDX nodules
show moderately differentiation in morphology.
Pancreatic orthotopic model: Nude mice were anesthetized with isoflurane, a laparotomy was created using a left lateral abdominal incision, and the pancreas was
exteriorized. Four tumour pieces (approximately 2 mm in diameter) obtained from
peritoneal disseminated Capan-1 nodules were transplanted to the body of the pancreas
Peritoneal dissemination model: Nude mice were inoculated with Capan-1 or SUIT-2 cells by i.p. injection of 2.0×10⁶ cells suspended in 100 μl of PBS. On day 14, 2
mice were sacrificed to confirm the establishment of disseminated cancer nodules. The
remaining mice were then randomly allocated to 4 groups.
3-10. rBC2-PE38 (LDC) treatment for in vivo PDAC mouse models
Direct injection (d.i.) to subcutaneous cell xenograft models and a PDX model. A direct injection (d.i.) of 40 ng, 1 µg or 5 µg of LDC in 100 μl of PBS was performed a
total of 4 times near the subcutaneous tumours on days 14, 18, 22, and 26. For the control,
100 µl of normal saline was injected. The tumour volume was determined every day for
2 weeks using the following formula: (width)2×(length)/2. On day 34, the subcutaneous
tumours were excised for weight measurements.
i.p. and i.v. injection of LDC to subcutaneous PDX models. A total of 1 µg LDC was administered in 100 μl of PBS via i.p. injection (n=4 each) or i.v. injection via
the tail vein for a total of 8 times on days 14, 17, 19, 22, 24, 26, 29 and 31. On day 36,
i.p. and i.v. injection of LDC to orthotopic models. The mice were treated and evaluated on a treatment schedule identical to that of the cell xenograft models, using 1
µg or 5 µg of LDC (n=5 each). On days 21, 24, 28 and 31, 1 µg of LDC was administered
i.p. or i.v. via the tail vein. On day 45, the mice were sacrificed for the observation of
abdominal status and tumour weight measurement.
i.p. and i.v. injection to peritoneal dissemination models. The Capan-1 peritoneal dissemination mouse models were treated by injection of 1 μg of rBC2 lectin
without PE38, 40 ng of LDC or 1 µg of LDC in 100 μl of PBS by i.p. or i.v. injection via
the tail vein a total of 4 times on days 14, 18, 22, and 26 (n=4 each). On day 30, the mice
were sacrificed for manual counting of the disseminated nodules. The Kaplan-Meier
survival curves were calculated using 36 nude mice. At 14 days after the Capan-1 cell
injection, 4 groups of mice (n=9 each) were treated on days 1, 5, 9, and 13 with control,
40 ng of LDC via i.p. injection, 1 µg of LDC via i.p. injection, or 1 µg of LDC via i.v.
injection.
A heat map of the clustering analysis results was constructed using Java TreeView.
Differences in the lectin signal between the two arbitrary data sets were evaluated using
Student’s t-test in SPSS Statistics 21.0 (SPSS Inc.). Significantly different lectin signals
or glycosyltransferase expression levels were selected if they satisfied a familywise error
rate (FWER) of < 0.001 according to the Bonferroni method. Applied statistics included
the unpaired Student’s t-test and the Mann-Whitney U test. P<0.05 was considered to
indicate significance. Kaplan-Meier curves (statistically analysed by the log-rank test)
and LDC IC50 values of were calculated using GraphPad Prism 6; other analyses were
4. Result
4-1. Selection of PDAC cell lines that display clinical PDAC and cancer stem-cell-like characteristics
For cancer cell glycome analysis, clinical PDAC samples are limited in terms of
sample availability and quality due to the typical histological characteristics of PDAC,
which include the presence of epithelial cancer cells forming ductal glands (g++)
surrounded by abundant stromal components (s++) (Fig. 1A). We therefore began the
experiments by selecting a cell line that represents the dominant morphological properties
of clinical PDAC when grown in vivo. Only Capan-1 cells strongly exhibited organized
gland formation (g++) and dense stromal proliferation (s++) (Fig. 1B). The expression of
the known pancreatic cancer stem cell markers CD24, CD44, EpCAM, and CD133 (15,
16), as revealed by flow cytometry analysis, indicated that the Capan-1 line was positive
for 3 markers and was the only cell line to show CD 133 positivity (Supplementary Fig.
S2). Therefore, we considered Capan-1 to be a rare PDAC line that maintains
well-to-moderately differentiated tumour features and thus represents the dominant morphology
of clinical PDAC characteristics. In fact, although most clinical human PDACs are well
or well-to-moderately differentiated cancers according to histology, and poorly or
PDAC cell lines are derived from poorly or moderate-to-poorly differentiated cancers
(13).
4-2. High-density lectin microarray analysis of 6 types of PDAC cell lines
Glycan expression in Capan-1 cells, in which we have focused as the tester cell line
that may represent PDAC glycan expressions, was compared with that in 5 other cell lines
using high-density lectin microarrays (14). A representative heat map demonstrated that
Capan-1 and BxPC-3 cells cluster on the same branch of a tree diagram, separate from
the branch that includes the other 4 cell lines (Fig. 1C). Of the 96 lectins tested, the top
10 lectins with significantly different signal intensity in the Capan-1 cell line were
identified; these included 8 lectins with increased reactivity and 2 lectins with decreased
reactivity (Supplementary Fig. S3 and Supplementary Table S1). The most prominent
difference was found in the case of the rBC2LC-N (recombinant N-terminal domain of
BC2L-C) lectin (Fig. 1D), a TNF-like lectin that was originally identified in the
gram-negative bacterium Burkholderia cenocepacia and that specifically binds to fucosylated
glycan epitopes of H type 1/3/4 trisaccharides (17).
PDAC samples
The affinity between the rBC2LC-N lectin and Capan-1 cell glycan was further
confirmed by live-cell staining (Fig. 1E), flow cytometry analysis using FITC-labelled
rBC2LC-N (Fig. 1F and Supplementary Fig. S4), and histochemical staining of an in vivo
mouse cell line-derived xenograft model with labelled rBC2LC-N (Fig. 1G and
Supplementary Fig. S5). Each experiment revealed similar strong reactivity of the
rBC2LC-N lectin to Capan-1 cells (Fig. 1E-G). To address whether reactivity with the
rBC2LC-N lectin is specifically associated with Capan-1 cells or whether it can be
expanded to general clinical PDAC, we analysed 69 human clinical PDAC specimens by
rBC2LC-N lectin histochemical staining. The representative staining patterns of 3 clinical
PDAC of poorly (P/D), moderately (M/D) and well-differentiated (W/D) specimens are
shown in Fig. 1H. In 7 P/D cases, 6 were weakly positive (1+) for rBC2 staining, whereas
in 9 W/D cases, 7 were strongly (2+) or very strongly (3+) positive. M/D cases comprised
the majority (53 cases) of the 69 clinical PDAC cases, and their rBC2 staining was as
follows: 1+ in 18 cases, 2+ in 25 cases and 3+ in 10 cases. The surrounding stromal
components were negative for rBC2 staining (Fig. 1H).
For the top 10 lectins with the highest differences in specific affinity, lectin
rBC2LC-N showed the most prominent contrast in terms of its intensive affinity for
cancer cells and its lack of affinity for stromal fibroblast cells (Supplementary Fig. S6).
Our data indicate that a fucosylated glycan epitope (H type 1/3/4) that is recognized by
the rBC2LC-N lectin may serve as a promising therapeutic target for PDAC.
4-4. Construction of LDC and its cytocidal activity in vitro
With the aim of utilizing the rBC2LC-N lectin (rBC2) as a therapeutic drug carrier,
a 38-kDa region of the catalytic domain of Pseudomonas aeruginosa exotoxin A (PE A)
was fused with the lectin sequence to construct LDC (rBC2-PE38) (18) (Fig. 2A). The
dissociation constant (Kd) values for rBC2 indicated high-affinity binding of the
conjugate only to Capan-1 cells (Kd: 171.4 nmol/l, Fig. 2B). The cytocidal effect of LDC
was measured using an MTT assay; the 50% inhibitory concentration (IC50) of LDC
against Capan-1 cells was 1.04 pg/ml (0.0195 pmol/l, Fig. 2C), nearly 1000 times lower
than that of conventional immunotoxins, which generally have IC50 values on the order
of ng/ml (Supplementary Table S2). The other 5 cell lines that displayed no affinity for
the rBC2LC-N lectin showed moderate to negative cytocidal effects (Fig. 2D). Because
internalization into the cell cytoplasm is a key indispensable step for the cytocidal toxicity
of the conjugate, the cell surfaces of the Capan-1 cells were surrounded by rBC2 lectins
(Fig. 2E). Endocytic vesicles containing rBC2 lectin were visible inside Capan-1 cells at
24 h and more conspicuous at 48 h. In contrast to Capan-1 cells that possess positive
affinity for rBC2 lectins, the negative control cell line (SUIT-2), which has no affinity for
rBC2 lectins, showed no fluorescence intensity on the cell membrane at 24 h and no
endocytic vesicles inside the cytoplasm at 48 h.
4-5. Safety of intravital administration of LDC (rBC2-PE38)
We questioned whether our selected lectin would be a safe and effective drug
carrier that could be administered to cancer patients because lectins are often defined by
their cell agglutination activities. We evaluated the reactivity of the rBC2LC-N lectin on
the surface of non-cancerous abdominal organs in mice (Fig. 3A) and confirmed that
rBC2LC-N exhibited negative reactivity for the entire parietal peritoneum and the serosal
membranes of visceral organs. The disseminated cancer nodules of Capan-1 cells were
confirmed to be strongly positive for rBC2LC-N reactivity. Importantly, an in vitro
haemagglutination test of erythrocytes from mice and a human volunteer (blood type A)
demonstrated that the rBC2LC-N lectin did not induce haemagglutination even at a high
concanavalin A (Con A) lectin at 1.56 μg/ml in mouse and human erythrocytes (Fig. 3B).
LDC (rBC2-PE38) slightly affected haemagglutination at very high concentrations, as
demonstrated by a positive result at 25 μg/ml in mouse erythrocytes and 12.5 μg/ml in
human erythrocytes (Fig. 3B). Identical results were obtained for human erythrocytes of
other blood types, including type B, AB and O (Supplementary Fig. S7). In addition, the
rBC2LC-N lectin staining of human red blood cells contaminating clinical PDAC slides
revealed that all red blood cells were negative, indicating that human red blood cells are
likely to be negative for the H type 1/3/4 motif (Fig. 3C and Supplementary Fig. S8).
Notably, white blood cells (* with blue nuclei) were also negative for rBC2LC-N
reactivity. When the LDC 50% lethal dose (LD50) was analysed by i.p. and i.v.
administration, acceptable values were estimated to be 7.14 μg/mouse (424.8 μg/kg) for
i.p. and 7.22 μg/mouse (429.6 μg/kg) for i.v. (Fig. 3D). Administration of the BC2LC-N
lectin without conjugated toxin did not cause death at any dose tested up to 15 μg/mouse
(892.5 μg/kg), either i.p. or i.v. Based on these observations, we were confident that at
least the i.p. injection, and likely also the i.v. injection, of LDC would be safe for mouse
models in vivo.
1. Subcutaneous xenografts treated by local injection
In cell line-based models, Capan-1 xenografts (positive for the H type 1/3/4 glycan
epitope) were significantly diminished by LDC direct injection (d.i.) (Fig. 4A1-3).
However, regarding SUIT-2 xenografts, which exhibit no affinity to the rBC2LC-N lectin,
LDC injection did not reduce the tumour sizes except when the dose reached 5 µg/mouse
(Fig. 4B1-3). In a more clinically relevant patient-derived xenograft (PDX) model,
tumours decreased in size after LDC administration in a dose-dependent manner (Fig.
4C1-3).
2. Subcutaneous PDX xenografts treated by i.p. or i.v. injection
The anti-tumour effects of LDC administration via the i.p. or i.v. routes for
subcutaneous tumours of the PDX model are shown in Fig. 4D1-3. Although these
tumours grow rapidly in the control group (normal saline i.p.), LDC treatment groups that
received a total of 8 treatments showed reduced growth with either i.v. or i.p.
administration. The average tumour weights at day 36 were 991 mg in the control group,
whereas those of i.p. and i.v. administration group were 540.6 and 686.6 mg, respectively
3. Pancreatic orthotopic xenografts treated by i.p. or i.v. injection
The effects of 4 LDC treatments (1 µg/mouse) administered via i.p. or i.v. for
orthotopic tumours are shown in Fig. 4E1-4. The average tumour weights after i.p. and
i.v. administration were 130.8 mg and 203 mg, respectively (P<0.001 and P<0.05,
respectively, relative to the control value of 390 mg). Macroscopic metastases to the liver,
spleen or abdomen occurred frequently in the control groups (3-4/5 mice) but were rare
in the LDC treatment groups (0-2/5 mice).
4. Peritoneal dissemination models treated by i.p. or i.v. injection
By day 14, peritoneal disseminated nodules had grown to a visible size and
measured 1–3 mm (Fig. 5A). In the Capan-1 group, significantly fewer disseminated
nodules were observed upon treatment with either 40 ng of LDC/mouse or 1 μg of
LDC/mouse (Fig. 5B). In the SUIT-2 group, for which rBC2 exhibited no affinity, LDC
had no effect (Fig. 5C). In the control groups, the peritoneal cavities of the mice contained
abundant cancer cells, whereas there were no cancer cells in the peritoneal cavities of the
mice in the 1 μg of LDC/mouse treatment group (Fig. 5D). At day 45, the weights of the
mice were significantly improved both in i.v. and i.p. administration (Fig. 5E). The effect
of disseminated nodules (Fig. 5F-1), ascites, and liver metastasis (Fig. 5F-2). Finally, we
addressed whether glycan-targeting LDC therapy could cure PDAC in the mouse model
of PDAC (Fig. 5G). The median survival of the control group was 62 days, with a 90-day
survival rate of 0% (0/9). In contrast, administration of four i.p. injections of 1 µg of LDC
resulted in a 90-day survival rate of 78% (7/9) and improved the median survival time
significantly (105 days) (P<0.0001). The effects of four i.v. injections of 1 µg of LDC
were comparable to those of i.p. injection, resulting in a 56% (5/9) 90-day survival rate
and a median survival time of 90 days.
5. Discussion
Thus far, the potential of lectins for in vivo cancer treatment have not been well
tested, likely due to the common belief that all lectins mediate harmful haemagglutination.
In this study, we found a specific affinity between the rBC2LC-N lectin and PDAC cell
surface glycans (fucosylated glycan epitopes of H type 1/3/4 trisaccharide), and this lectin
was shown to be a safe and efficient drug carrier in cancer treatment.
The identification of rBC2LC-N as the most highly reactive lectin in PDAC was
an unexpected coincidence because we previously reported that rBC2LC-N specifically
differentiated somatic cells (20). The serendipitous finding that an rBC2LC-N
fucose-binding lectin displays affinity for PDAC and iPS/ES cells indicates that consensus
glycan modification of membrane proteins or lipids containing H type 1/3/4 glycan on
PDAC cells plays a crucial role in the formation and development of cancerous tissue.
The specific affinity between LDC and cancer cell surface H type 1/3/4 glycan was
confirmed by competitive inhibition by adding free rBC2LC-N lectin and free glycan
(=fucose) (Supplementary Fig. S9).
One critical question has been whether the rBC2LC-N lectin can safely be
administered to cancer patients because lectins are initially defined by their blood
agglutination activities (10). This concern was addressed using an in vitro
haemagglutination assay; the results showed that the rBC2LC-N lectin did not induce the
aggregation of human erythrocytes (Fig. 3B and Supplementary Fig. S7), and the negative
rBC2LC-N staining of human red blood cells contaminating 69 clinical PDAC specimens
is shown (Fig. 3C and Supplementary Fig. S8). This finding might be explained by the
fact that the ABO blood type glycans on red blood cells contain predominantly H type 2
trisaccharide motifs in which Gal and GlcNAc are connected via beta-1-4 glycosidic
bonds (21). rBC2LC-N is known to bind only H type 1/3/4 trisaccharide motifs and not
fucose addition to galactose in type 1 (Gal-GalNAc), or H type 3/4 are generated by
fucosylation of type 3/4 disaccharide (Gal-GalNAc) by fucosyltransferases (Fig. 6A) (17).
Moreover, the rBC2LC-N lectin was administered to mice without notable adverse events,
further indicating that this lectin alone does not induce blood coagulation in vivo (Fig.
3D). Based on our experimental data and the literature, we are confident that the
rBC2LC-N lectin could be administered via the intravenous route without inducing
haemagglutination.
The next issue should be the potential non-specific attachment of rBC2LC-N to
non-cancerous normal tissues other than red blood cells. Fucose modification of glycans
is one of the representative cancer-specific changes in glycosylation (5); however,
fucosylated type 1/3/4 glycan epitopes are also found in non-cancerous epithelial cells of
the gastrointestinal, respiratory, and reproductive tracts (22). Our results obtained using
rBC2LC-N lectin staining also revealed positive staining of epithelial cells in the exocrine
glands of the stomach, duodenum, small intestine, colon and genitourinary tract,
presumably associated with secreted mucin (Fig. 3A). However, we considered the risk
of LDC affinity for these cells to be negligible after administration via the i.p. route
because mucin secretion predominantly occurs on the internal luminal surface of halo
reactivity. As expected, i.p. administration of LDC resulted in a prominent tumour
elimination effect in a mouse model of peritoneal dissemination of PDAC without adverse
events. Though the rBC2 reactivity to human organs showed similar distribution with
those of mouse (Supplementary Fig. S10), the different statuses of glycosylation and
fucosylation between species, i.e., human and mouse, may result in the potential toxicity
of LDC in the human setting. Even after i.v. administration, distribution to non-cancerous
organs should be very limited with the enhanced permeability and retention (EPR) effect,
which results in predominant delivery of large molecules to cancer tissues via the
damaged endothelial cell linings of capillaries in the region of the tumour (23). In fact,
the i.v. injection of 1 μg of LDC/mouse also shrank tumours in the orthotopic (Fig. 4E)
and peritoneal dissemination model of Capan-1 cells (Fig. 5F) and subcutaneous PDX
tumour (Fig. 4D) with an efficacy identical to that of i.p. injection without notable adverse
events. However, it should also be noted that the EPR effect showing the predominant
accumulation of LDC in PDX tumours in mouse models may not be reproduced in clinical
PDAC, because human PDACs are known to be hypoperfused and poorly vascularized
compared with xenotransplanted tumours (24, 25).
Compared with the affinity of antibodies for peptide antigens (Kd=0.1-10
nmol/l). However, LDC possesses the following notable advantages (shown
schematically in Fig. 6B): i) the target glycans are located at the outermost coatings of
cancer cells, known as glycocalyx, conferring easy access for targeting drugs; ii) the
cancer cells possess abundant glycan sites for interaction with LDC, including branched
glycan chains attached to multiple different core proteins; iii) the small size of the lectin
should be beneficial for drug endocytosis; and iv) the glycolipids are also the binding
target of LDC, and the very close proximity of glycolipids to the cell membrane should
be favourable for drug endocytosis. As a comprehensive result, the lectin drug displayed
a remarkable IC50 value of 0.0195 pmol/l l, nearly 1000 times lower than the IC50s of
conventional immunotoxins, which are on the order of ng/ml (Supplementary Table S2);
thus, the lectin drug provides a prominent cancer therapeutic effect. As lectins can be
generated in an economical bacterial system, lectin-based drugs should be advantageous
from the viewpoint of medical economics in comparison to antibody-based drugs that
require costly eukaryotic cells for their production (26).
rBC2LC-N may be a unique lectin that lacks typical haemagglutination activity.
However, the rapid improvement in lectin engineering technologies (27) will provide
control over the harmful adverse effects of some lectins, and synthetic lectin technologies
This study provides new insight into cancer treatments that might serve as alternatives to
expensive antibody-based drugs. Moreover, the application of tumour-targeting lectins
might be expanded by coupling them to small-molecule agents or to nanoparticles,
6. Conclusion
Targeting cancer specific glycans using lectin promised great advancement in effective
drug delivery and our lectin-drug conjugate (LDC) using rBC2LC-N lectin showed a
Fig. 1. Screening for lectins that specifically bind to PDAC.
A, The pathology of a typical PDAC specimen consists of a cluster of ductal spreading cancer cells with abundant stromal components, defined as gland formation (g++) and
stromal induction (s++). B, The morphologies of the 6 pancreatic cancer cell lines in
mouse xenografts with respect to gland formation (g++, + or -) and stromal induction
(s++, + or -). Capan-1 cells exhibited strong, organized gland formation (g++) and dense
stromal proliferation (s++). C, High-density lectin microarray analysis of 96 various
lectins was performed on 6 PDAC cell lines (n=6 protein samples for each cell line,
technical replicates). A heat map of the clustering analysis (yellow: high; black:
intermediate; blue: low) placed BxPC-3 and Capan-1 cells on an identical branch of the
tree diagram (above the line). The position of the rBC2LC-N lectin is indicated by an
arrow. D, For each of the 96 lectins assessed, the signal intensity in the Capan-1 cell line
was compared with that of the other 5 cell lines. The rBC2LC-N lectin exhibited the most
robust difference (two-tailed unpaired Student’s t-test). The top 10 lectins that showed
specific affinity differences in Capan-1 cells are described in Supplementary Figure S3
and Table S1. E, The specific affinity of rBC2LC-N for Capan-1 cells in the lectin
microarray was further confirmed by live-cell staining using FITC-labelled rBC2LC-N
Capan-1 cells displayed the highest affinity for rBC2LC-N, as indicated by an MFI of
61300. G, Lectin histochemistry of cell-based xenograft models demonstrated strong
staining for rBC2LC-N in Capan-1 xenografts (brown signal and blue counterstaining
with haematoxylin) and mosaic staining in BxPC-3 xenografts. The remaining 4
xenografts were negative for rBC2LC-N (scale bar, 100 μm). H, rBC2LC-N lectin
histochemistry in human clinical PDAC specimens. Representative micrographs of 3
cases, including P/D with weak (1+) staining, M/D with moderate (2+) staining, and W/D
with strong (3+) staining. I, Among the 69 human clinical PDAC cases, P/D cases tended
to show weak staining with rBC2, and W/D cases showed moderate to strong staining.
The primary differentiation was M/D (53/69), which demonstrated similar distribution as
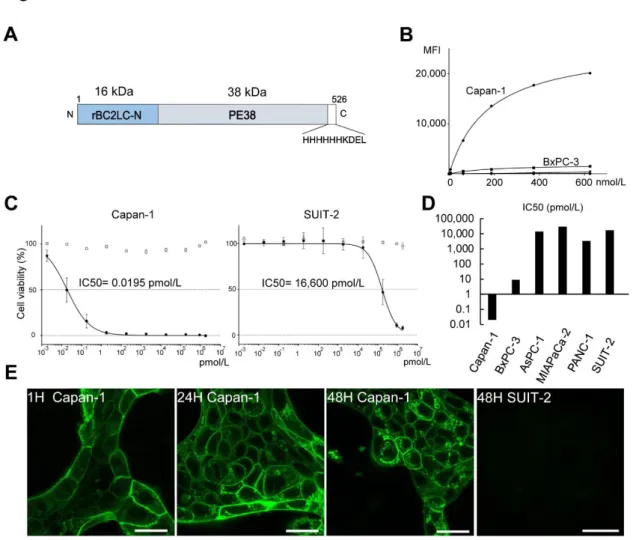
Fig. 2. LDC (rBC2-PE38) and its in vitro cytotoxicity against PDAC cells.
A, The 54-kDa LDC (rBC2-PE38) molecule contains a 16-kDa rBC2LC-N (recombinant N-terminal domain of BC2 L-C lectin) region and a 38-kDa region representing the
catalytic domain of Pseudomonas exotoxin A (PE38). B, Binding affinity of the
rBC2LC-N lectin in 6 PDAC cell lines. Only Capan-1 cells (Kd=171.4 nmol/l) demonstrated high
affinity for rBC2LC-N, whereas Kd values could not be estimated for the other cell lines.
C, MTT assays using WST-8 were performed to more precisely evaluate the in vitro cytotoxic effect of LDC (black circle). The IC value against Capan-1 cells (0.0195
pmol/l=1.04 pg/ml) was substantially lower than that against SUIT-2 (16,600 pmol/l). D,
Summary of LDC IC50 values against 6 PDAC cell lines. Capan-1 showed marked
sensitivity, BxPC3 showed intermediate sensitivity (IC50=9.24 pmol/L=520 pg/ml),
whereas the remaining 4 cell lines had IC50s on the order of 10,000 pmol/l, indicating no
significant affinity for rBC2LC-N. E, Live Capan-1 cells after incubation with
fluorescently labelled rBC2. At 1 h, confocal laser microscopy showed that the cell
surface membranes were covered with rBC2-FITC, but rBC2-FITC had not been ingested
by the cells. After 24 h, fluorescent deposits were observed inside the cells, and these
became more conspicuous at 48 h (scale bar, 25 μm). A negative control cell line
(SUIT-2) that has no affinity for rBC2 lectins showed no fluorescence intensity on the cell
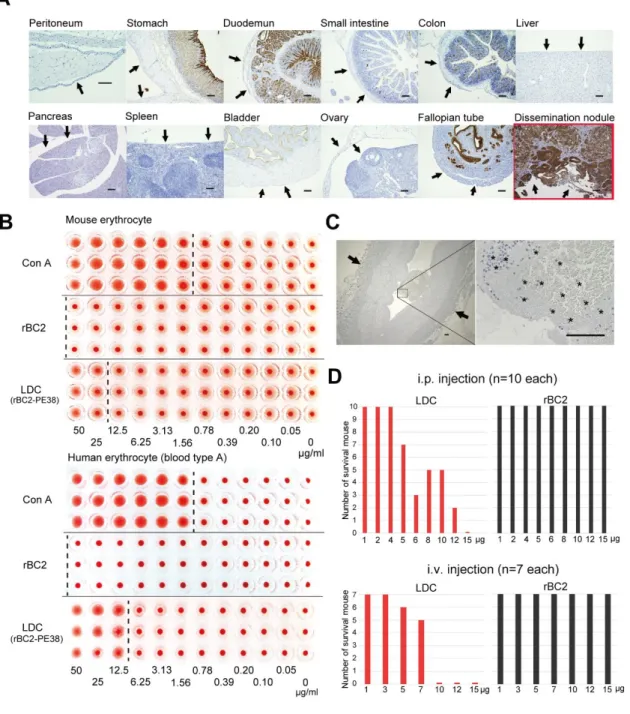
Fig. 3. Safety of LDC administration.
A, rBC2LC-N lectin reactivity to mouse organ surfaces that might be exposed to LDC administered via the i.p. route. Negative reactivity to the entire parietal peritoneum and
confirmed, in contrast to the strong positivity in the Capan-1 disseminated cancer nodules.
Positive reactivity to rBC2LC-N in epithelial cells on the internal surface of the hollow
organs (strongly in the stomach, duodenum and fallopian tube and weakly in the small
intestine and colon) can be ignored in i.p. administration because these cells do not
encounter LDC when injected via the i.p. route. (scale bar, 100 μm) B, Haemagglutination
assay of rBC2LC-N and LDC. The rBC2LC-N lectin alone did not induce erythrocyte
aggregation from mice and a human volunteer, even at an extremely high concentration
of 50 μg/ml. A positive control with concanavalin A (Con A) lectin demonstrated
aggregation at 1.56 μg/ml. LDC (rBC2-PD38) slightly affected haemagglutination at the
very high concentrations of 25 μg/ml in mouse and 12.5 μg/ml in human samples. Each
test contained n=3 technical replicates. Other blood types are shown in Supplementary
Fig. S7. C, rBC2LC-N lectin staining of human red blood cells (Type A) contaminating
clinical PDAC slides revealed that all red blood cells were negative, indicating that the
rBC2LC-N lectin should not induce the aggregation of red blood cells. Notably, white
blood cells (* with blue nucleus) were also negative for rBC2LC-N reactivity (scale bar,
100 μm). Other blood types are shown in Supplementary Fig. S8. D, The 50% lethal dose
(LD50) of rBC2LC-N alone and LDC by i.p (n=10 wild-type mice for each concentrations)
administration of LDC was calculated to be 7.14 μg/mouse and 7.22 μg/mouse,
respectively. By contrast, rBC2LC-N alone did not induce death at any dose tested up to
Fig. 4. In vivo effect of LDC (rBC2-PE38) on subcutaneous tumours in a mouse model after local injection. LDC was directly injected (i.v.) near the subcutaneous tumour 4 times, with one injection every 4 days (arrows in A-1, B-1). A-1, Subcutaneous
tumour growth curves of Capan-1 xenografts. LDC significantly diminished the size of
the xenograft tumours in a dose-dependent manner (n=6 biological replicates). A-2, 3,
The objective weight of enucleated nodules obtained at day 30 also confirmed the
prominent reduction of the tumour weight of Capan-1 xenografts by LDC. B-1, 2, 3,
Subcutaneous SUIT-2 xenograft model (negative for the H type 1/3/4 glycan epitope).
LDC d.i. did not induce a tumour reduction effect except at a dose of 5 µg/mouse. C-1, 2,
3, In the more clinically relevant PDX model with a moderately differentiated morphology, LDC d.i. also decreased the size of the subcutaneous nodules in a
dose-dependent manner (n=5 biological replicates). D-1, 2, 3, A PDX model with a moderately
differentiated morphology was tested for the effect of LDC via various injection root
including i.p and i.v. The growth curves and average tumour weights after a total of 8 i.p.
or i.v. administrations were significantly reduced. E-1-4, The effects of LDC (1
µg/mouse) administered via either the i.p. or the i.v. route for orthotopically transplanted
Capan-1 tumours. H&E staining and rBC2CL-N lectin histochemistry demonstrated that
(negative) (scale bars, 100 µm). After 4 injections of LDC by either i.p. or the i.v., the
tumour weights were significantly reduced (n=5 biological replicates.). The number of
mice with metastases, including peritoneal dissemination, liver and spleen metastases,
was decreased in the treatment groups (0-2/5 mice) relative to the control groups (3-4/5
mice). The results of statistical analysis by two-tailed unpaired Student’s t-tests relative
to control are indicated as follows: *P<0.05; **P<0.01; ***P<0.001; ****P<0.0001; n.s.,
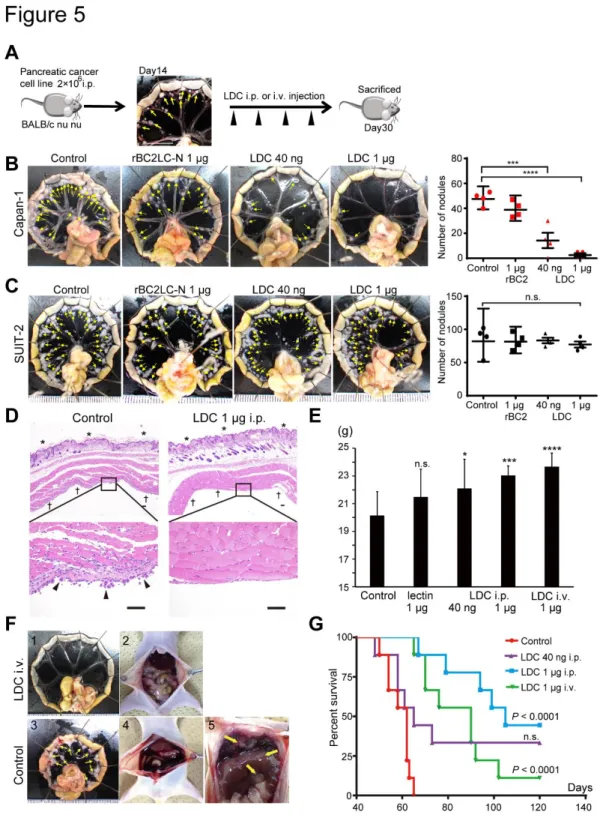
Fig. 5. Effectiveness of LDC for the treatment of PDAC peritoneal dissemination in a mouse model. A, At day 14 after i.p. injection of Capan-1 or SUIT-2 cells, many
opal-coloured nodules known as milky spots (arrows) were distributed on the peripheral
margin of the small intestine (28). LDC was i.p. or i.v. injected 4 times. B, The
mesenterium after treatment on day 30. In the Capan-1 model, numerous nodules
(arrow) remained in the control and rBC2LC-N alone groups, whereas nodules were
significantly and dose-dependently reduced in LDC-treated groups (n=4). C, The
number of nodules was not altered in the SUIT-2 model. D, Microscopic observation of
the resected abdominal wall (*, skin surface; †, peritoneum) revealed numerous
disseminated cancer cells (arrows) in the control, whereas cancer cells were completely
absent after i.p. injection of 1 µg of LDC (H&E staining, scale bar, 500 µm).
E, Body weight at day 45 was significantly reduced in the control and rBC2-lectin-without-toxin cohorts (n=9 biological replicates); n.s., not significant; *P<0.05;
***P<0.001; ****P<0.0001 (two-tailed unpaired Student’s t-test). Intraperitoneal
injection of LDC resulted in good weight gain, and body weight was comparable between
the i.v. administration and i.p. administration of LDC cohorts. All mice were healthy and
did not exhibit damage to non-cancerous epithelial cells of hollow or genitourinary organs,
and the body weight of the mice was not affected by this treatment. F-1, Intravenous
injection of LDC decreased peritoneal dissemination nodules of PDAC in the mouse
appeared slim and normal. F-3, The multiple peritoneal disseminated nodules (arrows)
observed in the control. F-4, Laparotomy of controls revealed massive bloody ascites due
to active disseminated cancer nodules. F-5, Disseminated nodules at the surface of the
liver and nodules at the sub-diaphragmatic space (arrows). G, Kaplan-Meier survival
curves after LDC treatment in the PDAC dissemination mouse model (n=9 for each
group). The median number of days of survival in the control group (62 d) was
significantly improved by i.p. injection of 1 µg of LDC, resulting in 90-d survival of 7/9
mice (median survival=105 d). Notably, i.v. injection of 1 µg of LDC conferred a
comparable effect, with 90-d survival of 5/9 mice (median survival=90 d) (*P<0.05;
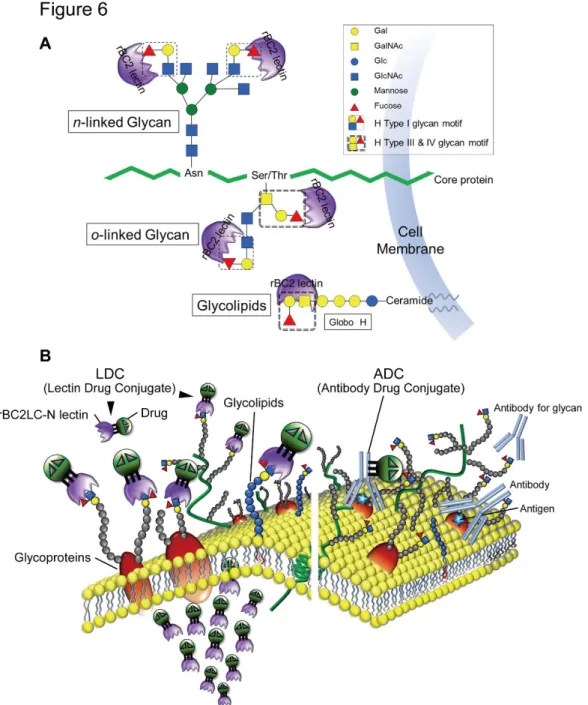
Fig. 6. A, Schema of rBC2LC-N lectin binding sites. rBC2LC-N is a TNF-like lectin molecule identified from the gram-negative bacterium B. cenocepacia, and this molecule
is revealed to be a fucose-binding lectin (17). Precise survey using a glycan array
containing 377 glycans revealed that the promising high-affinity ligands of rBC2LC-N
(Fucα1-2 Galβ1-3GalNAc), corresponding to two forms of the human blood group O
determinant. The H type 1 trisaccharide motifs are present at the end of branched N-linked
glycans and O-linked glycans. The proximate GalNAc in O-linked glycan could be a
source of the H Type III trisaccharide motif. The end glycolipid, i.e., βGalNAc attached
to the Globo H construct, could also be a source of the H type IV glycan motif. B, Schema
of rBC2LC-N lectin binding on the cancer cell surface. (right) The previous failure of antibody-drug conjugates (ADC) strategies may be due to the one-to-one relationship
between the cancer cell surface peptide antigen (blue star in brown glycoprotein) and the
antibody, which results in the delivery of an insufficient amount of the drug to cancer
cells. (left) In contrast, LDC binding sites could consist of multiple glycans on various
glycoproteins and glycolipids, resulting in the delivery of more drug to the surface of
target cells. In addition, the relatively large size of immunoglobulins tends to prevent
effective internalization of antibody-based drugs; however, the relatively small (16-kDa)
size of rBC2LC-N would facilitate effective endocytosis and the prominent cytocidal
8. Supplementary materials
Supplementary Figure S1. SDS-PAGE and HPLC of rBC2LCN-PE38 (LDC). The size exclusion-based FPLC demonstrated that rBC2LCN-PE38 forms various
multimers, including monomers, dimers, trimers and tetramers. The values of peak
voltage at 280 nm do not directly indicate the exact ratio of 4 monomers; however, dimers,
gels under various conditions demonstrate, the trimer is not the major form among the 4
multimers of rBC2LCN-PE38. However, the actual ratio among the 4 multimers in an in
Supplementary Figure S2. Analysis of cancer stem cell (CSC) marker expression in 6 PDAC cell lines. The expression of the known pancreatic CSC markers CD24, CD44, EpCAM, and CD133 (29,30) was analysed by flow cytometry. (A) Capan-1 cells
expressed 3 markers (CD44, EpCAM, and CD133), and BxPC-3 expressed 3 markers
(CD24, CD44, and EpCAM). The remaining 4 cell lines were positive for only 1 or 2
markers. Note that CD133 was expressed only in Capan-1 cells. (B) The panel of the
primary antibodies of CSC markers and isotypes used for negative control. (C) Summary
of the morphology and CSC marker expression results for the 6 PDAC cell lines. We
considered Capan-1 to be a valuable PDAC line that maintains morphology resembles
clinical PDAC, i.e. the dominant presentation of well-to-moderately preserved gland
formation and abundant stromal induction (31), together with CSC marker expressions.
Thus, we have focused Capan-1 cell as the tester cell line that may represent PDAC
Supplementary Figure S3. Top 10 highlighted lectins that bind specifically to Capan-1 cells. The signal intensities yielded by the Capan-Capan-1 cell line on the lectin microarray were compared with those of 5 other cell lines. The top 10 lectins displaying specific
differential reactivity in Capan-1 cells, including 8 lectins displaying increased reactivity
prominent difference in reactivity was rBC2; it had a higher signal intensity in the
Capan-1 cell line (32.2Capan-1±6.89) than in the other cell lines (6.20±3.0Capan-1, P=9.44E-Capan-17), followed by
ADA (P=7.05E-09) and TJA II (P=1.40E-08). rACG and PVL exhibited significantly
Supplementary Table S1.
Ten highlighted lectins with specific reactivity to the pancreatic cell line ‘Capan-1’ as
Supplementary Figure S4. Evaluation of the affinity between lectins and PDAC cell lines by flow cytometry using fluorescent labelling of the 10 lectins that were highlighted by lectin microarray. The results obtained with Capan-1 cells were consistent with the results of the lectin microarray analysis. In contrast, the flow
microarray data, likely because flow cytometry reflects only cell-surface reactivity
Supplementary Figure S5. Lectin histochemistry of mouse PDAC xenograft models. To confirm the results of the lectin microarray analysis, lectin histochemistry using 10
HRP-labelled lectins was performed on xenograft nodules derived from the 6 PDAC cell
lines. rBC2 exhibited strong membranous staining in Capan-1 xenografts and mosaic
The observations for rBC2 lectin were in good agreement with the results of the lectin
microarray and live-cell staining analyses. In contrast, staining of the other 9 lectins did
Supplementary Figure S6. Histochemical analysis of the top 10 highlighted lectins in a single PDAC sample. Histochemistry for 10 lectins was performed on serial sections
of a clinical PDAC sample. All lectins were labelled by horseradish peroxidase (HRP).
All lectins except rC14 displayed affinity for PDAC cells. The rACG, rWFA and rBPL
lectins (D, G and I) had weak affinity for cancer cells. The rADA, rTJA2, rPVL and rGC2
rBC2LC-N and rCrBC2LC-NL lectins (A, E) clearly recognized cancer cells and had no affinity for stromal
cells. However, rCNL likely has a higher affinity for mucus discharges from cancer cells
(E). Among the 10 lectins, rBC2LC-N lectin was identified as an excellent lectin for
Supplementary Table S2. Summary of recently reported immunotoxins and LDC with their targets and IC50s(32-48).
Target antigen malignancy Agents name Toxin IC50 Reference
IL-2R CLL Anti-Tac(Fv)-PE40KDEL PE 1.2~9 ng/ml Kreitman, R. J., et al. 1992
GP185/HER2 Breast Ovary Saporin Anti-GP185/HER2 IT SAP 0.43~1.1 nM Tecce, R., et al. 1993
IL-2R ATL CLL Anti-Tac(FV)-PE40 PE 0.04~ >1000 ng/ml Kreitman, R. J., et al. 1994
NCAM Lung cancer SEN7-PE PE 22~85 pM Zangemeister, U., et al. 1994
CD80 Hodgikin’s Anti-B7-1-saporina SAP 3.2 ng/ml Vooijs, W. C., et al. 1997
GRP Lung DAB389GRP DT 9.5 pM vanderSpek, J. C., et al. 1997
E4 Prostate E4PE35-KDEL PE 0.3-20 ng/ml Essand, M. and I. Pastan 1998
CD30 Hodgikin’s Ki-4(scFv)-ETA PE 43 pM Klimka, A., et al. 1999
CD22 lymphoma RFB4(dsFv)-PE38 PE38 0.4 ng/ml Kreitman, R. J., et al 1999
IL-13R Head and Neck IL13-PE38 PE38 3~7 ng/ml Kawakami, K., et al. 2001
IL-4R Pancreas IL4-PE38 PE38 0.3~0.5 ng/ml Kawakami, K., et al. 2002
EpCAM Head and Neck 4D5MOCB-ETA PE 0.005~0.2 pM Di Paolo, C., et al. 2003
GCSF AML DTU2GSF DT 5.8~34.7 pM Abi-Habib, R. J., et al. 2004
CD19 Blood FMC63(Fv)-PE38 PE38 0.6-14 ng/ml Du, X., et al. 2008
CD22 Blood RFB4(Fv)-PE38 PE38 50-550 ng/ml Du, X., et al. 2008
CD22 Blood B3(dsFv)-PE38 PE38 0.1-2.5 ng/ml Weldon, J. E., et al. 2009
CD30 Lymphoma SGN-35 MMAE 1.3 ng/ml Okeley, N. M., et al. 2010
mesothelin Pancreas RG7787 PE24 1.38~33.28 ng/ml Hollevoet, K., et al. 2014
HER2 Breast 4D5scFv-ETA PE40 22 nM Sokolova, E. A., et al. 2014
CD71 Pancreas HB21(Fv)-PE40 PE40 3~3.7 ng/ml Hollevoet, K., et al. 2015
Glypican-3 liver HN3-PE38 PE38 0.068 nM~ Gao, W., et al. 2015
1.04 pg/ml (0.0195 pM)
CLL; chronic lymphocytic leukemia, ATL: adult T-cell leckemia, PE; pseudomonas aerginosa exotoxin, DT; diphteria toxin, SAP; plant toxin saporin 6, MMAE; monomethylauristatin E,
Supplementary Figure S7.
Representative images of assays of erythrocytes from human volunteers. There was no
agglutination with the rBC2 lectin for any blood type (A, B, AB and O), in contrast to the
obvious agglutination at 0.78 μg/ml Concanavalin A, a positive-control lectin. This result
demonstrates that not all lectins possess hemagglutination activity, which would prevent
Supplementary Figure S8.
Clinical PDAC slides stained with H&E were examined for contaminating large arterial
vessels (arrows), and serial unstained slides were subjected to HRP-labelled rBC2LC-N
lectin histochemistry. All red blood cells in the vessels and white blood cells of patients
of all 4 blood types (A, B, AB and O) were negative, indicating that red blood cells are
administration of rBC2LC-N has little risk of causing hemagglutination (scale bars, 100
Supplementary Figure S9. The validation of the specificity of rBC2LC-N lectin by competition assay. MTT assay of LDC were carried out by adding competitive agents. A-1; free rBC2LC-N and B-1; target glycan (=fucose), demonstrating both were inhibited
in dose dependent manner. Live cells (Capan-1) was incubated with fluorescent labelled
B-2). Green signal were competitively inhibited by these agents. The IC50 value were
re-checked in different evaluation times and those by competitive inhibition assay were
Supplementary Figure S10. The rBC2LC-N lectin reactivity to human organs. Formalin-Fixed human tissues were stained with rBC2LC-N lectin. Positive reactivity to
rBC2LC-N in epithelial cells on the internal surface of the hollow organs (strongly in the
stomach, colon and uterine cervix) were evident, hence the staining in other organs were
9. References
1. Teicher BA, Doroshow JH. The promise of antibody-drug conjugates. N Engl J
Med 2012;367:1847-8.
2. Sharkey RM, McBride WJ, Cardillo TM, Govindan SV, Wang Y, Rossi EA, et
al. Enhanced Delivery of SN-38 to Human Tumor Xenografts with an
Anti-Trop-2-SN-38 Antibody Conjugate (Sacituzumab Govitecan). Clin Cancer Res
2015;21:5131-8.
3. Zhu Y, Choi SH, Shah K. Multifunctional receptor-targeting antibodies for
cancer therapy. Lancet Oncol 2015;16:e543-54.
4. Tarbell JM, Cancel LM. The glycocalyx and its significance in human medicine.
J Intern Med 2016;280:97-113.
5. Pinho SS, Reis CA. Glycosylation in cancer: mechanisms and clinical
implications. Nat Rev Cancer 2015;15:540-55.
6. Christiansen MN, Chik J, Lee L, Anugraham M, Abrahams JL, Packer NH. Cell
surface protein glycosylation in cancer. Proteomics 2014;14:525-46.
7. Reticker-Flynn NE, Bhatia SN. Aberrant glycosylation promotes lung cancer
metastasis through adhesion to galectins in the metastatic niche. Cancer Discov
8. Dingjan T, Spendlove I, Durrant LG, Scott AM, Yuriev E, Ramsland PA.
Structural biology of antibody recognition of carbohydrate epitopes and
potential uses for targeted cancer immunotherapies. Mol Immunol
2015;67:75-88.
9. Rahib L, Smith BD, Aizenberg R, Rosenzweig AB, Fleshman JM, Matrisian
LM. Projecting cancer incidence and deaths to 2030: the unexpected burden of
thyroid, liver, and pancreas cancers in the United States. Cancer Res
2014;74:2913-21.
10. Sharon N, Lis H. History of lectins: from hemagglutinins to biological
recognition molecules. Glycobiology 2004;14:53r-62r.
11. Belardi B, Bertozzi CR. Chemical Lectinology: Tools for Probing the Ligands
and Dynamics of Mammalian Lectins In Vivo. Chem Biol 2015;22:983-93.
12. Rabinovich GA, Croci DO. Regulatory circuits mediated by lectin-glycan
interactions in autoimmunity and cancer. Immunity 2012;36:322-35.
13. Deer EL, Gonzalez-Hernandez J, Coursen JD, Shea JE, Ngatia J, Scaife CL, et
al. Phenotype and genotype of pancreatic cancer cell lines. Pancreas
14. Kuno A, Uchiyama N, Koseki-Kuno S, Ebe Y, Takashima S, Yamada M, et al.
Evanescent-field fluorescence-assisted lectin microarray: a new strategy for
glycan profiling. Nat Methods 2005;2:851-6.
15. Hermann PC, Huber SL, Herrler T, Aicher A, Ellwart JW, Guba M, et al.
Distinct populations of cancer stem cells determine tumor growth and metastatic
activity in human pancreatic cancer. Cell Stem Cell 2007;1:313-23.
16. Li C, Heidt DG, Dalerba P, Burant CF, Zhang L, Adsay V, et al. Identification
of pancreatic cancer stem cells. Cancer Res 2007;67:1030-7.
17. Sulak O, Cioci G, Delia M, Lahmann M, Varrot A, Imberty A, et al. A TNF-like
trimeric lectin domain from Burkholderia cenocepacia with specificity for
fucosylated human histo-blood group antigens. Structure 2010;18:59-72.
18. Tateno H, Onuma Y, Ito Y, Minoshima F, Saito S, Shimizu M, et al. Elimination
of tumorigenic human pluripotent stem cells by a recombinant lectin-toxin
fusion protein. Stem Cell Reports 2015;4:811-20.
19. Alewine C, Hassan R, Pastan I. Advances in anticancer immunotoxin therapy.
20. Tateno H, Toyota M, Saito S, Onuma Y, Ito Y, Hiemori K, et al. Glycome
diagnosis of human induced pluripotent stem cells using lectin microarray. J
Biol Chem 2011;286:20345-53.
21. Zhang W, Zhu ZY. Structural modification of H histo-blood group antigen.
Blood Transfus 2015;13:143-9.
22. Stanley P, Cummings RD. Structures Common to Different Glycans. In: Ajit
Varki, Cummings RD, Esko JD, et al., editors. Essentials of Glycobiology 2nd
edition. New York: Cold Spring Harbor Laboratory Press; 2009.
23. Matsumura Y, Maeda H. A new concept for macromolecular therapeutics in
cancer chemotherapy: mechanism of tumoritropic accumulation of proteins and
the antitumor agent smancs. Cancer Res 1986;46:6387-92.
24. Akashi Y, Oda T, Ohara Y, Miyamoto R, Hashimoto S, Enomoto T, et al.
Histological advantages of the tumor graft: a murine model involving
transplantation of human pancreatic cancer tissue fragments. Pancreas
2013;42:1275-82.
25. Akashi Y, Oda T, Ohara Y, Miyamoto R, Kurokawa T, Hashimoto S, et al.
peptide in murine pancreatic cancer models that overexpressed neuropilin-1. Br
J Cancer 2014;110:1481-7.
26. Bach PB. New Math on Drug Cost-Effectiveness. N Engl J Med
2015;373:1797-9.
27. Hu D, Tateno H, Hirabayashi J. Lectin engineering, a molecular evolutionary
approach to expanding the lectin utilities. Molecules 2015;20:7637-56.
28. Hagiwara A, Takahashi T, Sawai K, Taniguchi H, Shimotsuma M, Okano S, et
al. Milky spots as the implantation site for malignant cells in peritoneal
dissemination in mice. Cancer Res 1993;53:687-92.
29. Li C, Heidt DG, Dalerba P, Burant CF, Zhang L, Adsay V, et al. Identification
of pancreatic cancer stem cells. Cancer Res 2007;67:1030-7.
30. Hermann PC, Huber SL, Herrler T, Aicher A, Ellwart JW, Guba M, et al.
Distinct populations of cancer stem cells determine tumor growth and metastatic
activity in human pancreatic cancer. Cell Stem Cell 2007;1:313-23.
31. Deer EL, Gonzalez-Hernandez J, Coursen JD, Shea JE, Ngatia J, Scaife CL, et
al. Phenotype and genotype of pancreatic cancer cell lines. Pancreas
32. Hollevoet K, Mason-Osann E, Muller F, Pastan I. Methylation-associated partial
down-regulation of mesothelin causes resistance to anti-mesothelin
immunotoxins in a pancreatic cancer cell line. PLoS One 2015;10:e0122462.
33. Gao W, Tang Z, Zhang YF, Feng M, Qian M, Dimitrov DS, et al. Immunotoxin
targeting glypican-3 regresses liver cancer via dual inhibition of Wnt signalling
and protein synthesis. Nature communications 2015;6:6536.
34. Hollevoet K, Mason-Osann E, Liu XF, Imhof-Jung S, Niederfellner G, Pastan I.
In vitro and in vivo activity of the low-immunogenic antimesothelin
immunotoxin RG7787 in pancreatic cancer. Mol Cancer Ther 2014;13:2040-9.
35. Okeley NM, Miyamoto JB, Zhang X, Sanderson RJ, Benjamin DR, Sievers EL,
et al. Intracellular activation of SGN-35, a potent anti-CD30 antibody-drug
conjugate. Clin Cancer Res 2010;16:888-97.
36. Weldon JE, Xiang L, Chertov O, Margulies I, Kreitman RJ, FitzGerald DJ, et al.
A protease-resistant immunotoxin against CD22 with greatly increased activity
against CLL and diminished animal toxicity. Blood 2009;113:3792-800.
37. Du X, Beers R, Fitzgerald DJ, Pastan I. Differential cellular internalization of
anti-CD19 and -CD22 immunotoxins results in different cytotoxic activity.
38. Abi-Habib RJ, Liu S, Bugge TH, Leppla SH, Frankel AE. A urokinase-activated
recombinant diphtheria toxin targeting the granulocyte-macrophage
colony-stimulating factor receptor is selectively cytotoxic to human acute myeloid
leukemia blasts. Blood 2004;104:2143-8.
39. Di Paolo C, Willuda J, Kubetzko S, Lauffer I, Tschudi D, Waibel R, et al. A
recombinant immunotoxin derived from a humanized epithelial cell adhesion
molecule-specific single-chain antibody fragment has potent and selective
antitumor activity. Clin Cancer Res 2003;9:2837-48.
40. Kawakami K, Kawakami M, Husain SR, Puri RK. Targeting interleukin-4
receptors for effective pancreatic cancer therapy. Cancer Res 2002;62:3575-80.
41. Kawakami K, Kawakami M, Joshi BH, Puri RK. Interleukin-13
receptor-targeted cancer therapy in an immunodeficient animal model of human head and
neck cancer. Cancer Res 2001;61:6194-200.
42. Klimka A, Barth S, Matthey B, Roovers RC, Lemke H, Hansen H, et al. An
anti-CD30 single-chain Fv selected by phage display and fused to Pseudomonas
exotoxin A (Ki-4(scFv)-ETA') is a potent immunotoxin against a
43. Essand M, Pastan I. Anti-prostate immunotoxins: cytotoxicity of E4
antibody-Pseudomonas exotoxin constructs. Int J Cancer 1998;77:123-7.
44. Vooijs WC, Otten HG, van Vliet M, van Dijk AJ, de Weger RA, de Boer M, et
al. B7-1 (CD80) as target for immunotoxin therapy for Hodgkin's disease. Br J
Cancer 1997;76:1163-9.
45. Zangemeister-Wittke U, Collinson AR, Frosch B, Waibel R, Schenker T, Stahel
RA. Immunotoxins recognising a new epitope on the neural cell adhesion
molecule have potent cytotoxic effects against small cell lung cancer. Br J
Cancer 1994;69:32-9.
46. Kreitman RJ, Bailon P, Chaudhary VK, FitzGerald DJ, Pastan I. Recombinant
immunotoxins containing anti-Tac(Fv) and derivatives of Pseudomonas
exotoxin produce complete regression in mice of an interleukin-2
receptor-expressing human carcinoma. Blood 1994;83:426-34.
47. Tecce R, Digiesi G, Savarese A, Trizio D, Natali PG. Characterization of
cytotoxic activity of saporin anti-gp185/HER-2 immunotoxins. Int J Cancer
1993;55:122-7.
48. Kreitman RJ, Chaudhary VK, Kozak RW, FitzGerald DJ, Waldman TA, Pastan I.
antibody to the interleukin-2 receptor kill malignant cells from patients with