著者
Norio Takata, Yuki Sugiura, Keitaro Yoshida,
Miwako Koizumi, Nishida Hiroshi, Kurara Honda,
Ryutaro Yano, Yuji Komaki, Ko Matsui, Makoto
Suematsu, Masaru Mimura, Hideyuki Okano,
Tanaka F. Kenji
journal or
publication title
Glia
volume
66
number
9
page range
2013-2023
year
2018-05-30
URL
http://hdl.handle.net/10097/00126969
doi: 10.1002/glia.23454Optogenetic astrocyte activation evokes BOLD fMRI response with oxygen consumption without neuronal
activity modulation
Journal: GLIA
Manuscript ID GLIA-00462-2017.R2 Wiley - Manuscript type: Original Research Article Date Submitted by the Author: n/a
Complete List of Authors: Takata, Norio; Keio Univ. Sch. of Med., Neuropsychiatry; Central Institute for Experimental Animals (CIEA)
Sugiura, Yuki; Keio Univ. Sch. of Med., Biochemistry Yoshida, Keitaro; Keio Univ. Sch. of Med., Neuropsychiatry Koizumi, Miwako; Keio Univ. Sch. of Med., Neuropsychiatry Hiroshi, Nishida; Keio Univ. Sch. of Med., Neuropsychiatry Honda, Kurara; Keio Univ. Sch. of Med., Biochemistry
Yano, Ryutaro; Keio University School of Medicine, Physiology Komaki, Yuji; Central Institute for Experimental Animals (CIEA) Matsui, Ko; Tohoku University, Graduate School of Life Sciences Suematsu, Makoto; Keio Univ. Sch. of Med., Biochemistry Mimura, Masaru; Keio Univ. Sch. of Med., Neuropsychiatry
Okano, Hideyuki; Keio Univ. Sch. of Med., Physiology; RIKEN Brain Science Institute
Tanaka, Kenji ; Keio University School of Medicine, Neuropsychiatry Key Words: astrocytes, optogenetics, BOLD, fMRI, imaging mass spectrometry
Table of Contents Image (TOCI) 58x52mm (300 x 300 DPI)
1
Optogenetic astrocyte activation evokes
1
BOLD fMRI response with oxygen consumption
2
without neuronal activity modulation
3
Running title: Astrocytes evoke BOLD fMRI response
4
Norio Takataa,b, Yuki Sugiurac, Keitaro Yoshidaa, Miwako Koizumia, Hiroshi Nishidaa, 5
Kurara Hondac, Ryutaro Yanod, Yuji Komakib, Ko Matsuie, Makoto Suematsuc, Masaru 6
Mimuraa, Hideyuki Okanod,f, Kenji F. Tanakaa 7
a. Department of Neuropsychiatry, Keio University School of Medicine, 35 8
Shinanomachi, Shinjuku, Tokyo 160-8582, Japan 9
b. Central Institute for Experimental Animals (CIEA), 3-25-12, Tonomachi, Kawasaki, 10
Kanagawa 210-0821, Japan 11
c. Department of Biochemistry, Keio University School of Medicine, 35 Shinanomachi, 12
Shinjuku, Tokyo 160-8582, Japan 13
d. Department of Physiology, Keio University School of Medicine, 35 Shinanomachi, 14
Shinjuku, Tokyo 160-8582, Japan 15
e. Super-network Brain Physiology, Graduate School of Life Sciences, Tohoku University, 16
Sendai, Miyagi 980-8575, Japan 17
f. Laboratory for Marmoset Neural Architecture, RIKEN Brain Science Institute, Wako, 18
Saitama 351-0198, Japan 19
Corresponding Authors 20
Norio Takata, Ph.D. Email: [email protected] 21
Kenji F. Tanaka, M.D., Ph.D. Email: [email protected] 22
Department of Neuropsychiatry, Keio University School of Medicine, 23
35 Shinanomachi, Shinjuku, Tokyo, 160-8582, Japan 24
Tel +81-3-5363-3934; 25
Acknowledgements
26We thank Dr. Kouichi C. Nakamura for a generous gift of an antibody. We also thank Dr. 27
Youcef Bouchekioua for his technical support. This work was supported by Takeda 28
Science Foundation to N.T.; JSPS KAKENHI Grant Numbers (25430011, 25115726, 29
15KT0111, 16H01620, and 16K07032 to N.T., 24111551 and 26290021 to K.F.T.); 30
Brain/MINDS and the Strategic Research Program for Brain Sciences (SRPBS) from the 31
Ministry of Education, Culture, Sports, Science, and Technology of Japan (MEXT) and 32
Japan Agency for Medical Research and Development (AMED) to N.T., K.F.T. and H.O.. 33
34
Word Count
35Total word count: 7382 (Abstract: 149, Introduction: 593, Materials and Methods: 215, 36
Results: 2175, Discussion: 998, References: 1910, Figure Legends: 987.) 37
Number of Pages: 33 38
Number of Tables: 0; Total number of figures: 4; Number of Color Images: 4 39 40
Table of Contents
41Main Points
42--- Optogenetic activation of astrocytes evoked BOLD signal that accompanied 43
oxygen consumption without modulation of neuronal activity. 44
--- Acetyl-carnitine was synthesized at the site of astrocyte-, but not neuron-evoked 45
BOLD signal. 46
3
Table of Contents Image (TOCI)
47
Abstract
49
Functional magnetic resonance imaging (fMRI) based on the blood oxygenation 50
level-dependent (BOLD) signal has been used to infer sites of neuronal activation in the 51
brain. A recent study demonstrated, however, unexpected BOLD signal generation 52
without neuronal excitation, which led us to hypothesize the presence of another cellular 53
source for BOLD signal generation. Collective assessment of optogenetic activation of 54
astrocytes or neurons, fMRI in awake mice, electrophysiological measurements, and 55
histochemical detection of neuronal activation, coherently suggested astrocytes as 56
another cellular source. Unexpectedly, astrocyte-evoked BOLD signal accompanied 57
oxygen consumption without modulation of neuronal activity. Imaging mass 58
spectrometry of brain sections identified synthesis of acetyl-carnitine via oxidative 59
glucose metabolism at the site of astrocyte-, but not neuron-evoked BOLD signal. Our 60
data provide causal evidence that astrocytic activation alone is able to evoke BOLD 61
signal response, which may lead to reconsideration of current interpretation of BOLD 62
signal as a marker of neuronal activation. 63
64
Keywords
65astrocytes; BOLD; optogenetics; fMRI; imaging mass spectrometry 66
5
Introduction
67
Blood oxygenation level-dependent (BOLD) functional magnetic resonance 68
imaging (fMRI) is a fundamental imaging tool in basic and clinical investigations of 69
human brain activity (Ogawa, Lee, Kay, & Tank, 1990). The BOLD signal is not a 70
direct measurement of neuronal activity; instead, the signal is influenced by cerebral 71
blood flow (CBF), cerebral blood volume (CBV), and the cerebral metabolic rate of 72
oxygen consumption (Ogawa, Menon, Kim, & Ugurbil, 1998; Shen, Ren, & 73
Duong, 2008). Despite the above caveats, the BOLD signal has been widely used as a 74
surrogate marker of neuronal activation, because accumulating evidence has 75
demonstrated a close correlation between BOLD signal response and 76
electrophysiological activation of neurons following sensory stimulation (Logothetis, 77
Pauls, Augath, Trinath, & Oeltermann, 2001; Niessing et al., 2005). Recent 78
optogenetic fMRI (ofMRI) studies have further confirmed the correlation (Kahn et al., 79
2013; Lee et al., 2010; Takata et al., 2015). However, the cellular mechanisms of 80
BOLD signal generation have not been fully elucidated (Ekstrom, 2010; Vanzetta & 81
Slovin, 2010). It is reported that coupling between BOLD and electrophysiological 82
signal in visual cortex of behaving monkeys is context dependent (Maier et al., 2008). 83
Furthermore, unexpected BOLD signal generation is found without activation of local 84
neurons in the visual cortex of monkeys performing a fixation-on-off task (Sirotin & 85
Das, 2009). 86
Astrocytes are also considered to participate in BOLD signal generation 87
(Haydon & Carmignoto, 2006; Otsu et al., 2015; Schummers, Yu, & Sur, 2008; Takano et 88
al., 2006), but in a passive way that just couples neuronal activity to the hemodynamic 89
response to fulfill metabolic demand of neurons (Petzold & Murthy, 2011; Raichle & 90
Mintun, 2006). A study that combined BOLD fMRI and fiber-optic calcium (Ca2+ ) 91
recording in the cortex of anesthetized rats during electrical paw stimulation reported a 92
correlation between prolonged BOLD signal components and Ca2+ surge in astrocytes, 93
and their modeling suggested involvement of astrocytes in a late component of the BOLD 94
response (Schulz et al., 2012). However, direct investigation of causal relationship 95
between astrocyte activation and BOLD signal generation seems difficult to examine in 96
the study, because sensory stimulation inevitably activates neurons in addition to 97
astrocytes. Moreover, a recent study reported intact BOLD signal response upon hindpaw 98
stimulation of anesthetized inositol 1,4,5-triphosphate receptor type 2 knock-out 99
(IP3R2-KO) mice, which lack large cytosolic Ca2+ surges in astrocytes, suggesting a 100
minor role of astrocytic Ca2+ activity in BOLD signal generation (Jego, 101
Pacheco-Torres, Araque, & Canals, 2014) (but see (Srinivasan et al., 2015; Stobart 102
et al., 2016) that demonstrate preserved Ca2+ dynamics in astrocytes of IP3R2-KO mice, 103
and (Mishra et al., 2016) that shows multiple sources of calcium signals in astrocytes). 104
Note that most of these studies were performed under anesthesia, which could affect 105
neurovascular coupling, energy metabolism, and BOLD signal generation (Masamoto & 106
Kanno, 2012; Sokoloff et al., 1977). 107
This study aimed to investigate a causal relationship between astrocyte activity 108
and BOLD signal generation using ofMRI in awake transgenic mice, whose cortical 109
neurons or astrocytes express channelrhodopsin-2 (ChR2) (Tanaka et al., 2012). 110
Optical activation of either neurons or astrocytes by light illumination through intact skull 111
evoked a BOLD signal response in the cortex. Oxygen consumption upon stimulation of 112
7
either neurons or astrocytes was suggested by experiments of ofMRI in the presence of a 113
vasodilator. Unexpectedly, optical activation of astrocytes did not modulate neuronal 114
activity, which was confirmed with in situ hybridization for c-fos mRNA and in vivo 115
electrophysiology. Metabolic underpinnings of the oxygen consumption was investigated 116
with metabolite imaging of brain sections using imaging mass spectrometry (IMS). 117
Activation of astrocytes, but not neurons, augmented synthesis of acetyl-carnitine (AC) 118
from glucose, which consumed oxygen. Collectively, our findings demonstrate 119
unexpected active role of astrocytes in BOLD signal generation. 120
121
Materials and Methods
122
fMRI in awake mice.
123We have elaborated fMRI in awake mice using a high signal-to-noise ratio 124
cryogenic MRI detector, CryoProbe (Yoshida et al., 2016). Confounding effects of 125
anesthetics during fMRI in awake mice were avoided because anesthesia is not necessary 126
with this protocol to place awake mice in an animal bed of MRI. 127
In vivo
multichannel extracellular recordings.
128Extracellular recording was performed as described previously (Takata et al., 129
2015). A 16-channel, linear silicon probe was inserted through a craniotomy (Φ 0.5 mm; 130
AP -3.0 mm, ML -2.0 mm) for recording from the cortex, which corresponds to the site of 131
global peak of BOLD signal response upon optogenetic astrocyte activation (Fig. 2c). 132
IMS with FMW-assisted brain fixation for
13C
6-glucose
133
metabolic pathway tracing.
134Two-dimensional imaging of metabolites in the brain slices by combining IMS, 135
FMW, and 13C-isotope was reported previously (Sugiura, Honda, Kajimura, & 136
Suematsu, 2014; Sugiura, Taguchi, & Setou, 2011). To trace the metabolic fate of 137
glucose, 13C6-glucose was injected intraperitoneally. Fifteen minutes later (Sugiura et 138
al., 2014), optogenetic stimulation of the left cortex through the intact skull was 139
performed. Thirty seconds later, mice were euthanized by FMW-irradiation for 0.96 s on 140
the brain (Sugiura, Honda, & Suematsu, 2015). Matrix-assisted laser desorption 141
ionization (MALDI)-IMS was performed on thin sections of the brain. See 142
Supplementary Materials and Methods for more details. 143
144
Results
145
Transcranial illumination of the cortex of awake mice
146that express ChR2(C128S) in neurons or astrocytes.
147Double transgenic animals that express ChR2(C128S), a step-function 148
opsin-type variant of ChR2 (Berndt, Yizhar, Gunaydin, Hegemann, & Deisseroth, 149
2009), were generated by crossing a tetO-ChR2(C128S)-YFP line with a cell-type 150
specific-tTA line (Tanaka et al., 2012); hereafter, we refer to 151
Chrm4-tTA::tetO-ChR2(C128S)-YFP and Mlc1-tTA::tetO-ChR2(C128S)-YFP double
152
transgenic lines as Neuron-ChR2 and Astrocyte-ChR2, respectively. For gene 153
manipulation strategies to generate transgenic mice, see Supplementary Fig. 1. 154
Expression of ChR2(C128S)-EYFP was observed in the cortex and sub-cortical brain 155
structures of both Neuron- and Astrocyte-ChR2 mice (Fig. 1a, d). Double 156
immunostaining for NeuN (neuron marker) and YFP (ChR2-marker) showed high 157
expression levels of ChR2(C128S) at neuronal somas in layer IV and at dendrites in layer 158
9
II/III of the cortex of Neuron-ChR2 mice (Fig. 1b, c). In Astrocyte-ChR2 mice, almost 159
uniform expression of ChR2(C128S) was observed throughout the cortical layers (Fig. 160
1e). The enlarged view of the staining reveals the expression pattern of ChR2(C128S) 161
with fine laminar morphology that is characteristic of astrocytes (Fig. 1f). Moreover, we 162
have shown co-expression of ChR2(C128S) and GLAST, an astrocyte specific glutamate 163
transporter, in the brain of Astrocyte-ChR2 mice (Tanaka et al., 2012), further 164
confirming astrocytic expression of ChR2(C128S). Expression of ChR2(C128S) across a 165
wide cortical area in these transgenic mice lines allows transcranial manipulation of 166
neuronal or astrocytic activity because ChR2(C128S) has higher sensitivity than 167
conventional ChR2 (Mattis et al., 2012). 168
To perform light illumination through the intact skull of awake mice during 169
fMRI experiments, a skull-holder and an optic fiber were attached horizontally on the 170
skull (Yoshida et al., 2016). fMRI on awake mice is advantageous to avoid the 171
confounding effects of anesthetics on neuronal and astrocytic activity (Greenberg, 172
Houweling, & Kerr, 2008; Thrane et al., 2012). The tip of an optic fiber was 173
positioned on the intact skull over the left visual cortex (Fig. 1g, h, i). 174
Optogenetic stimulation of astrocytes as well as
175neurons evokes BOLD signal response.
176We investigated whether transcranial photo-activation of neurons or astrocytes 177
was able to induce a BOLD signal response using Neuron- or Astrocyte-ChR2 mice, 178
respectively. Transcranial manipulation is desirable to avoid inserting an optic fiber into 179
the brain, which may result in “reactive astrocytes” with distinct physiological 180
characteristics (Aguado, Espinosa-Parrilla, Carmona, & Soriano, 2002). We 181
applied a pair of blue and yellow lights with 30 s separation, which kept a cation channel 182
of ChR2(C128S) open for 30 s. This pair of lights was repeated 3 times at an interval of 2 183
min. The duration of each light was 0.5 and 5.0 s for Neuron- and Astrocyte-ChR2 mice, 184
respectively. We employed longer illumination in Astrocyte-ChR2 mice because we 185
speculated that effect of optogenetic stimulation was smaller in astrocytes, considering 186
that astrocytic membrane resistance is lower than neurons. 187
We found that transcranial optogenetic stimulation of either neurons or 188
astrocytes could evoke a BOLD signal response in the cortex (Fig. 2a, c). The response 189
was observed dominantly in the left cortex, which was ipsilateral to the site of light 190
illumination. The most significant BOLD signal response was evoked within the cortex of 191
Neuron- and Astrocyte-ChR2 mice (arrows in Fig. 2a, c). Subcortical BOLD signal 192
response may reflect direct photo-activation, based on our measurements of ofMRI using 193
a triple transgenic mouse whose astrocytes express ChR2(C128S) except in the cortex 194
(see Supplementary Results and Supplementary Fig. 2a-d). In addition, light illumination 195
for optogenetic stimulation seemed not enough to evoke BOLD signal response through 196
visual stimulation nor brain-tissue heating (see Supplementary Results and 197
Supplementary Fig. 3a, b). Further, open field test and ofMRI using anesthetized
198
Astrocyte-ChR2 mice suggested that behavioral state-change, which may cause 199
widespread astrocyte excitation in the brain, seemed not to contaminate BOLD signal 200
fluctuation upon optogenetic stimulation of astrocytes (see Supplementary Results, 201
Supplementary Fig. 2e, f, and Supplementary Fig. 4). 202
We compared temporal dynamics of BOLD signal fluctuations at the site of the 203
most significant response upon optogenetic stimulation of Neuron- or Astrocyte-ChR2 204
11
mice, respectively (arrows in Fig. 2a, c). A BOLD signal response could be evoked 205
repeatedly in both Neuron- and Astrocyte-ChR2 mice (Fig. 2b, d). Peak amplitudes of the 206
response during the first stimulation period, i.e., 30 s-period between a pair of blue and 207
yellow vertical lines (Fig. 2b, d), were significantly higher for Neuron- than 208
Astrocyte-ChR2 mice (6.1 ± 0.4% versus 4.7 ± 0.5%, P = 0.03, n = 12 and 9 animals for 209
Neuron- and Astrocyte-ChR2 mice, respectively; two-sample t-test). The magnitude of
210
the BOLD signal response was dependent on the light intensities (Supplementary Fig. 3c, 211
d). 212
Oxygen consumption is elicited by optogenetic
213stimulation of either astrocytes or neurons.
214Because BOLD signal has been considered to reflect augmentation of the 215
metabolic demand of neurons (Heeger & Ress, 2002), we addressed whether 216
astrocyte-evoked BOLD signal response resulted in oxygen consumption. We performed 217
ofMRI after injection of a nitric oxide-releasing vasodilator, sodium nitroprusside (SNP), 218
so that oxygen consumption could be detected as negative deflection of the BOLD signal 219
(Nagaoka et al., 2006). 220
Neuronal activation by optogenetic stimulation using Neuron-ChR2 mice in the 221
presence of SNP resulted in a negative BOLD response (Fig. 2e, f), which was in good 222
accordance with previous studies (Nagaoka et al., 2006; Tsurugizawa, Ciobanu, & 223
Le Bihan, 2013). The location of the most significant negative BOLD signal was 224
similar to that of the positive BOLD response in ofMRI experiments without SNP 225
(compare arrows in Fig. 2a and e). The negative deflection of the BOLD signal occurred 226
only once, followed by a gradual increase that exceeded baseline (Fig. 2f) (see below). 227
Astrocyte activation by optogenetic stimulation using Astrocyte-ChR2 mice in 228
the presence of SNP also resulted in a negative BOLD response (Fig. 2g, h), which 229
suggests that activation of astrocytes results in oxygen consumption. The location of the 230
most significant negative BOLD signal was comparable to that of the positive BOLD 231
response in ofMRI experiments without SNP (compare arrows in Fig. 2c and g). Negative 232
deflection of the BOLD response was observed only once to the first optogenetic 233
stimulation of astrocytes (Fig. 2h), which was similar to the result in Neuron-ChR2 mice 234
(Fig. 2f), although the gradual increase of the BOLD signal after the first optogenetic 235
stimulation was not as clear as that in Neuron-ChR2 mice. 236
It’s not clear in this study why negative deflection was hardly induced by the 237
second and the third illumination on Neuron- or Astrocyte-ChR2 mice. BOLD signal is 238
assumed to reflect increase of 1) blood volume, 2) blood flow, and 3) oxygenation in the 239
blood (Shen et al., 2008). Considering that SNP suppresses the first two factors, gradual 240
increase of BOLD signals might indicate physiological response to suppress oxygen 241
consumption in the brain in the presence of SNP after the first optical stimulation. This 242
might explain the absence of negative BOLD response upon the second and the third 243
illumination. 244
Neuronal activation is not observed by optogenetic
245stimulation of astrocytes.
246Because BOLD signal is used as a marker of neuronal activation, we examined 247
the modulation of neuronal activity upon optogenetic stimulation of Neuron- or 248
Astrocyte-ChR2 mice. We first performed in situ hybridization for c-fos mRNA, a
249
neuronal activity marker, to obtain the spatial distribution of neuronal activation. Animals 250
were perfused 30 min after optogenetic stimulation, and then post-fixed, sliced, and 251
13 stained for c-fos mRNA.
252
Neuronal activation of Neuron-ChR2 mice increased c-fos mRNA staining in the
253
ipsilateral cortex to the site of light illumination (Fig. 3a), which is consistent with 254
previous reports (Stark, Davies, Williams, & Luckman, 2006). Unexpectedly, 255
astrocyte activation of Astrocyte-ChR2 mice did not augment c-fos mRNA staining (Fig.
256
3b). We quantified staining intensity for c-fos mRNA in the left and right cortex (blue and
257
red rectangles in Fig. 3a, b, respectively) by calculating their mean pixel values. While 258
Neuron-ChR2 mice showed significantly higher staining for c-fos mRNA in the left
259
cortex than that in the right cortex (107 ± 3 versus 83 ± 7 in the left and right cortex, P =
260
0.02, n = 9 mice, paired t-test; Fig. 3a), Astrocyte-ChR2 mice showed comparable
261
staining for c-fos mRNA in the left and right cortex (79 ± 6 versus 79 ± 6 in the left and
262
right cortex, P = 0.86, n = 9 mice, paired t-test; Fig. 3b).
263
This result cannot distinguish the following possibilities: 1) optogenetic 264
activation of astrocytes indeed did not modulate neuronal activity, or 2) it did modulate 265
neuronal activity, but was not enough to increase expression of c-fos mRNA. To directly
266
examine neuronal activity upon optogenetic stimulation of neurons or astrocytes, we next 267
performed electrophysiological recording in the cortex of awake, head-fixed Neuron- or 268
Astrocyte-ChR2 mice, using a linear 16-channel silicon probe electrode. This was a 269
separate experiment to the ofMRI. Again, we observed neuronal activation upon 270
optogenetic stimulation of Neuron-, but not of Astrocyte-ChR2 mice (Fig. 3c-f), 271
supporting the first possibility. 272
Specifically, in Neuron-ChR2 mice, local field potential (LFP) power at the 273
gamma and high frequency oscillation (HFO) significantly increased at the beginning of 274
the stimulation, followed by a gradual decrease (Fig. 3c). Average power of LFP at 275
gamma and HFO during the period of the first light-activation was significantly higher 276
than that during the pre-stimulus period (bar graph at lower right of Fig. 3c; 6.3 ± 1.2 and 277
2.0 ± 0.6 for gamma and HFP; P = 0.003 and 0.02, respectively; n = 6 mice, paired t-test). 278
Multi-unit activities (MUA) in the cortex were also augmented by the optogenetic 279
stimulation of Neuron-ChR2 mice (Fig. 3e). The mean relative number of spikes during 280
the first activation period (60~90 s) was significantly higher than that during the 281
pre-stimulus period (lower panel of Fig. 3e; 3.4 ± 0.6, P = 0.01, n = 6 mice, paired t-test).
282
These results are in good accordance with previous reports (Kahn et al., 2013; Lee et 283
al., 2010; Takata et al., 2015). 284
In Astrocyte-ChR2 mice, optogenetic activation of astrocytes did not modulate 285
LFP power (Fig. 3d). The average power of LFP during the first light activation period 286
was not different from that during the pre-stimulus period (bar graph at lower right of Fig. 287
3d; -0.2 ± 0.3, -0.5 ± 0.4, -0.4 ± 0.4, and -0.1 ± 0.3 for delta, theta, gamma, and HFO, 288
respectively, P > 0.25, n = 5 mice, paired t-test). Neither was MUA modulated (mean
289
relative number of spikes during the first activation period: 1.3 ± 0.2, P = 0.22, n = 5 mice,
290
paired t-test).
291
Illumination using only yellow light did not evoke electrophysiological response 292
in Neuron- or Astrocyte-ChR2 mice (Supplementary Fig. 5a–d). The magnitude of 293
electrophysiological response was dependent on intensities of blue light (Supplementary 294
Fig. 5e–h). These results were consistent with that of ofMRI (Supplementary Fig. 3). 295
15
13
C
6-glucose is metabolized into
13C
2-AC by optogenetic
296
activation of astrocytes, but not neurons.
297We asked whether neuron- or astrocyte-evoked BOLD signal was underlain by 298
the same metabolic activity because astrocyte-evoked BOLD signal accompanied oxygen 299
consumption without neuronal activation (Fig. 2 and 3). We used IMS to examine 300
two-dimensional distribution of brain metabolites upon optogenetic stimulation of 301
Neuron- or Astrocyte-ChR2 mice (n = 3 and 5 mice, respectively). Intraperitoneal 302
injection of 13C-isotope labeled glucose (13C6-glucose) was performed fifteen minutes 303
before optogenetic stimulation, which allowed us to trace flows of 13C from glucose to 304
various metabolites (Fig. 4a, b). Transcranial light illumination for optogenetic 305
stimulation of neurons or astrocytes was executed as before. Thirty seconds after the 306
stimulation, focused microwave (FMW) irradiation was applied for 0.92 s to the head of 307
the mouse to rapidly inactivate enzymatic reactions in the brain, which minimizes 308
postmortem alterations in metabolites during brain extraction (Sugiura et al., 2015). 309
Brains were then extracted, frozen, and sliced coronally at a thickness of 8 µm. The 310
spatial distribution of 13C-containing metabolites that were synthesized from 311
13
C6-glucose was explored and visualized using IMS. 312
Optogenetic stimulation of astrocytes, but not neurons, resulted in an increase of 313
non-labeled AC and 13C2-AC at the site of light illumination in the cortex (Fig. 4c and d, 314
middle row), suggesting that AC was metabolized from glucose via oxidative 315
decarboxylation of pyruvate to produce acetyl-CoA followed by transfer of acetyl-group 316
to carnitine (Fig. 4b). Concomitantly, reduction of carnitine, a substrate for AC synthesis, 317
was observed at the same region in the brain of Astrocyte-ChR2 mice (dotted circles in 318
Fig. 4d, upper right panel), indicating that synthesis of AC from acetyl-CoA and carnitine 319
occurred in the brain. Spatial patterns of fluctuation of these metabolites were similar to 320
that of the BOLD signal response upon astrocyte activation (compare Fig. 2c with the 321
bottom panels of Fig. 4d or Supplementary Fig. 6a), implying that astrocyte activation 322
accelerated the metabolic pathway that produces AC in the brain. Notably, optogenetic 323
stimulation of astrocytes did not result in accumulation of NADH (Supplementary Fig. 6b, 324
upper right panel). This suggests the presence of oxidative conversion of NADH to NAD+ 325
by mitochondrial complex I activity (Fig. 4b). These imaging results were also supported 326
by a capillary electrophoresis (CE)-electrospray ionization (ESI)-mass spectrometry 327
(MS) technique (Morikawa et al., 2012; Sugiura et al., 2016) (Supplementary Fig. 328
7). Taken together, these results suggest that while comparable a BOLD signal response 329
was evoked by optogenetic stimulation of either neurons or astrocytes, the respective 330
BOLD signal fluctuations were accompanied by distinct metabolic flows. 331
332
Discussion
333
We demonstrated that 1) selective stimulation of astrocytes is sufficient for the 334
induction of a BOLD signal response with oxygen consumption in the absence of 335
neuronal activation, and 2) activation of astrocytes, but not neurons, resulted in glucose 336
oxidation with production of AC, which is known to modulate neuronal energy processes 337
(Pettegrew, Levine, & McClure, 2000; Traina, 2016). Our data present a causal 338
relationship between astrocyte activation and BOLD signal generation, suggesting that 339
BOLD signal fluctuations can reflect metabolic demands of astrocytes in addition to 340
neurons. These findings may challenge the current interpretation of the BOLD signal 341
response as a surrogate marker of neuronal activation in fMRI studies (Figley & 342
17 Stroman, 2011; Gurden, 2013).
343
The physiological relevance of optogenetic stimulation of astrocytes has not 344
been resolved completely, while increasingly many studies have recently employed 345
optogenetic manipulation of astrocytes to utilize its advantages to shift the states of 346
astrocytes non-invasively with cell-type specificity (Figueiredo et al., 2014; Gourine 347
et al., 2010; Masamoto et al., 2015; Pelluru, Konadhode, Bhat, & Shiromani, 348
2016; Perea, Yang, Boyden, & Sur, 2014; Sasaki et al., 2012; Tanaka et al., 349
2012; Tang et al., 2014). The responses of astrocytes upon optogenetic activation have 350
been reported as a few mV of depolarization, pH decrease, and cytosolic Ca2+ surge 351
(Beppu et al., 2014; Perea et al., 2014; Sasaki et al., 2012), which can be 352
observed in physiological situations (MacVicar, Crichton, Burnard, & Tse, 1987; Rose & 353
Ransom, 1996; Seigneur, Kroeger, Nita, & Amzica, 2006; Takata et al., 2011). 354
Among the above three responses, depolarization of astrocytes might be the 355
primary cause for BOLD signal induction in the current study, because we reported 356
previously that astrocytic depolarization was coupled to efflux of potassium ions, a potent 357
vasodilator, from astrocytes (Masamoto et al., 2015; Sasaki et al., 2012). Although we 358
have shown that only ~5 mV depolarization was evoked with significantly larger light 359
power (7 mW/mm2 blue light illumination for 10 s; see Supplementary Materials and 360
Methods) on Bergmann glial cells (astrocytes in the cerebellum) in slice preparation from 361
young Astrocyte-ChR2 mice (postnatal day 17 to 24), we have also demonstrated that 362
amplitude of optogenetically induced inward currents developed age-dependent manner 363
(Sasaki et al., 2012), suggesting that effect of optogenetic stimulation is larger in the 364
current study that uses adult Astrocyte-ChR2 mice. 365
In the current study, optogenetic stimulation of astrocytes did not significantly 366
activate neurons, which may appear inconsistent with previous reports that showed 367
induction of c-fos mRNA in neuronal and/or glial cells upon optogenetic activation of 368
astrocytes in the cortex or cerebellum using Astrocyte-ChR2 mice (Sasaki et al., 2012; 369
Tanaka et al., 2012). While light intensity at the tip of the optic fiber was comparable 370
among studies, the layout of the optic fiber differed: earlier studies placed an optic fiber 371
perpendicular to the cranial skull, while the fiber was placed horizontally in the present 372
study. Thus, it is conceivable that less light reached the brain in the current study, which 373
may explain the lack of modulation of neuronal activity upon optogenetic manipulation 374
of astrocytes. In line with this, astrocytes show distinct physiological response depending 375
on stimulation intensity (Sekiguchi et al., 2016). It is possible that previous studies 376
employed light illumination that was strong enough to modulate neuronal activity, 377
because most of the studies used neuronal response as a readout for optogenetic 378
manipulation of astrocytes. It should be noted, however, that axonal activity cannot be 379
detected with our extracellular electrodes. Therefore, the current study cannot exclude a 380
possibility that optogenetic manipulation of astrocytes might have modulated axonal 381
activity (Tang et al., 2014), which may lead to BOLD signal generation. Note that even 382
in this case, our results support the idea of causal involvement of astrocytes in BOLD 383
signal generation. 384
Optogenetic stimulation of astrocytes resulted in unexpected oxygen 385
consumption without neuronal activation. We have previously shown that optogenetic 386
activation of astrocytes results in potassium efflux from astrocytes (Masamoto et al., 387
2015), which should be followed by restoration of the ionic gradient of astrocytes by 388
19
Na+-/K+-ATPase. Thus, synthesis of adenosine triphosphate (ATP) might be a candidate 389
to account for the oxygen consumption, although we did not observe a significant 390
increase in ATP upon optogenetic stimulation of astrocytes (Supplementary Fig. 6). AC 391
might be another candidate for oxygen consumption upon optogenetic astrocyte 392
activation, because metabolism from glucose to AC involves production of NADH, an 393
electron donor that transfers an electron to molecular oxygen during oxidative 394
phosphorylation in mitochondria (Fig. 4b). In accord with this idea, NADH was not 395
accumulated (Supplementary Fig. 6) while AC synthesis was evident (Fig. 4d) upon 396
optogenetic stimulation of astrocytes, suggesting consumption of a molecular oxygen by 397
oxidization of NADH to NAD+ in mitochondria (Fig. 4b). See Supplementary Discussion 398
on the possibility of AC as an energy substrate for neurons. 399
The BOLD signal response has been used to infer activation of neurons because 400
accumulating evidence has shown a close correlation between BOLD signal fluctuations 401
and electrophysiological activation of neurons (Logothetis et al., 2001; Niessing et 402
al., 2005). However, in the present study, we demonstrated that astrocytes can evoke a 403
BOLD signal response that accompanies oxygen consumption without activation of local 404
neurons. This may suggest the existence of BOLD signal fluctuations that are irrelevant 405
to activation of local neurons. Indeed, a recent study found unexpected BOLD signal 406
fluctuations that occurred without activation of local neurons during a repeated 407
anticipation task (Sirotin & Das, 2009). Activation of astrocytes might be a cellular 408
substrate underlying this type of BOLD signal fluctuation. What physiological 409
mechanism might stimulate astrocytes without activation of local neurons? One 410
possibility might be the release of neuromodulator(s) from axonal fibers of distant origin. 411
It’s shown that astrocytes are sensitive to neuromodulators such as acetylcholine and 412
noradrenalin, which can be released in the cortex by axonal fibers ascending from the 413
Meynert nucleus or Locus coeruleus, respectively (Bekar, He, & Nedergaard, 2008; 414
Pankratov & Lalo, 2015; Takata et al., 2011). Thus, astrocytes may be able to 415
respond to neuromodulatory activity of remote neurons, by augmenting metabolic 416
activity including synthesis of AC that can be used as preparatory energy fuel for local 417
neurons. 418
21
References
419
Aguado, F., Espinosa-Parrilla, J. F., Carmona, M. A., & Soriano, E. (2002). Neuronal 420
activity regulates correlated network properties of spontaneous calcium transients 421
in astrocytes in situ. The Journal of Neuroscience, 22 (21), 9430–9444.
422
Bekar, L. K., He, W., & Nedergaard, M. (2008). Locus coeruleus 423
alpha-adrenergic-mediated activation of cortical astrocytes in vivo. Cerebral
424
Cortex, 18 (12), 2789–2795. doi:10.1093/cercor/bhn040
425
Beppu, K., Sasaki, T., Tanaka, K. F., Yamanaka, A., Fukazawa, Y., Shigemoto, R., & 426
Matsui, K. (2014). Optogenetic countering of glial acidosis suppresses glial 427
glutamate release and ischemic brain damage. Neuron, 81 (2), 314–320.
428
doi:10.1016/j.neuron.2013.11.011 429
Berndt, A., Yizhar, O., Gunaydin, L. A., Hegemann, P., & Deisseroth, K. (2009). 430
Bi-stable neural state switches. Nature Neuroscience, 12 (2), 229–234.
431
doi:10.1038/nn.2247 432
Ekstrom, A. (2010). How and when the fMRI BOLD signal relates to underlying neural 433
activity: The danger in dissociation. Brain Research Reviews, 62 (2), 233–244.
434
doi:10.1016/j.brainresrev.2009.12.004 435
Figley, C. R., & Stroman, P. W. (2011). The role(s) of astrocytes and astrocyte activity in 436
neurometabolism, neurovascular coupling, and the production of functional 437
neuroimaging signals. The European Journal of Neuroscience, 33 (4), 577–588.
438
doi:10.1111/j.1460-9568.2010.07584.x 439
Figueiredo, M., Lane, S., Stout, R. F., Liu, B., Parpura, V., Teschemacher, A. G., & 440
Kasparov, S. (2014). Comparative analysis of optogenetic actuators in cultured 441
astrocytes. Cell Calcium, 56 (3), 208–214. doi:10.1016/j.ceca.2014.07.007 442
Gourine, A. V., Kasymov, V., Marina, N., Tang, F., Figueiredo, M. F., Lane, S., … 443
Kasparov, S. (2010). Astrocytes Control Breathing Through pH-Dependent 444
Release of ATP. Science, 329 (5991), 571–575. doi:10.1126/science.1190721
445
Greenberg, D. S., Houweling, A. R., & Kerr, J. N. D. (2008). Population imaging of 446
ongoing neuronal activity in the visual cortex of awake rats. Nature Neuroscience,
447
11 (7), 749–751. doi:10.1038/nn.2140
448
Gurden, H. (2013). Astrocytes: can they be the missing stars linking neuronal activity to 449
neurofunctional imaging signals? Frontiers in Cellular Neuroscience, 7.
450
doi:10.3389/fncel.2013.00021 451
Haydon, P. G., & Carmignoto, G. (2006). Astrocyte Control of Synaptic Transmission 452
and Neurovascular Coupling. Physiological Reviews, 86 (3), 1009–1031.
453
doi:10.1152/physrev.00049.2005 454
Heeger, D. J., & Ress, D. (2002). What does fMRI tell us about neuronal activity? Nature
455
Reviews. Neuroscience, 3 (2), 142–151. doi:10.1038/nrn730
456
Jego, P., Pacheco-Torres, J., Araque, A., & Canals, S. (2014). Functional MRI in mice 457
lacking IP3-dependent calcium signaling in astrocytes. Journal of Cerebral Blood
458
Flow and Metabolism, 34 (10), 1599–1603. doi:10.1038/jcbfm.2014.144
459
Kahn, I., Knoblich, U., Desai, M., Bernstein, J., Graybiel, A. M., Boyden, E. S., … Moore, 460
C. I. (2013). Optogenetic drive of neocortical pyramidal neurons generates fMRI 461
signals that are correlated with spiking activity. Brain Research, 1511, 33–45.
462
doi:10.1016/j.brainres.2013.03.011 463
Lee, J. H., Durand, R., Gradinaru, V., Zhang, F., Goshen, I., Kim, D.-S., … Deisseroth, K. 464
23
(2010). Global and local fMRI signals driven by neurons defined optogenetically 465
by type and wiring. Nature, 465 (7299), 788–792. doi:10.1038/nature09108 466
Logothetis, N. K., Pauls, J., Augath, M., Trinath, T., & Oeltermann, A. (2001). 467
Neurophysiological investigation of the basis of the fMRI signal. Nature, 412
468
(6843), 150–157. doi:10.1038/35084005 469
MacVicar, B. A., Crichton, S. A., Burnard, D. M., & Tse, F. W. (1987). Membrane 470
conductance oscillations in astrocytes induced by phorbol ester. Nature, 329
471
(6136), 242–243. doi:10.1038/329242a0 472
Maier, A., Wilke, M., Aura, C., Zhu, C., Ye, F. Q., & Leopold, D. A. (2008). Divergence 473
of fMRI and neural signals in V1 during perceptual suppression in the awake 474
monkey. Nature Neuroscience, 11 (10), 1193–1200. doi:10.1038/nn.2173
475
Masamoto, K., & Kanno, I. (2012). Anesthesia and the quantitative evaluation of 476
neurovascular coupling. Journal of Cerebral Blood Flow and Metabolism, 32 (7),
477
1233–1247. doi:10.1038/jcbfm.2012.50 478
Masamoto, K., Unekawa, M., Watanabe, T., Toriumi, H., Takuwa, H., Kawaguchi, H., … 479
Suzuki, N. (2015). Unveiling astrocytic control of cerebral blood flow with 480
optogenetics. Scientific Reports, 5, 11455. doi:10.1038/srep11455
481
Mattis, J., Tye, K. M., Ferenczi, E. A., Ramakrishnan, C., O’Shea, D. J., Prakash, R., … 482
Deisseroth, K. (2012). Principles for applying optogenetic tools derived from 483
direct comparative analysis of microbial opsins. Nature Methods, 9 (2), 159–172.
484
doi:10.1038/nmeth.1808 485
Mishra, A., Reynolds, J. P., Chen, Y., Gourine, A. V., Rusakov, D. A., & Attwell, D. 486
(2016). Astrocytes mediate neurovascular signaling to capillary pericytes but not 487
to arterioles. Nature Neuroscience, 19 (12), 1619–1627. doi:10.1038/nn.4428 488
Morikawa, T., Kajimura, M., Nakamura, T., Hishiki, T., Nakanishi, T., Yukutake, Y., … 489
Suematsu, M. (2012). Hypoxic regulation of the cerebral microcirculation is 490
mediated by a carbon monoxide-sensitive hydrogen sulfide pathway. Proceedings
491
of the National Academy of Sciences, 109 (4), 1293–1298.
492
doi:10.1073/pnas.1119658109 493
Nagaoka, T., Zhao, F., Wang, P., Harel, N., Kennan, R. P., Ogawa, S., & Kim, S.-G. 494
(2006). Increases in oxygen consumption without cerebral blood volume change 495
during visual stimulation under hypotension condition. Journal of Cerebral Blood
496
Flow and Metabolism, 26 (8), 1043–1051. doi:10.1038/sj.jcbfm.9600251
497
Niessing, J., Ebisch, B., Schmidt, K. E., Niessing, M., Singer, W., & Galuske, R. A. W. 498
(2005). Hemodynamic signals correlate tightly with synchronized gamma 499
oscillations. Science (New York, N.Y.), 309 (5736), 948–951.
500
doi:10.1126/science.1110948 501
Ogawa, S., Lee, T. M., Kay, A. R., & Tank, D. W. (1990). Brain magnetic resonance 502
imaging with contrast dependent on blood oxygenation. Proceedings of the
503
National Academy of Sciences of the United States of America, 87 (24), 9868–
504
9872. 505
Ogawa, S., Menon, R. S., Kim, S. G., & Ugurbil, K. (1998). On the characteristics of 506
functional magnetic resonance imaging of the brain. Annual Review of Biophysics
507
and Biomolecular Structure, 27, 447–474. doi:10.1146/annurev.biophys.27.1.447
508
Otsu, Y., Couchman, K., Lyons, D. G., Collot, M., Agarwal, A., Mallet, J.-M., … Charpak, 509
S. (2015). Calcium dynamics in astrocyte processes during neurovascular 510
25
coupling. Nature Neuroscience, 18 (2), 210–218. doi:10.1038/nn.3906 511
Pankratov, Y., & Lalo, U. (2015). Role for astroglial α1-adrenoreceptors in 512
gliotransmission and control of synaptic plasticity in the neocortex. Frontiers in
513
Cellular Neuroscience, 9, 230. doi:10.3389/fncel.2015.00230
514
Pelluru, D., Konadhode, R. R., Bhat, N. R., & Shiromani, P. J. (2016). Optogenetic 515
stimulation of astrocytes in the posterior hypothalamus increases sleep at night in 516
C57BL/6J mice. The European Journal of Neuroscience, 43 (10), 1298–1306.
517
doi:10.1111/ejn.13074 518
Perea, G., Yang, A., Boyden, E. S., & Sur, M. (2014). Optogenetic astrocyte activation 519
modulates response selectivity of visual cortex neurons in vivo. Nature
520
Communications, 5. doi:10.1038/ncomms4262
521
Pettegrew, J. W., Levine, J., & McClure, R. J. (2000). Acetyl-L-carnitine 522
physical-chemical, metabolic, and therapeutic properties: relevance for its mode 523
of action in Alzheimer’s disease and geriatric depression. Molecular Psychiatry, 5
524
(6), 616–632. 525
Petzold, G. C., & Murthy, V. N. (2011). Role of Astrocytes in Neurovascular Coupling. 526
Neuron, 71 (5), 782–797. doi:10.1016/j.neuron.2011.08.009
527
Raichle, M. E., & Mintun, M. A. (2006). Brain work and brain imaging. Annual Review of
528
Neuroscience, 29, 449–476. doi:10.1146/annurev.neuro.29.051605.112819
529
Rose, C. R., & Ransom, B. R. (1996). Mechanisms of H+ and Na+ Changes Induced by 530
Glutamate, Kainate, and d-Aspartate in Rat Hippocampal Astrocytes. The Journal
531
of Neuroscience, 16 (17), 5393–5404.
532
Sasaki, T., Beppu, K., Tanaka, K. F., Fukazawa, Y., Shigemoto, R., & Matsui, K. (2012). 533
Application of an optogenetic byway for perturbing neuronal activity via glial 534
photostimulation. Proceedings of the National Academy of Sciences of the United 535
States of America, 109 (50), 20720–20725. doi:10.1073/pnas.1213458109
536
Schulz, K., Sydekum, E., Krueppel, R., Engelbrecht, C. J., Schlegel, F., Schröter, A., … 537
Helmchen, F. (2012). Simultaneous BOLD fMRI and fiber-optic calcium 538
recording in rat neocortex. Nature Methods, 9 (6), 597–602.
539
doi:10.1038/nmeth.2013 540
Schummers, J., Yu, H., & Sur, M. (2008). Tuned Responses of Astrocytes and Their 541
Influence on Hemodynamic Signals in the Visual Cortex. Science, 320 (5883),
542
1638–1643. doi:10.1126/science.1156120 543
Seigneur, J., Kroeger, D., Nita, D. A., & Amzica, F. (2006). Cholinergic Action on 544
Cortical Glial Cells In Vivo. Cereb. Cortex, 16 (5), 655–668.
545
doi:10.1093/cercor/bhj011 546
Sekiguchi, K. J., Shekhtmeyster, P., Merten, K., Arena, A., Cook, D., Hoffman, E., … 547
Nimmerjahn, A. (2016). Imaging large-scale cellular activity in spinal cord of 548
freely behaving mice. Nature Communications, 7, 11450.
549
doi:10.1038/ncomms11450 550
Shen, Q., Ren, H., & Duong, T. Q. (2008). CBF, BOLD, CBV, and CMRO2 fMRI Signal 551
Temporal Dynamics at 500-msec Resolution. Journal of Magnetic Resonance
552
Imaging : JMRI, 27 (3), 599–606. doi:10.1002/jmri.21203
553
Sirotin, Y. B., & Das, A. (2009). Anticipatory haemodynamic signals in sensory cortex 554
not predicted by local neuronal activity. Nature, 457 (7228), 475–479.
555
doi:10.1038/nature07664 556
27
Sokoloff, L., Reivich, M., Kennedy, C., Rosiers, M. H. D., Patlak, C. S., Pettigrew, K. D., 557
… Shinohara, M. (1977). The [14C]deoxyglucose Method for the Measurement 558
of Local Cerebral Glucose Utilization: Theory, Procedure, and Normal Values in 559
the Conscious and Anesthetized Albino Rat. Journal of Neurochemistry, 28 (5), 560
897–916. doi:10.1111/j.1471-4159.1977.tb10649.x 561
Srinivasan, R., Huang, B. S., Venugopal, S., Johnston, A. D., Chai, H., Zeng, H., … 562
Khakh, B. S. (2015). Ca2+ signaling in astrocytes from Ip3r2-/- mice in brain 563
slices and during startle responses in vivo. Nature Neuroscience, 18 (5), 708–717.
564
doi:10.1038/nn.4001 565
Stark, J. A., Davies, K. E., Williams, S. R., & Luckman, S. M. (2006). Functional 566
magnetic resonance imaging and c-Fos mapping in rats following an anorectic 567
dose of m-chlorophenylpiperazine. NeuroImage, 31 (3), 1228–1237.
568
doi:10.1016/j.neuroimage.2006.01.046 569
Stobart, J. L., Ferrari, K. D., Barrett, M. J. P., Stobart, M. J., Looser, Z. J., Saab, A. S., & 570
Weber, B. (2016). Long-term In Vivo Calcium Imaging of Astrocytes Reveals 571
Distinct Cellular Compartment Responses to Sensory Stimulation. Cerebral
572
Cortex. doi:10.1093/cercor/bhw366
573
Sugiura, Y., Honda, K., Kajimura, M., & Suematsu, M. (2014). Visualization and 574
quantification of cerebral metabolic fluxes of glucose in awake mice. Proteomics,
575
14 (7–8), 829–838. doi:10.1002/pmic.201300047
576
Sugiura, Y., Honda, K., & Suematsu, M. (2015). Development of an Imaging Mass 577
Spectrometry Technique for Visualizing Localized Cellular Signaling Mediators 578
in Tissues. Mass Spectrometry, 4 (1), 1–9. doi:10.5702/massspectrometry.A0040
Sugiura, Y., Katsumata, Y., Sano, M., Honda, K., Kajimura, M., Fukuda, K., & Suematsu, 580
M. (2016). Visualization of in vivo metabolic flows reveals accelerated utilization 581
of glucose and lactate in penumbra of ischemic heart. Scientific Reports, 6, 32361. 582
doi:10.1038/srep32361 583
Sugiura, Y., Taguchi, R., & Setou, M. (2011). Visualization of spatiotemporal energy 584
dynamics of hippocampal neurons by mass spectrometry during a 585
kainate-induced seizure. PloS One, 6 (3), e17952.
586
doi:10.1371/journal.pone.0017952 587
Takano, T., Tian, G.-F., Peng, W., Lou, N., Libionka, W., Han, X., & Nedergaard, M. 588
(2006). Astrocyte-mediated control of cerebral blood flow. Nat Neurosci, 9 (2),
589
260–267. doi:10.1038/nn1623 590
Takata, N., Mishima, T., Hisatsune, C., Nagai, T., Ebisui, E., Mikoshiba, K., & Hirase, H. 591
(2011). Astrocyte calcium signaling transforms cholinergic modulation to cortical 592
plasticity in vivo. The Journal of Neuroscience, 31 (49), 18155–18165.
593
doi:10.1523/JNEUROSCI.5289-11.2011 594
Takata, N., Yoshida, K., Komaki, Y., Xu, M., Sakai, Y., Hikishima, K., … Tanaka, K. F. 595
(2015). Optogenetic activation of CA1 pyramidal neurons at the dorsal and 596
ventral hippocampus evokes distinct brain-wide responses revealed by mouse 597
fMRI. PloS One, 10 (3), e0121417. doi:10.1371/journal.pone.0121417
598
Tanaka, K. F., Matsui, K., Sasaki, T., Sano, H., Sugio, S., Fan, K., … Yamanaka, A. 599
(2012). Expanding the repertoire of optogenetically targeted cells with an 600
enhanced gene expression system. Cell Reports, 2 (2), 397–406.
601
doi:10.1016/j.celrep.2012.06.011 602
29
Tang, F., Lane, S., Korsak, A., Paton, J. F. R., Gourine, A. V., Kasparov, S., & 603
Teschemacher, A. G. (2014). Lactate-mediated glia-neuronal signalling in the 604
mammalian brain. Nature Communications, 5, 3284. doi:10.1038/ncomms4284 605
Thrane, A. S., Thrane, V. R., Zeppenfeld, D., Lou, N., Xu, Q., Nagelhus, E. A., & 606
Nedergaard, M. (2012). General anesthesia selectively disrupts astrocyte calcium 607
signaling in the awake mouse cortex. Proceedings of the National Academy of
608
Sciences of the United States of America, 109 (46), 18974–18979.
609
doi:10.1073/pnas.1209448109 610
Traina, G. (2016). The neurobiology of acetyl-L-carnitine. Frontiers in Bioscience
611
(Landmark Edition), 21, 1314–1329.
612
Tsurugizawa, T., Ciobanu, L., & Le Bihan, D. (2013). Water diffusion in brain cortex 613
closely tracks underlying neuronal activity. Proceedings of the National Academy
614
of Sciences of the United States of America. doi:10.1073/pnas.1303178110
615
Vanzetta, I., & Slovin, H. (2010). A BOLD Assumption. Frontiers in Neuroenergetics, 2.
616
doi:10.3389/fnene.2010.00024 617
Yoshida, K., Mimura, Y., Ishihara, R., Nishida, H., Komaki, Y., Minakuchi, T., … Takata, 618
N. (2016). Physiological effects of a habituation procedure for functional MRI in 619
awake mice using a cryogenic radiofrequency probe. Journal of Neuroscience
620
Methods, 274, 38–48. doi:10.1016/j.jneumeth.2016.09.013
Figure Legends
622
Figure 1. Transgenic mice that express
623ChR2(C128S)-EYFP at neurons or astrocytes.
624(a, d) Immunostaining against YFP (ChR2-marker) on coronal sections of the brain from 625
Neuron- (a) and Astrocyte-ChR2 mice (d). (b, e) Double-immunostaining for NeuN 626
(neuron marker, red) and YFP (green) of coronal sections of the brain from Neuron- (b) 627
and Astrocyte-ChR2 mice (e). (c, f) Higher magnification images of cortical layer IV of 628
Neuron- or Astrocyte-ChR2 mice. (g) Schematic drawings of attachment of a headbar 629
(gray) and an optic fiber with a cannula (red) on the intact skull. A headbar was used for 630
cranial fixation during ofMRI in awake mice. (h) A photograph of a transgenic mouse 631
with an attached headbar (arrow head) and a fiber optic cannula (arrow). (i) Estimated 632
area of illumination (pale blue) by an optic fiber (red), drawn over a horizontal (left) and a 633
sagittal (right) brain section of an anatomical MRI image. Scale bar: a,d, 3 mm; b,e, 200 634
µm; c,f, 50 µm; g,h,i, 5 mm. 635
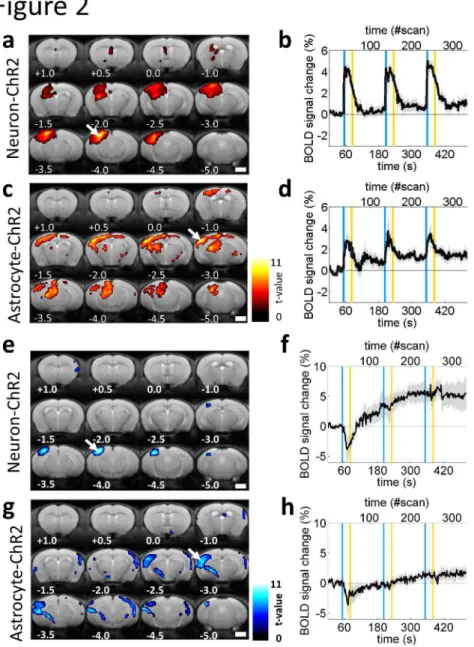
Figure 2. Transcranial optogenetic stimulation of
636neurons or astrocytes evoked BOLD signal response
637with oxygen consumption.
638(a, c) Activation t-maps overlaid on structural MRI images showing spatial distribution 639
of positive BOLD response upon optogenetic activation of cortical neurons (a) or 640
astrocytes (c) from n = 13 Neuron- or 9 Astrocyte-ChR2 mice, respectively. Illumination 641
was applied on the left side of the skull (left side in the figure). Values at the lower left 642
indicate anterior-posterior (AP) distance from bregma in mm. Color bar indicates t-values.
643
Arrows at AP -4.0 and -3.0 mm in (a) and (c), respectively, indicate approximate position 644
of a global peak of t-values, which were used for locations of ROIs for BOLD time
31
courses. (b, d) Time-course of BOLD signal fluctuation upon optogenetic activation of 646
neurons (b) or astrocytes (d). Blue and yellow vertical lines show timing of illumination 647
for each color. Note that ChR2(C128S), a step function opsin with the closing time 648
constant (τ) of 106 s, was kept open even after cessation of blue illumination until yellow 649
illumination. The x-axis at the top shows the scan number of fMRI measurements. Gray 650
shading indicates the SEM. (e–h) The same as (a–d), but in the presence of a vasodilator, 651
SNP, from n = 3 Neuron- or 3 Astrocyte-ChR2 mice, respectively, showing negative 652
BOLD response that indicates oxygen consumption upon optogenetic activation of 653
neurons (f) or astrocytes (h). Scale bar: a, c, e, g, 2 mm. 654
Figure 3. Optogenetic stimulation of neurons, but not
655astrocytes, results in neuronal activation.
656(a, b) Representative images of in situ hybridization on coronal brain sections around AP 657
-2.0 mm for c-fos mRNA, 30 min after optogenetic stimulation of cortical neurons (a) or
658
astrocytes (b) using Neuron- or Astrocyte-ChR2 mice, respectively (n = 9 each). 659
Optogenetic stimulation of neurons, but not astrocytes, induced expression of c-fos
660
mRNA (blue-purple signal) in the cortex ipsilateral to light illumination. Rectangles in 661
blue and red were for quantification of staining intensity of c-fos mRNA. Scale bar: 1 mm.
662
(c, d) LFP fluctuations upon optogenetic stimulation of Neuron- (c) or Astrocyte-ChR2 663
mice (d). Upper left: Representative traces of LFP recorded with a silicon probe 664
electrode, inserted into the cortex of an awake Neuron- (c) or Astrocyte-ChR2 mouse (d). 665
The blue area indicates the period of blue-light illumination. Note that the duration of 666
light illumination was 0.5 and 5.0 s for Neuron- and Astrocyte-ChR2 mice, respectively. 667
Upper right: Mean wavelet power spectrogram of LFP recorded in the cortex of n = 6 668
Neuron- (c) or n = 5 Astrocyte-ChR2 mice (d). Power values of LFP were normalized for 669
each recording session (see methods). Blue and yellow triangles with white vertical lines 670
indicate the delivery of blue and yellow light pulses, respectively. Lower left: Mean time 671
courses of LFP-power at each frequency band. Vertical lines of blue and yellow indicate 672
the delivery of light pulses of each color. The SEM envelopes the mean traces. Lower 673
right: The bar graph compares the mean power of LFP at each frequency band during the 674
first activation period (60~90 s). No modulation of LFP power was observed in 675
Astrocyte-ChR2 mice (d). *P < 0.05, **P < 0.01; paired t-test. (e, f) MUA response upon 676
optogenetic stimulation of Neuron- (e) or Astrocyte-ChR2 mice (f). Upper left: A 677
representative time course of high-pass filtered LFP (upper trace) and MUA (lower trace). 678
A horizontal red line in the upper trace indicates a threshold for MUA extraction. Upper 679
right: Representative mean traces of MUA during a baseline period (0~60 s, blue), and 1st
680
(60~90 s, green), 2nd (210~240 s, red), and 3rd (360~390 s, pale blue) activation periods. 681
Lower panel: Relative number of MUA counts, recorded from the most superficial 10 682
channels of the silicon probe in the cortex, from n = 6 Neuron- (e) and n = 5 683
Astrocyte-ChR2 mice (f). The SEM envelopes the mean traces. 684
Figure 4. Synthesis of AC at the site of optogenetic
685activation of astrocytes, but not of neurons.
686(a) Upper panel: Schematic of IMS experiments, which involved pathway tracing of 687
13
C6-labeled glucose upon optogenetic stimulation. A red circle indicates 13C-isotope in a 688
glucose molecule. Optic fiber was attached on the left intact skull. Lower panel: 689
Experimental time course. FMW fixation of the brain was performed 30 s following 690
optogenetic stimulation. (b) Schematic representation of 13C6-glucose metabolism into 691
acetyl-carnitine (AC). (c, d) Representative IMS images for carnitine (right top), AC (left 692
middle), 13C2-AC (middle right), AC/carnitine ratio (left bottom), and 13C2-AC/carnitine 693
33
ratio (right bottom), after optogenetic stimulation of a Neuron- (c) or an Astrocyte-ChR2 694
mouse (d). Astrocyte activation augmented synthesis of AC that accompanies O2 695
consumption (d, left middle). Upper left panel shows optical images of brain sections 696
used for IMS. Each panel shows three consecutive slices. Dotted circles in a top right 697
panel in (d) indicates area that showed reduction of carnitine. These experiments were 698
repeated with n = 3 Neuron- and n = 5 Astrocyte-ChR2 mice, obtaining similar results. 699
Scale bar: c,d, 2 mm. 700
Figure 1. Transgenic mice that express ChR2(C128S)-EYFP at neurons or astrocytes. 190x254mm (300 x 300 DPI)
Figure 2. Transcranial optogenetic stimulation of neurons or astrocytes evoked BOLD signal response with oxygen consumption.
Figure 3. Optogenetic stimulation of neurons, but not astrocytes, results in neuronal activation. 190x254mm (300 x 300 DPI)
Figure 4. Synthesis of AC at the site of optogenetic activation of astrocytes, but not of neurons. 190x254mm (300 x 300 DPI)
Running title: Astrocytes evoke BOLD fMRI response
1
Supplementary Materials and Methods
2
Ethics Statement
3All animal experiments were conducted in accordance with the National 4
Institutes of Health Guide for Care and Use of Laboratory Animals (NIH Publications No. 5
8023) and approved by the Animal Ethics Committee of Keio University (approval 6
number: 12034-(3)) and CIEA (16062A). 7
Generation of Chrm4-tTA BAC transgenic mice
8Mouse BAC DNA (clone RP23-138P5) was modified by inserting a codon 9
optimized tTA (mtTA)-SV40 pA cassette (Tanaka et al., 2010) into the translation 10
initiation site of Chrm4 gene. Modified BAC DNA was linearized by PI-SceI enzyme 11
digestion (New England Biolabs Inc., Ipswich, MA, USA), and injected into fertilized 12
eggs from CBA/C57BL6 mice. For genotyping of Chrm4-tTA line, the following primer 13
set Chrm-394U (5’-AAGCACCAAGTTCTCTCCCGTCTT-3’) and mtTAL24 14
(5’-cggagttgatcaccttggacttgt-3’) was used and the transgenic line yielded 430 bp product. 15
Generation of ChR2(C128S) expressing lines
16Double transgenic mice of Chrm4-tTA::tetO-ChR2(C128S)-EYFP and 17
Mlc1-tTA::tetO-ChR2(C128S)-EYFP were prepared for experiments. Mlc1-tTA BAC
18
transgenic mouse (RIKEN BRC stock number:05450) and tetO-ChR2(C128S)-EYFP 19
knockin mouse (RIKEN BRC stock number: 05454) were obtained from RIKEN 20
BioResource Center, JAPAN, and the methods for genotyping were previously described 21
(Kanemaru et al., 2014; Tanaka et al., 2012). 22
2
Surgery for attaching an optical fiber and a head-holder
23on the skull of the mice
24In total, 51 double transgenic mice, postnatal 8–12 weeks old, were used; 26 25
were Chrm4-tTA::tetO-ChR2(C128S) mice (9 males and 17 females) and 25 were 26
Mlc1-tTA::tetO-ChR2(C128S)-EYFP mice (13 males and 12 females). Animals were
27
anesthetized with a mixture of ketamine and xylazine (100 mg/kg and 10 mg/kg, 28
respectively, i.p.). After skull exposure, an optical fiber of silica glass (Φ 400 µm, 29
CFML14L05, Thorlabs, NJ, USA) was placed on the surface of the skull horizontally to 30
the bregma-lambda line. The side of an optical fiber was painted in black to avoid stray 31
light. The tip of an optical fiber was located at -5.1 mm posterior to the Bregma (AP -5.1 32
mm), 3.0 mm lateral from the midline to the left (ML -3.0 mm), and 0.6 mm ventral from 33
the horizontal plane passing through bregma and lambda on the surface of the skull (DV 34
+0.6 mm). The tip of an optical fiber was imbedded with a transparent silicone (Φ 200 µm, 35
Kwik-Sil Adhesive, WPI, FL, USA). Optical fiber was then attached on the skull with 36
dental acrylic (Super-Bond C&B, Sun Medical, Shiga, Japan). In the case of IMS 37
experiments, an optical fiber of plastic (Φ 500 µm, Eska SK20, Mitsubishi Chemical, 38
Tokyo, Japan) was used instead of an optical fiber of silica glass. 39
Next, a custom-made acrylic head bar (3 × 3 × 27 mm3) was mounted along the 40
sagittal suture of the exposed skull using the dental cement for fMRI in awake mice 41
(Yoshida et al., 2016). For experiments of in vivo electrophysiology, a custom-made 42
U-shaped plastic plate was attached on the skull instead of a head bar to enable fixation of 43
the mouse’s head to a stereotaxic frame (SR-6M-HT, Narishige, Tokyo, Japan) during 44
recording. For IMS experiments, a head-holder was not attached because a head of a 45
mouse is fixed in a dedicated tube (WJM-24 or WJM-28, Muromachi Kikai, Tokyo, 46
Japan). After covering the exposed skull with the dental acrylic, the animal was returned 47
to its homecage for recovery (Yoshida et al., 2016). 48
fMRI in awake mice
49Mice were acclimated to mock fMRI environment for 2 hrs/day for at least 7 50
days before performing fMRI in awake mice (Yoshida et al., 2016). Structural and 51
functional MRI was performed as described previously (Komaki et al., 2016; Takata 52
et al., 2015) using a 7.0-Tesla MRI apparatus equipped with actively shielded gradients 53
at a maximum strength of 700 mT/m (Biospec 70/16, Bruker BioSpin AG, Fällanden, 54
Switzerland) with a cryogenically cooled 2-ch transmit/receive phased array surface coil 55
(CryoProbe, Z120046, Bruker BioSpin AG, Fällanden, Switzerland), and the ParaVision 56
5.1 software interface (Bruker Biospin AG, Fällanden, Switzerland). Structural 57
T2-weighted images were acquired using a rapid acquisition process with a relaxation 58
enhancement (RARE) sequence in coronal orientations (repetition time [TR], 6100 ms; 59
echo time [TE], 48 ms; spectral bandwidth [BW], 5 kHz; RARE factor, 8; number of 60
averages, 4; number of slices 52; spatial resolution, 75 × 75 × 300 µm3). Before fMRI 61
measurement, a field map was acquired to reduce signal loss artifacts (TE, 1.520 ms; 62
5.325 ms; TR, 20 ms; spatial resolution, 300 × 300 × 300 µm3; matrix, 64 × 64 × 64 63
voxels). fMRI was performed using a gradient-echo echo-planar sequence (TR, 1500 ms; 64
TE, 20 ms; BW, 250 kHz; flip angle, 50°; number of segments, 1; number of averages 1; 65
number of slices 18; spatial resolution, 200 × 200 × 500 µm3; FOV, 19.2 × 19.2 mm2; 66
matrix, 96 × 96 × 18 voxels). This functional image covered the whole brain except the 67
olfactory bulb and the cerebellum. Total scanning time was 8.5 min (340 volumes with a 68
4
1.5-s interval). In ofMRI experiments in the presence of a nitric oxide donor, 69
subcutaneous injection of S-nitroprusside (SNP, 10 mg/kg, Sigma-Aldrich, MO, USA) 70
was performed five minutes before the start of fMRI measurements (Nagaoka et al., 71
2006; Tsurugizawa, Ciobanu, & Le Bihan, 2013; Yamamoto, 1992). 72
Transcranial light illumination
73A pair of blue and yellow light pulses with 30-s intervals (1.1~2.5 mW at the tip 74
of an optical fiber; LEDC2-B/A, Doric Lenses, QC, Canada) were delivered 60-s after the 75
start of fMRI measurements. Pulse duration was 0.5 s and 5 s for experiments with 76
Neuron- and Astrocyte-ChR2 mice, respectively. In the case of IMS experiments, only 77
the first blue light was delivered, 30–40 s after which FMW was applied to inactivate 78
enzymatic reactions in the brain. Area of illumination was estimated to cover the left 79
parietal cortex based on calculation using numerical aperture and diameter of the optic 80
fiber without considering light scattering in the skull and the cerebral parenchyma (Fig. 81
1i). Power of illuminated light beneath the skull was estimated to be ~5% of that at the tip 82
of an optical fiber, based on our measurement using a power meter (PM160T, Thorlabs, 83
NJ, USA; detector ø10 mm) that was put beneath the skull (0.15 and 2.7 mW, 84
respectively). Estimated irradiance beneath the skull is ~0.002 mW/mm2, which 85
corresponds to half-maximal activation (EPD50) of ChR2(C128S) (Mattis et al., 2012). 86
In vivo
multichannel extracellular recordings
87Extracellular recording was made from awake transgenic mice using a 88
16-channel, linear silicon probe (100-µm spacing, 177-µm2 recording site area; 89
NeuroNexus, MI, USA), which was inserted through a craniotomy (Φ 0.5 mm; AP -3.0 90
mm, ML -2.0 mm) at a depth of 1.7 mm ventrally from the pia for recording from the 91