Acta med. nagasaki. 5 : 13 - 23 (1960)
Hematological Studies on the Atomic Bomb Survivors in Nagasaki
(The 4th Report)*1
Shiro OSAJIMA AND Masanobu TOMONAGA*2
Second Department of Internal Medicine, Nagasaki University School of Medicine, Nagasaki, Japan
Received for publication February 8, 1960
From February to March of 1956 a mass medical examination was conducted on the A-bomb exposed. Comparing the A-bomb survivors groups with the control groups, and also comparing with the results of the exami- nation in 1953 we reached the following conclusions: 1) In comparison with the year of 1953 the exposed groups showed a marked restoration of anemia and a marked decrease of eosinophilia in 1956. 2) In 1956, WBC count, Hb. lebel, eosinophilia above 5%, percentage of monocyte and lymp- hocyte showed no significant variation between the exposed and control groups. Only for eosinophilia above 10% the exposed groups showed a more significant high rate than the control groups. 3) Accordingly, so tar as concerned with the peripheral blood, it may be duly said that hemato- poietic dysfunction returned to an almost normal condition in 1956, eleven years after exposure.
The 2nd Department of Internal Medicine has conducted hematological investiga- tions on the A-bomb survivors on several occasions since 1946 1) , 2) , 7) , 8). Recently a general medical examination for the A-bomb exposed was performed by Nagasaki University School of Medicine. The 5th hematological investigation was conducted as a part of the examination.
MATERIALS AND METHODS
The general medical examination was conducted from February 1 to March 3, 1956. The total number of examined survivors were 6,732, from which those who had an unknown or unclear past history at the time of A-bomb ; those who had been exposed in Hiroshima ; and those whose examination was incomplete, were excluded.
The remaining 4,841 survivors, that had reliable past history and reliable examination results were the subject of this investigation. They were classified as illustrated in Table 1 into 3 groups, A, B and C, according to presence or absence of acute radia- tion symptoms (epilation, hemorrhagic tendency, stomatitis), and were. further divided into 18 smaller groups by sex and age. Group C consisting of those persons who were exposed at over 2500m from the hypocenter and showed no radiation symptoms, was tentatively regarded as a control group, and the differences among A, B and C was compared and investigated. The items of investigation were the same as in 1953, i. e., WBC count, Hb. level and WBC differential.
As for the method of investigation., incidence of deviation from the usually
*I Published in J . J. S. I. M.'47 : 1 (1958) (Japanese),
*2 箴 島 四 郎 」朝 長 正 允
S. OSAJIMA AND M. TOMONAGA
normal values which were shown in each item of investigation was compared by the chi square analysis with each other and total of 18 groups divided as mentioned above.
In addition, the results of investigation in 1953 were compared by the chi square analysis with the results of this investigation, and a close examination was made as to what changes had occurred for the past three years in the groups under the same condition. The chi square values obtained through this investigation are shown in Table 8.
TABLE 1.
The Number of Persons Examined
F y22IGroup Age
1607 , 1583,
ex Y i YYsYY~
1956 1953
Sex---- I -- M=----_ F T SM --
T Y1 Y i Y2 Ys2 Ya YAgeGroup
A 102 505 86 132 5761 76 1477 A 1251 248 44 132 484 54 1087 B 307 472 97 310 485 86 1757 B 227 307 111 346 767 1271 1885
C 185 416 146 205 522 133C 78 91 22 80 83 7 361
T 594 1393 329 647295 T 430 646 177 558 1334 188
Total 2316 2525 4841 Total 1263 2080 3333
A = Exposed under 2000m with major radiation symptoms. B = Exposed under 2000m without major radiation symptoms, C = Control.
Y1 = 8-23 years. Y_- = 24-58 years. Ys = 59 years over,
RESULTS
I. WBC count
The distribution of WBC conut of the subjects is as shown in Table 2. WBC count over 10,000 or below 5,000 werd considered abnormal and a comparison was made.
1) Leukocytosis. a) In 1953: Both MBY1 and MCY1 showed a significant increase (p < 0.01) more than MAY1. In the total groups (refered to as T herein- after), C showed a more significant increase than A and B (p < 0.001) ; B showed more significant increase than A (p < 0.001).
b) In 1956: Among A, B and C there was no significant difference in respec- tive age and total groups.
c) Comparison between 1953 and 1956: MAY1, MAY2, MBY2, FAY2 and FBY3 showed a significant increase respectively in 1956 (p < 0.01), but no significant difference in C between these two years.
2) Leukopenia. a) In 1953: FCY2 showed a significant increase than FBY2 (p < 0.01).
b) In 1956: Among A, B and C no significant difference was noticed with each age group and total group.
c) Comparison between 1953 and 1956: MAY2, AT and BT showed a signi- ficant decrease in 1956 than 1953 (p < 0.01, p < 0.01, p < 0.05).
Brief summary. In 1953 WBC count of A and B when compared with C
tended to be smaller, but in 1956 both A and B did not vary much from C, as those
with leukopenia having decreased,
BE.
ex
000-9000-10
99) (1274)(
(14
(14
88)(15(
TAL2 Leukocytesnumber
G SAge No, 1.999 2.000- 3 000 4.000 5 000 6.000^ 78.000^
.000 r 11 000 12.000 13.00^ 4 000 15.000 v 20.000 20.000 Y t 102 .96) 2 (0. 1 13
.(13 72)13.72) 14 14 (17,64) 18 (9._90) 10 (9.90) 10 (8.82) 0. 9 (2.94) 3 (3.92) 4 (3.92) 4(1
M Y 2 505 7 29 52 82 102 92 49 34 24 18 13 3(1
.38) (5 74) (10.29) (16.23) (20.19) (18.21) (9.70) (6.72) (4.75) (3 66) (2.57) (0 59)
Y..3 86 2 7 9 14 16 17 3 6 8 2 1 1A (2
.32) (8.13) (10 46) (16 28) (18.60) (19.76) (3.48) (6 96) (9.30) (2.32) (1 16) (1 .16) Y i 132 .51) 2 (4 54)39) 6 19 (1,666) 22 (19.63) 26 (14.39) 19 (7.57) 10 (9 .09) 12 (4.54) 6 (4.54) 6 (3.03) 4 (0) 0(1
F Y s 576 11 42 60 115 99 89 52 52 27 16 7 6(1
.90) (7 29) (10.41) (19.96) (17.18) (15.45) (9.02) (9.02) (4.68) (2.77) (1.21) (1.04)
Ys 76 1 3 11 15 14 13 8 4 4 2 1 0(1
.31) (3 94)47) (19.73) (18.42) (17.11) (10.52) (5.26) (5.26) (2.63) (1.31) (0) T 1477 25 .69) (5.95) 88 (11 10) 164 (17.73) 262 (18 .34) 271 (16.79) 248 (8.93) 132 (7.98) 118 (5.28) 78 (3.18) 47 (2.03) 30 (0.94) 14 1(1
Y> 307 .95) 6 (3.90) 12 (7 80) 24 (14.00) 43 (15.96) 49 (16.93) 52 (11 40) 35 (10.42) 32 (6.84) 21 (4.88) 15 (5.20) 16 (0.32) 1 (0.32) 1(1
M Y2 472 1 7 38 60 72 95 75 51 23, 19 17 9 5(0
.21) (1 48) (8.05) (12.71) (15.25) (20.12)(10.80)4.87) (4.02) (3.60) (1.90) (1 .05)
.
Z, R 97 4 5 10 10 12 17 17 6 7 5 3 1(4
.12) (5.15) (70.30) (10.30) (12.37) (17.52) (17.52) (6.18) (7.24) (5.15)' (3.09) (1.03) .-B
2 12 29 55 57 50 35 28 21 12 4 51'i 310
(0.64) (3,87) (9.35) (17.73) (18.38) (16.12) (11.28) (9.03) (6.77) 3.87 (1.29) (1.61) F Y !t 485 9 26 .36) (11.13) 54 (18.76) 91 .(18.55) 90 (15.25) 74 (10.10) 49 (9.48) 46 (4.12) 20 (3.50 17 (1.03) 5 (0.82) 4(1 85) (5
Ys 86 1 7 11 15 14 11 9 7 2 5 3 1(1
.16) (8.13) (12.78) (17.44) (16.27) (12.78) (10.46) (8.13) (2.32) (5.81) (3.48) (1.16)
T 1 11757 1 (0.056) (1.65) (5.69) 29 10i 188 286 317 279 196 142 90 71 40 17 1 (10.69) .(16.27) (18.03) (15.81) (11.15) (8.08) (5.12) (4.04) 2.27) (0.96) (0.056) Yi 185 .63) 3 (7.03) 13 (10.28) (15.68) 19 29 17.30 32 17.84 33 9.73 18 (7.57 14 4.33 8 4.33 8 3.2 6 1.09 2(1 Ys 416 .24) 1 (1.92) 8 (5.04) 21 (12.74) (18.26) (18.02) (17.30) 53 76 75 72 (9.85) 41 (6.97) 29 (4.56) 19 (2.64) 11 (1.44) 6 (0.96) 4(0 Ya 146 .42) 5 (5.47) 8 (10.27) (18-49) (20.54) (12-32) (13.01) 15 27 30 18 19 (5.47) 8 (2.05) 3 (4.79) 7 (2.73) 4 (1.36) 2(3
C 7 13 21 36 33 32 21 19 11 5 6 1
Y s 205 (3 .41) (6.34) (10.24) (17.56) (16.09) (15.60) (10.24) (9.26) (5.36) (2.43) (2.92) (0.48) Y 522 11 .10) (6.89) 36 (13.97) (20.28) (19.53) (11.68) 73 106 102 61 (9.95) 52 (7.27) 38 (2.48) 13 (3.25) 17 (1.72) 9 (0.76) 4(2 Ys 133 .50) 2 (6.01) 8 (18.04) (21.80) (22.55) (14.28) 24 29 30 19 (3.75) 5 (4.51) 6 (3.00) 4 (1.50) 2 (1.50 2 (1.50) 2(1 T 1607 .062) 1 (2,23) 36 (6 )5) (12.75) (18.85) (18 .79) (14.62) 99 205 303 302 235 (9.70) 156 (7.09) 114 (3.60) 58 (3.11) 50 (2.05) 33 (0.93) 15(0
T 4841
M
F
S. OSAJIMA AND M, TOMONAGA
TABLE 3.
Hemoglobin (Sahli)
No.
2(2.32) 4(4.65) 1(1.16)
1(1.31) 2(2.63) 6(7.89)
67(14.19) 182(38.56) 199(42.16)
3
2(0.41)
('171(17.07) 147(35.36) 180(43.27)
Y3
179(34,29) 155(29.69)
4841
523.9 130.590.19142.7768
23
0.4774002 0.65120.3373144.56 0.2110.85194.034
G Sex Age <- 30 30 -49 50 - 69 70 - 79 80 - 89 90 - 99 i 100
Yi 102 1(0 98) -~(40)(22.54) 38(37.25) 35(34.31)
M Y2 505()()()(13.46) 20(39.99) 218(43.16)
Y3 86 (26.74) 31(36.05) 25(29.07)
A Y1 132 1(0.75) 6(4.54) 10(7.57)i 57(37.17) 44(33.32) 14(10.60)
F Y~ 576 2(0.34) 24(4.16)115(19.96)i225(39.06)152(26.38) 58(10,86)
Y s 7630(34.45) 26(34.19) 11(14.46)
T 1477()(2.70) 15(1.2)426(28.43)792(33.30)361(24.43)
()()()Y1 307 (23.78)142(46.25) 75(2443)
M Y2 472()()()
Y97 ( 5(5.15) 25(25.77) 47(48.45) 20(20.62)
B Y1 310 4(1.29) 19(6.13) 95(30.65)120(38.70) 72(23.23)
F Y 2 48527(5 57) 84(17 32) 19(39.38) 140(28.89) 41(8.45)
i
(29.07) 31(36.05) 11(12.79)Y s 86()()
T 1757 5(0.28) 41(2.33) 155(8.82)476(27.09)i662(37.68)418(23.79)
Y1 185 1(0 54) 1(0 54) 10(5 41) 48(25.95) 78(42.17) 47(25.41) ())()M Y2 416
()()()(23,29) 52(35.62) 42(28.77)
J 146
()()(29.27) 81(39.51) 45(21.95)C Y1 205 F Y2 522 1(0)()()()65(12.45)
Ys 133 2(1.50) 21(15,79) 34(25.56) 53(39.85) 23(17.29)
T 1607 1(0. I(26.51)i566(35.22)402(25.01)
T
1416.282558.81
1.2010.245122.88
8.221.374123422.74 602.936.34613 17.24.19275.17900.965
426062) 9(0.56) 45(8.80) 158(9.83)
< )= °o
II. Anemia
The distribution of Hb. level is illustrated in Table 3. A comparison was made by considering Hb. level below 30% as abnormal.
a) In 1953: FAY1 and FBY1 showed a significant increase of persons with anemia than FCY1 (p < 0.01), and also AT and BT showed a significant increase than CT (p < 0.01).
b) In 1956: There was no significant difference between A, B and C.
c) Comparison between 1953 . and 1956: MAY1, MAY3, MBY3, each age
group in A and B or F, AT and BT showed a significant decrease in 1956 than in
HEMATOLOGICAL STUDIES ON THE SURVIVORS
1953 (p < 0.001). On the other hand C showed no significant difference in these two years in each age group and T.
Brief summary. In 1953 the A-bomb exposed in A and B obviously showed a tendency toward anemia than the control group. In 1956 both in A and B there was a marked restoration of anemia, and hardly any difference from C was noted.
III. Lymphocytes
The percentage of lymphocytes in WBC differential is distributed as shown in
TABLE 4.
Lymphocyte Counts
G I Sex Age No. <-- 10.0 10.1-2.00 20.1-40.0 40.1-60.0 60.1 -~
Y1 102 2(1.96) 13(12.74) 80(78.47) 7(6.86) M Y2 505 5(0.99) 103(20.39) 357(70.68) 40(7.92)
Y3 86 1(1.61) 28(32.56) 52(60.47) 4(4.65) 1(1.16)
A Y1 132 1(0.75) 17(12.87) 98(74.22) 16(12.11)
F Y2 576 4(0.69) 100( 7.36) 42(73.08) 50( 8.86) 1(0.17)
Y3 76 12(15.78) 55(72.32) 9(11.83)
T 1477 13('0.88) 273(18.48) 1063(11.96) 126(8.53) 2(0.13) Y1 307 5(1.62) 53(17.24) 213(67.37) 36(11.70)
M Y2 472 8(1.68) 79(16.73) 328( 6.97) 57(12.07)
Y3 97 4(4.12) 22(22.67) 64(65.97) 6( 6.18) 1(1.03)
B Y1 310 1(0.32) 29( 9.35) 230(13.17) 47(15.14) 3(0.96)
F Y2 485 3(0.61) 89(18.34) 335(69.04) 57(11.74) 1(0.20)
Y3 86 2(2.32) 22(25.57) 54(62.78) 8( 9.30)
T 1757 23(1.31) 294(16.73) 1224(69.66) 211(12.01) 5(0.28)
Y1 185 3(1.62) 22(11.89) 139(75.13) 20(10.81) 1(0.54) M Y 2 416 2(0.48) 83(19.95) 292(70.19) 37( 8.89) 2(0.48)
Y 3 146 3(2.05) 43(29.45) 92(63.01) 8(5.48)
C Y1 205 1(0.49) 15( 7.32) 158(77.07) 30(14.63) 1(0.49)
F Y 2 522 4(0.77) 81(15.51) (71.62) 62(11,87) 0(1,19)
Y3 133 3(2.25) 20(15.05) 88(66.15) 22(16.53)
T 1607 16(0.99) 264(16.42) 1143(71.11) 179(11.19) 5(0.31)
T 4841
( ) _ °o
S. OSAJIMA AND M. TOMONAGA
Table 4. An investigation was done, considering those that are over 40% as an abnormal increase and those below 20% as abnormal decrease ; however, no significant difference was found between A, B and C in each year of 1953 and 1956 and a also between these two years.
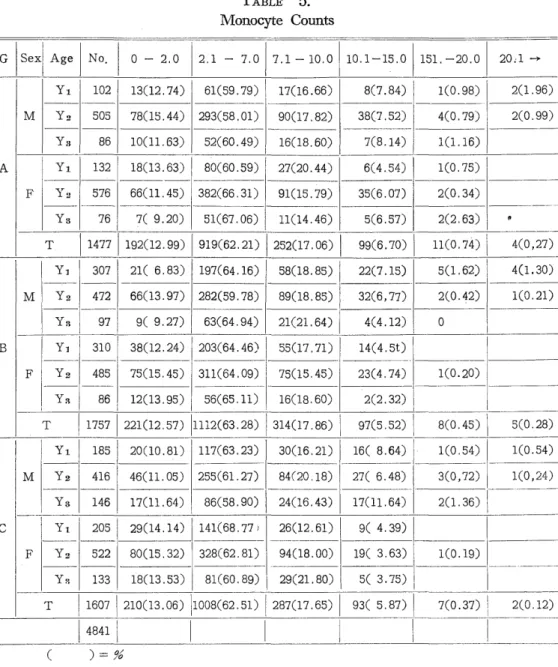
IV. Monocytes
The distribution of the monocyte percentage is shown in Table 5. An investiga- tion was made considering those over 7% as abnormal.
TABLE 5.
Monocyte Counts
G Sex Age I No. 0 - 2.0 2.1 - 7.0 7.1 - 10.0 10.1-15.0 151. -20.0 20:1 -~
Y1 102 13(12.74) 61(59.79) 17(16.66) 8(7.84) 1(0.98) 2(1.96) M Y2 505 78(15.44) 293(58.01) 90(17.82) 38(7.52) 4(0.79) 2(0.99)
Y S 86 10(11.63) 52(60.49) 16(18.60) 7(8.14) 1(1.16)
A Y1 132 18(13.63) 80(60.59) 27(20.44) 6(4.54) 1(0.75)
F 2 576 66(11.45) 382(66.31) 91(15.79) 35(6.07) 2(0.34)
Y3 76 7( 9.20) 51(67.06) 11(14.46) 5(6.57) 2(2.63) A
T 1477 192(12.99) 919(62.21) 252(17.06) 99(6.70) 11(0.74) I 4(0,27)
Y, 307 21( 6.83) 197(64.16) 58(18.85) 22(7.15) 5(1.62) 4(1.30) M Y2 472 66(13.97) 282(59.78) 89(18.85) 32(6,77) 2(0.42) 1(0.21)
Y3 97 9( 9.27) 63(64.94) 21(21.64) 4(4.12) 0
B Y1 310 38(12.24) 203(64.46) 55(17.71) 14(4.5t)
F Y 2 485 75(15.45) 311(64.09) 75(15.45) 23(4.74) 1(0.20) Y3 86 12(13.95) 56(65.11) 16(18.60) 2(2.32)
T 1757 221(12.57) 1112(63.28) 314(17.86) 97(5.52) 8(0.45) I 5(0.28)
Y1 I 185 20(10.81) 117(63.23) 30(16.21) 16( 8.64) 1(0.54) 1(0.54)
M Y 2 416 46(11.05) 255(61.27) 84(20.18) 27( 6.48) 3(0,72) 1(0,24) Y 3 146 17(11.64) 86(58.90) 24(16.43) 17(11.64) 2(1.36)
C Y1 205 29(14.14) 141(68.77) 26(12.61) 9( 4.39)
F Y2 522 80(15.32) 328(62.81) 94(18.00) 19( 3.63) 1(0.19) Y3 133 18(13.53) 81(60.89) 29(21.80) 5( 3.75)
T 1607 210(13.06) 1008(62.51) 287(17.65) 93( 5.87) 7(0.37) 1 2(0,12) 4841
a) In 1953: MAY2 and MBY2 showed a significant increase than MCY2 ;
and FAY1 and FBY1 showed a significant increase than FCY1 (p < 0.01). In T,
HEMATOLOGICAL STUDIES ON THE SURVIVORS
both A and B showed significant increase than C (p < 0.001).
b) In 1956: There was no significant difference at all between A, B and C.
c) Comparison between 1953: MBY1 was significantly decreased in 1956 than in 1953 (p < 0.001), and MCY2 and CT showed a significant increase in 1959 than in 1953 (p < 0.001).
Brief summary. In 1953, both A and B showed a larger tendency to monocy- tosis than in C. In 1956 there was nothing different between A, B and C. This gives an impression that tendency to monocytosis might have been restored to a normal
condition, however, in view of the fact that there was an increase of cases of monocy-
TABLE 6.
Eosinophil Counts
G Sex Age No. 0 - 1.0 1.1-5.0 5.1-1,0010.1-15.015.1-20.0 120.1-30,0 30.1 -~
Y, 102 20(19.64)1 45(44.11) 22(21.56) 12(11.76) 2(1.96) 1(0.98)
- - --- - - - - ---
M Y 2 505 87(17.22)270(53.46)104(25.74) 29( 5.74) 11(2.17)' 3(0.59) 1(0.19)
Y 3 86 16(18.60) 41(47.67) 23(26,74) 2( 2.32) 3(3.48) 1(1.16)
A Y1 132 21(15.90) 59(44.69) 36(27.27) 6( 4.54) 7(5.30) 3(2.27)
F Y2 576 77(13.36)266(46.18)138(23.98) 49( 8.50) 27(4,68) 17(2.95) 2(0.34) Y3 76 8(10.52) 35(46.05) 23(30.26) 4( 5.26) 3(3.94) 3(3.94)
T 1477 229(15.50)716(48.49)346(23.42)102( 6.90) 53(3.58) 26( 1.76) 5(0.33) Y1 307 37(12.05)151(49.18) 81(26.38)1 27( 8.79) 8(2.60) 3(0 97)
M Y2 472 81(17.16)266(56.35) 99(20.97) 22( 4.66) 2(0.42) 2(0.42) Y3 97 19(19.57) 53(54.61) 18(18.54) 3( 3.09) 3(3.09) 1(1.03)
B Y1. 310 49(15.80)146(47.08) 69(22.25) 28( 9.03) 11(3.54) 4(1.29) 3(0.97) F Y2 485 51(10.05)221(45.54)131(26.99) 53(10.92) 17(3,50) 8(1.64) 4(0.82)
Y 3 86 10(11.62) 43(49.96) 23(26.72) 6( 6.97) 3(3.48) 1(1.16)
T 1957 247(14.05)1880(50.08)1421(23.95)1139( 7.91) 44(2.50) 19(1.08) 7(0.39)
Y1 185 26(14.05) 92(49.72) 47(25.40) 16( 8.64) 3(1.62) 1(0.54)
M Y•2 41.6 72(17.30)234(56.23) 87(20.90) 13( 3.12) 9(2.16) 1(0.24) Y3 146 28(19.17) 23(15.75) 23(15.75) 4( 2.72) 4(2.73) 3(2.05) C Y1 205 36(17.56) 96(46.82) 52(25.36) 18( 8.78) 3(1.64)
F Y 2 522 70(13.40)245(46.90)146(27.95) 41( 7,85) 12(2.29) 6(1,41) 1(0.38) Y3 133 24(18.04) 70(52.62) 26(19.54) 11( 8.26)1 1(0.75) 1(0.75)
T 1607 256(15.92)821(51.08)381(23.70)1103( 6.40)1 32(1.99) 12(0.74)' 2(0.12)
T 4841
S. OSAJIMA AND M. TOMONAGA
tosis in C in 1956 than in 1953 and the fact that there had been no variation in A and B from 1953 to 1956, it is difficult to conclude that a definite tendency existed.
V. Eosinophilia and eosinopenia
The percentage of eosinophils in WBC differential is distributed as shown in Table 6. An investigation was performed on two cases of an abnormal increase ; one was applied to those above 10% and the other to those above 5%. As to a decrease, those below 1% were considered abnormal.
1) Eosinophilia A) In cases when above 10% was considered as abnormal.
a) In 1953: FAY2, FBY1 and FBY2 showed a significant increase respecti- vely than FCY1 and FCY2 (p < 0.05, p < 0.05, p < 0.01). AT and BT also showed a significant increase than CT (p < 0.01).
b) In 1956: Both FAY2 and FBY2 showed a significant increase than FCY2 (p < 0.05). AT also showed a significant increase than CT (p < 0.01). There was no significant difference observed between BT and CT.
c) Comparison between 1953 and 1956: In both M and F, A and B, exclu- ding MAY1 and FAY1 groups, showed significant decrease in 1956 than in 1953 (p
< 0.001). Also AT and BT showed a significant decrease (p < 0.001). However, in case of C, also, MCY1, MCY2 and CT showed a significant decrease in 1956 than in 1953 (p < 0.001).
B) In cases when above 5% was considered abnormal.
a) In 1953: FAY2, FBY1 and FBY2 showed a significant increase than FCY1 and FCY2 (p < 0.01). Also AT and BT showed a significant increase than CT
(p < 0.05, p < 0.01).
b) In 1956: No significant difference was noted between A, B and C.
c) Comparison between 1953 and 1956: MAY1, MAY2, MBY2, MBY3, FAY2, FBY1, FBY2, FBY3, AT and BT, all of them showed a significant decrease in 1956 than in 1953 (p < 0.01). On the other hand, in the control group, MCY1, MCY2, MCY3 and CT were significantly decreased in 1956 .than in 1953 (p <
0.05, p < 0.01, p < 0.05, p < 0.01).
2) Eosinopenia. There was no significant difference observed among A, B and C in each year of 1953 and 1956, and also between these two years.
3) Result of stool examination which was conducted on patients with eosino-
TABLE 7.
Results of Stoolexamination of Survivors with Eosinophilia
G Total- number Number Examined of Hookworm & Ascaris Hookworm Ascaris (-)
A 202 131 ( 34 43 10 44
2.59) (32.8) (7.6) (33.5)
B 219 142 28 41 19 54
119.71 (28.8) (13,3) 138.0)
C 158 95 19 27 12 37
(20.0) (25.4) (12.6) (39.0)
( ) _ °o
HEMATOLOGICAL STUDIES ON THE SURVIVORS
TABLE 8.
A Tabulation of Chi Square of Series of Chi Square Tests Made Among A, B and C Group within Each Age Group
Year 1953 1956 1956:1953
Sex M F M F M F
G A: BA: CB.: CA: BA: CB: CA: BA: CB: CA: BA. CB. C A B C A B C
y Y1 -.7.09 -8.4 - - - - - - - - - - 11.5 - - - - -
Y2 - - - - - - - - - - - - 10.9 7.8 - 26.9 - -
V V
'~ T -16 .4-18.7-17.2 - - - - -
u W Y, - - - - - -10 .1 - - - - - - -10.8 - - - - -a
a 0
T - - - - - - -8.8 -4.8 -
Y1 -- - - - 13.4 - 8.5 - - - - - - -38.4 - - -78.3-21.3
-
'~ Y2 - - - - - - - - - - - - -
Q, Ya - - - - - - - - - - - - -54.6-13.6 - -20.3-12.3 -
T - 18.8 21.2 - - - -18.8-21.2 -
~, Y1 - - - -13. 6.2 12.2 - - - - - - - -7.1 - - - -
Y, - 15.6 12.7 - - - - - - - - - - - 16.3 - - -
0
T - 15.9 13.9 - - - - - 14.4
^ Y1 - - - - - 6.4 - - - - - - -14.51-13.91 - -10.7 -
0 ~ Y2 - - -4.6 7.1 19.5 - - -• - 5,2 5.6 -9.1 -28.21-24.11 -8.7-22.5 -
0