A Parallel Genetic Algorithm with Distributed Environment Scheme
M. M&i*, T. Hiroyasu*, M. Kaneko**, K. Hatanaka**
*Department of Knowledge Engineering, Doshisha University, Kyo-tanabe, Kyoto, 610-0321, Japan
{mmiki@mail, tomo@mikilab} .doshisha.ac.jp
**Graduate School of Engineering, Doshisha University, {mika@mikilab, ts0705Qmai14) .doshisha.ac.jp
ABSTRACT
This paper introduces an alternative approach to relieving the task of choosing optimal mutation and crossover rates by using a parallel and distributed GA with distributed environments. It is shown that the best mutation and crossover rates depend on the population sizes and the problems, and those are different between a single and multiple populations. The proposed distributed environment GA uses various combination of the parameters as the fixed values in the subpopulations. The excellent performance of the new scheme is experimentally recognized for a standard test function. It is concluded that the distributed environment GA is the fastest way to gain the good solution under the given population size and uncertainty of the appropriate crossover and mutation rates.
1. INTRODUCTION
The performance of each GA depends on the good choice of the crossover and the mutation rates. Mtihlenbein [l] and Back [2] concluded that a constant mutation rate l/L, where L is the length of the binary strings, can serve as a reasonable heuristic rule for any kind of objective function. It has much more difficult to come up with heuristics for choosing the suitable crossover rate. Schaffer et al [3] observed that high crossover rates are best with small population, a broad range of crossover rates are tolerated at medium population sizes, and only low crossover rates are suggested for large population sizes. Tuson & Ross [4] showed that the most suitable crossover rates also depend upon the problem to be solved.
Those results are obtained for canonical GAS with a single population, and researches that deal with the good choice of the crossover and mutation rates in distributed GAS which has multiple populations are very few. Researches in distributed GAS concerning about optimal settings of these parameters are going toward a self-adaptation of the parameters and the evolution of the subpopulations.
Although these hierarchical meta-GA approaches have a remarkable flexibility in modeling various adaptation schemes, a poor strategy in meta-GAs can not improve the performance of sub-GAS. From this point of view, we present a parallel GA with distributed environments in this paper.
The main objectives of this research are to make clear whether the optimal crossover and mutation rates in distributed GAS are different from those in canonical GAS, and to propose a new approach where no effort is required to choose suitable
parameters. The most important point in proposing a new method is in the comparison between the performances of the new scheme and the previous one with best tuned parameters.
2. BACKGROUND
The roles of crossover and mutation are significantly important in GAS [S]. Crossover is employed to perform direct information exchange between individuals in a population, while mutation is employed to avoid stagnation in evolution.
The performance of each GA depends on the good choice of the crossover and the mutation rates. Empirical studies have shown that the best setting for the crossover rate depends on the choices made regarding other aspects of the overall algorithm, such as the settings for other parameters such as population size and mutation rate, and the selection operator used. Some commonly used crossover rates vary between 0.45 and 0.95 [6]. Tuson & Ross [4] carried out an exhaustive search of the operator probabilities: a GA was run for crossover rate 0.05 to 0.95 with steps of 0.05, while the mutation was applied otherwise. Their results show that the most suitable crossover rates also depend upon the problem to be solved. On the other hand, the best setting for the mutation rate also depend on the particular optimization problems [7], and the lower bound for the optimal mutation rate is found to be l/L [2] where L is the length of the binary strings.
The difficulty in setting suitably the crossover and mutation rates promoted many researches on the self-adaptation of these parameters. Back [S] pointed out that the most efficient parameter setting must depend on the fitness function, at least.
It is quite evident that strategy parameters should vary during a run for finding an optimum in order to achieve even higher efficiencies.
Hesser & Manner [9] introduced a time schedule for mutation rate. Back [8] took a different approach where the self- adaptation of mutation rates is intended to organize the schedule of mutation rates during the course of evolution.
Srinivas & Patnaik [lo] recommended the use of adaptive probabilities of crossover and mutation to realize the twin goals of maintaining diversity in the population and sustaining the convergence capacity of GA. Smith & Fogarty [ 1 I]
proposed an algorithm which optimizes both recombination and mutation strategies via self adaptation of its genotype.
This is done by learning useful ‘blocks’ of linked genes and a suitable mutation rate for each block.
-10 11’ ’ i‘ I , I
0 200 400 600 600 1000
Generations (a) Mutation rate = 0.1/L
z ,,___ ~ .._._... ,. _... *..-
I -20 . . . . .?.‘...
,...
.E
,, .C’ . . . +.Adxx&
E
‘.,... ..:- ,:>:..:P i ..<.- ;:.A’:i ,:. . . . .
-30 “f
Crossover rate
. . 0.0
~ 0.1
- 0.3
.,.., . . . . . <..Y<<... 0.6
- 1.0
0 200 400 600 600 1000 0 200 400 600 600 1000
Generations Generations
(b) Mutation rate = l/L (c) Mutation rate = 10/L
These adaptive parameter tuning methods in GAS are very useful and also very suitable since self adaptation is an inherent feature in evolutionary optimum seeking, but such meta-GA methods sometimes does not work very well since the performance of a particular GA strategy in such meta-GA also depend on the suitable parameter settings in the meta-GA.
The premature convergence of a population in a GA can be avoided using the ‘good’ meta-GA strategy, but it can not be avoided when the premature convergence takes place in a ‘bad meta-GA.
It is well known that distributed GAS with multiple subpopulations or with isolation by distance can maintain diversity in the evolving population. Tanese [12] showed the ability of finding fitter individuals than the traditional one.
Belding [13] extended Tanese’s work on distributed GA to the different fitness functions in order to determine whether her results were specific to the Tanese functions. He showed that distributed GA outperformed canonical GA for the functions which are not easy for canonical GA. From these results, we can conclude that distributed GA outperforms canonical GA in some sense. However, the optimal-parameter setting problem still remains in distributed GAS.
There has been few researches that treat the effect of crossover and mutation rates in distributed GAS. However, there has been many researches that deal with adaptive parameter settings in distributed GAS since the evolution of the subpopulations is easy to be incorporated into distributed GAS. Back [14] proposed a master-slave distributed GA having a meta-algorithm for optimizing mutation rates.
Pedroso [15] proposed the niche search where the overall population of individuals is assembled into different groups, each of them occupying a particular niche, and the niches must also compete between them. Schnecke & Vornberger [16] also proposed an adaptive parallel GA where several subpopulations execute a sequential GA with different strategies. At fixed intervals these strategies are ranked and each strategy is adjusted to the next better one by assimilating its characteristic parameters. Thus, the best strategy is expanded.
These adaptive approach in distributed GAS, however, introduces additional difficulty in comparing the performance of GA since the additional parameters in distributed GAS such as the subpopulation size, the number of subpopulations, migration scheme, migration ratio, and the migration interval as well as the meta-algorithm used in the evolution of
subpopulations.
3. DETERMINATION OF GA PARAMETERS First, the effect of crossover and mutation rates in canonical and distributed GAS is examined with a standard test function.
Optimization Problems and GA procedures
The optimization problem used here is the maximization of the Rastrigin function (N=lO) (-5.12 <xi < 5.12) [17] : One design variable is represented by 10 bits, and 10 design
f(xilf=,..>=(N * loI +
[ ,& [2-
locos(2mi))
1
variables makes the length of the chromosome 100 bits. A standard GA with a single-point crossover is used with the maximum generations of 1000. The fixed crossover and mutation rates are used in a run, and the combination of the crossover rates of 0.0, 0.1, 0.3, 0.6 and 1.0, and the mutation rates of 0.1/L, l/L and 10/L, where L is the length of the chromosome.
The results are represented by the mean values of the fitness functions of the fittest individuals over 10 trials which are extracted from 12 trials omitting highest and lowest performances. Such treatment alleviates erroneous results caused by the extraordinary values rarely appeared in probabilistic events. The parallel computer used is nCUBE2E with 64 processors, and one processor is assigned to one subpopulation in the distributed GA.
Single Population GA
The effect of crossover and mutation rates on the performance of GAS with a single population (SPGA: Single Population GA) are described here. Two SPGAs were conducted with different population sizes, 180 and 1620, respectively.
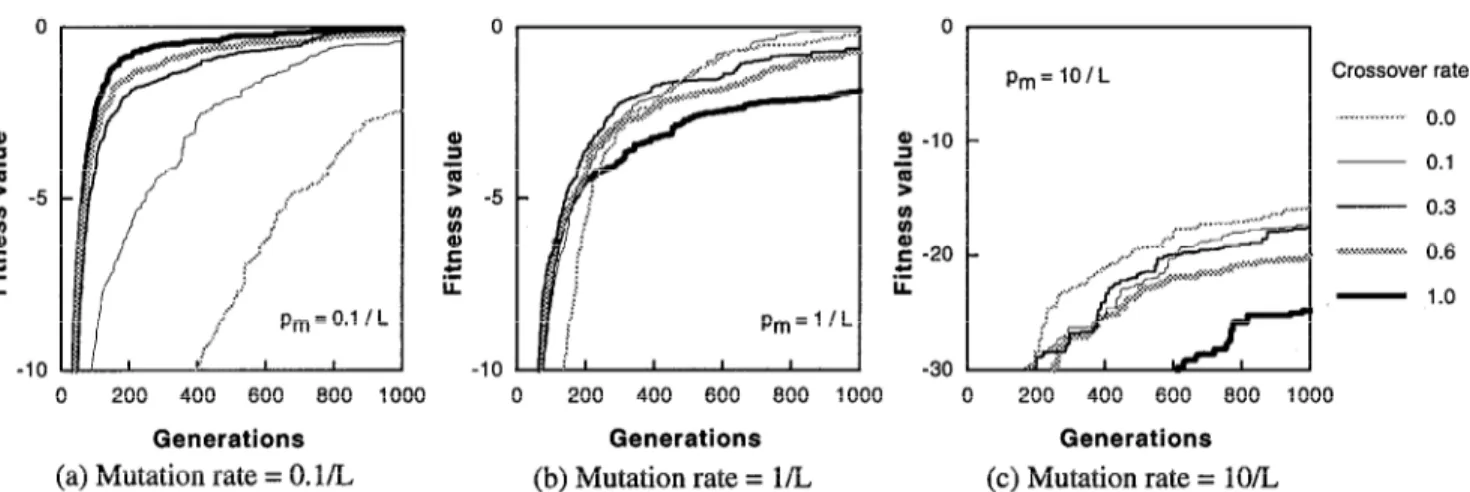
Figure 1 shows the histories of the fitness value for the population size of 1620. In each figure the mutation rate is constant, then the effect of crossover rates under a constant mutation rate can be seen in each figure, while the effect of mutation rates can be seen by comparing these 3 figures.
When the mutation rate is small (p, = 0.1/L), the better results are obtained with the higher crossover rates, that is, the appropriate value of the crossover rate is 1.0 except for the final stage. At the final stage where the fitness value Figure 1: Effect of crossover rate in SPGA (Population size = 1620)
I -696
0
Crossover rate . . . 0.0
~ 0.1
- 0.3
~~,,h.>>.x,x.z 0.6
- 1.0
t] /
pm = 0.1 / L
I I -30
0 200 400 600 800 1000 0 200 400 600 800 lOO( 0 200 400 600 800 1000
Generations Generations Generations
(a) Mutation rate = 0.1/L (b) Mutation rate = l/L (c) Mutation rate = 10/L Figure 2: Effect of crossover rate in MPGA (Population size = 180 x 9)
approaches the global optimum, the fitness value for the crossover rate of 0.3 exceeds the value for the crossover rate of 1.0.
When the crossover rate is very high (p,=lO/L), the results are opposite to the case with the small mutation rate, that is, the better results are obtained with the lower crossover rates.
The appropriate crossover rate is 0.0, that is, the crossover should not be performed. On the other hand, when the crossover rate is medium (p, = l/L), the effect of the crossover rate is remarkable. At the beginning, the rate of 1.0 is appropriate, but the fitness value with the rate of 0.6 exceeds it, then the value with the rate of 0.3 exceeds the fitness value with 0.6. Finally, the fitness value with the rate of 0.1 shows the most excellent performance within the range of 1000 generations. The fitness value with the crossover rate of 0.0 seems to go to the top at a certain generations beyond 1000 generations.
To investigate the effect of the population size on the best crossover rate, the similar numerical experiments with 180 individuals was carried out, and the similar results were obtained. That is, the appropriate crossover rate should be high when the mutation rate is low, it should be low when the mutation rate is high, and it changes along with the generations when the mutation value is medium.
Multiple Population GA
Next, the effect of crossover and mutation rates on the performance of GAS with multiple populations (MPGA:
Multiple Population GA) are described here. Two MPGAs were conducted with 9 subpopulations having different subpopulation sizes, 20 and 180, respectively. The overall population sizes are 180 and 1620, respectively, which are the same as those used in the SPGAs. Therefore, the comparison between SPGA and MPGA can be done for the same overall population sizes. Here, the notation 180 x 9 means that the subpopulation size is 180 and the number of subpopulations is 9.
The migration rate is 0.3 and the migration interval is 20 generations, but these values does not have a large sensitivity to the results. The migration scheme used is random-ring, which means that the destination subpopulations are randomly chosen at every migration under the constraint that the migration is performed from one subpopulation to one subpopulation.
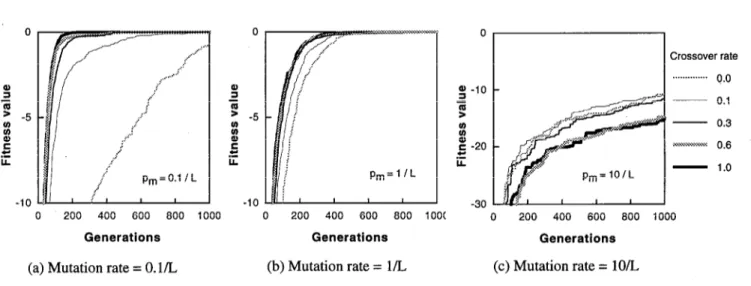
Figure 2 shows the the histories of the fitness value for the 180 x 9 cases. In each figure the mutation rate is constant, then the effect of crossover rates under a constant mutation rate can be seen in each figure, while the effect of mutation rates can be seen by comparing these 3 figures.
When the mutation rate is small (p, = 0.1/L), the better results are obtained with the higher crossover rates, that is, the appropriate value of the crossover rate is 1.0, like the results of the single population GA. The effect of multiple population is remarkable. The fitness function value of the crossover rate of 1.0 reached the global maximum at 280 generations, that means 11 trials out of 12 trials reached the global maximum at 280 generations for the multiple population GA. On the other hand, the fitness value of the crossover rate of 1.0 did not reach the global maximum before 1000 generations for the single population GA. It is clear that the ability of searching the optimum solutions becomes very high with a multiple population scheme, and the superiority of distributed GAS over conventional GAS can be recognized from these results.
When the crossover rate is very high (p, = 10/L), the results are different from those for the single population GA. The best crossover rate is changed along the generations. In the single population GA, the crossover plays a role of global search as the mutation rate is high, so the crossover rate should be decreased as mentioned previously. On the other hand, in the multiple population GA, the crossover play not only a role of global search, but also a role of mating between migrated and native individuals. Therefore, a simple tendency is not observed for the crossover rate in the MPGA. The superiority of distributed GAS over SPGAs can also be recognized from comparing Figures 1 and 2.
When the crossover rate is medium (p, = l/L), it seems that the high crossover rate yields good performance. However, the detail of Fig. 2 (b) shows the similar result as shown in Fig. 1 (b). That is, the effect of the crossover rate is remarkable, like the single population case. At the beginning, the rate of 1.0 is appropriate, but the fitness value with the rate of 0.6 exceeds it, then the value with the rate of 0.3 exceeds the fitness value for 0.6. Similar to the above results, the crossover rate of 0.0 and 0.1 did not show a good performance. The MPGA requires a certain crossover rate for mating between migrated and native individuals.
To investigate the effect of the population size on the best
‘opulalion size x No.
If subpopulations
+ 180x1
+ 1620X1
. . . . l . . . . 20 x 9
--A- 180X9
O.lR l/L 10/L
Mutation rate
Figure 3: Effect of mutation rates under the best crossover rates.
5 0.8 Q t
$ 0.6 0 e ” 0.4 z 2 0.2
Population size x No.
of subpopulations
-o- 180x1
+ 1620x1
. . . . A... 20 x g
__A_ 180x9
0.1/L l/L 1 OIL
Mutation rate
Figure 4: Best crossover rate as a function of mutation rate.
crossover rate in the multiple population GA, the similar numerical experiments with 180 individuals in total was carried out with 9 subpopulations, that is, the subpopulation size is 20. In these experiments, the best crossover rate is 1.0 for the small and medium mutation rates and depend on the generation for the high mutation rate. This can be explained as follows.
In the MPGA, the number of individuals or the subpopulation size is small, and therefore, the diversity of individuals almost disappears, while the diversity of individuals among subpopulations are maintained in the MPGA. In this case, the crossover in each subpopulation does not play any role except for mating between migrated and native individuals.
Consequently, the crossover rate of 1.0 provides the best performance for the small and medium mutation rates. On the other hand, the high mutation rate causes the diversity of individuals even for the small subpopulation size. In this case, the high crossover rate becomes a cause of ruining the good solutions, and the appropriate crossover rate exists.
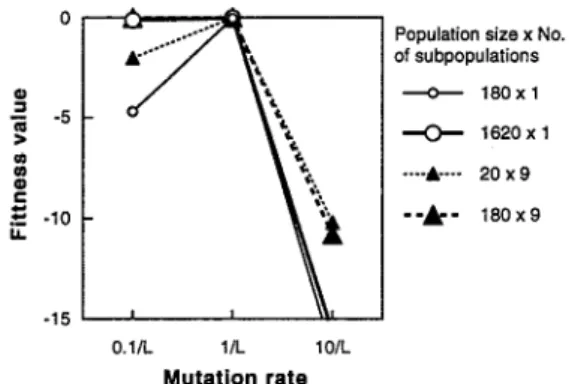
Best GA Parameters
The GA parameters such as the mutation rate and the crossover rate can be suitably determined from the results mentioned above, as shown in Figs. 3 and 4. In Fig. 3, the effect of the mutation rate on the fitness value at 1000 generations is shown, where the crossover rates are best adjusted. It is clear that the mutation rate of 10/L shows poor performance in SPGA and MPGA even with the best crossover rates. This means that high mutation rates makes GAS a simple random search method, and spoils the advantage of GAS.
The mutation rate of l/L shows very excellent performance with the best crossover rates in the single population GA and the multiple population GA and regardless of the population size. The mutation is the fundamental mechanism for producing variations and the mutation rate should be small enough not to ruin good solutions. A commonly used rate of mutation is l/L, that is, one over the string length. The results shown here support this conventional rule. However, the mutation rate of l/L is not always the best value. When the population size becomes large, the best mutation rate is considered to shift from l/L to 0.1/L. With 1620 individuals, the better performance for the mutation rate of 0.1/L is recognized for both SPGA and MPGA. Therefore, the mutation rate of l/L is a commonly used value, but it is not the most suitable value for any conditions.
The best crossover rate is shown as a function of the mutation rate in Fig. 4. It is clear that the best crossover rate decreases as the mutation rate increases except for the MPGA with a small population size. As mentioned before, in the MPGA with a small population size, the diversity of solutions almost disappears after a few generations, and the crossover rate plays only a role of mating between the migrants and the natives. Therefore, the best crossover rate is always 1.0.
Therefore, except for such specific case, is is clear that the best crossover rate decreases as the mutation rate increases.
Also, it is recognized that the the best crossover rate decreases as the population size increases. This is because high crossover rates ruin the good solutions when the variations in the population is large.
4. GA WITH DISTRIBUTED ENVIRONMENTS Distributed Environment Scheme
From the above results, it is concluded that to obtain the best results the crossover rate should be adjusted properly according to the mutation rate, the population size, and the number of populations as well as the problems to be solved.
But, the determination of the best mutation rate and the best crossover rate is a time consuming task. Further, the best crossover rate is changed along with the generations as shown in Figs. 1 (b) and 2 (b). In such cases, the crossover rate should be changed as the generation proceeds, but it is not clear when is the best transition generation for changing the crossover rate.
To overcome these problems, we propose a new distributed GA with a distributed environment scheme. In this scheme, a whole population is divided into several subpopulations, and the GA parameters such as the mutation rate and the crossover rate in each subpopulation are different from each other. The
Figure 5: DEGA (Distributed Environment GA)
I -698
-40
- DEGA
,$l’ :.~
..< .:’
,: ,; ::’ Pop. size = 180
I I 1
,:.:
- DEGA
MPGA
Subpop. size: 20 x 9
1 I I -0.1
DEGA 0.0 0.1 0.3 0.8 1 .o
0 200 400 600 800 1000 0 200 400 600 800 IOOt 300 600 900
Generations Generations Generations
(a) Comparison with SPGA (b) Comparison with MPGA F’ rgure 7: Performance of DEGA compared Figure 6: Performance of DEGA compared with the results for the
various fixed parameters (Overall population size = 1 SO)
migration operation is performed similarly as the conventional distributed GA.
The distributed environment scheme is schematically shown in Fig. 5, where thermometers represent the mutation rate and the heart symbols represent the crossover rate. High temperature means high mutation rates and the big heart symbol means the high crossover rate. This scheme is called the Distributed Environment Genetic Algorithm (DEGA).
With DEGA, it can be expected that the various building blocks of optimum solutions for a particular problems are evolved in various subpopulations, and migration provides the global optimum.
obtained by a SPGA and a MPGA using various mutation and crossover rates for entire populations. The number of combinations of mutation rates and crossover rates is 9, as shown in Table 1, and the performance of DEGA is compared with these 9 results. It should be noted that these fitness values are the average of the fitness of the fittest individuals over 10 trials out of 12 trials omitting the highest and lowest.
The tuning of GA parameters is not necessary with DEGA since many combinations of such GA parameters are used in many subpopulations. Consequently, it can be expected that a global optimum can be easily obtained without any pre- experiments with DEGA.
It is clear that the performance of DEGA is relatively very high although it is not the best. The superiority of DEGA can be recognized from this figure. Further, the comparison of the generations where all the trials provide the global optimum yields the remarkable superiority. Figure 7 shows the detailed part of the convergence for the mutation rate of l/L. The DEGA finds the global optimum in all the trials at 541 generations, and this generation is the first among the others.
Effectiveness of DEGA
To demonstrate the effectiveness of the proposed scheme, a DEGA with 9 subpopulations was performed. The parameters used for the DEGA are the same as those in the MPGA mentioned before except for the fixed crossover and mutation rates. The combination of the mutation and crossover rates in the 9 subpopulations are shown in Table 1. The computer used is a parallel computer, nCUBE2, with 64 processors, and one processor is assigned to one population.
The excellent performance of DEGA is surprising since it has many subpopulations with improper GA parameters. The mechanism for providing such excellent performance is not clear. One possible reason is that the various environments yields better solutions than the best but the same environments. It can be concluded from these results that DEGA is an effective method unless the optimal set of crossover and mutation rates is clear.
The problem here is the maximization of the Rastrigin function (N=lO) , which is the same as the problem in section 3. The performance of DEGA can be seen in Fig. 6 for the overall population size of 180, and the similar results were obtained for the overall population size of 1620. These results show the performance of DEGA compared with the results
The effectiveness of DEGA can be seen more clearly in Fig. 8, where the fitness function at 1000 generations are compared.
It is clear from this figure that DEGA provides superior performance than the best tuned results of SPGA, and it also provides relatively good performance even in MPGA. Thus, the effectiveness of DEGA is confirmed for a standard test function.
Advantage of DEGA
Table 1: Combination of Mutation and Crossover Rates
The advantage of DEGA is clear from the results. If a good solution is required within a limited time and the suitable crossover and mutation rates are not clear, DEGA is one of the best choices. It can be expected that the solution obtained by DEGA is better than the solution by SPGA with optimal parameters, while a long computation time is necessary to obtain them in SPGA. Consequently, DEGA is the fastest way to gain the good solution under the given population size and uncertainty of the appropriate crossover and mutation rates.
with MPGA (Overall population size =180 x 9) for mutation rate of l/L,.
The choice of the combinations of crossover and mutation
A 0.6-IO/L ‘j< ~.O/IO/L
-30 - Figure 8: Effectiveness of DEGA.
SPGA MPGA DEGA
Scheme
rates is not difficult since the mutation rate should vary at around l/L and the crossover rate should vary at around 0.5.
Our results show that the mutation rate of 10/L is considered too large, but 0.1/L is not too small. So, mutation rates of 3/L, l/L and 0.1/L seems a good variation for DEGA.
DEGA is considered to outperform some adaptive GAS mentioned unless they have optimal meta-strategies. Adaptive GAS have a lot of additional parameters or additional complicated mechanisms to maintain the population diversity, and these parameters and mechanisms can be adjusted properly to particular problems. The remarkable advantage of adaptive GAS exists in the possibility of fast convergence and high quality of solutions. However, the possibility becomes low when the adaptation does not work well. On the other hand, DEGA has no complicated mechanism, but it can provide us good solutions.
5. CONCLUSIONS
Experimental verification is established for the effectiveness and the usefulness of the GA with distributed environments in this paper. The effect of crossover and mutation rates on the performance of GAS with a single population and multiple populations is clarified, and the optimum rates vary according to the population size and the problem to be solved. It is found that the optimal rates for a multiple population GA is different from the ones for a single population GA. Thus, the difficulty in determining the optimal set of crossover and mutation rates exists in multiple population GAS, too.
A GA with distributed environments (DEGA) is proposed, and the superiority of this scheme is experimentally proved. For two different types of problems, DEGA shows best performance in comparison with a single population GA having the optimal crossover and mutation rates, and it shows relatively high performance in comparison with a multiple population GA having the optimal crossover and mutation rates. Consequently, DEGA is the fastest way to gain the best solution under the given population size and uncertainty of the appropriate crossover and mutation rates.
Further studies are required to make clear why DEGA has a superior performance although it has very bad or not good
subpopulations. Perhaps, the diversity in the environments in the subpopulations may play an important role, and this could arise the difficulty in devising a new adaptive mechanism for maintaining this diversity.
6. REFERENCES
[l]Miihlenbein, H. “How Genetic Algorithms Really work: I.
Mutation and Hillclimbing,” Proc. 2nd Int. Conf. on Parallel Problem Solving from Nature, Elsevier, 1992, pp. 15-25.
[2]Back, T. “Optimal Mutation Rates in Genetic Search,”
Proc. 5th Int. Conf. on Genetic Algorithms, Morgan Kaufmann, 1993, pp. 2-8.
[3]Schaffer, J., Caruana, R., Eshelman, L. and Das, R.
“A Study of control Parameters Affecting On-Line Performance of Genetic Algorithms fro Function Optimization,” Proc. 3rd Int. Conf. on Genetic Algorithms, Morgan Kaufmann, 1989, pp. 5 l-60.
[4]Tuson, A. & Ross, P. “Cost Based Operator Rate Adaptation: An Investigation,” Proc. 4th Conference of Parallel Problem Solving from Nature, Springer. 1996.
[S]Holland, J.H. “Adaptation in Natural and Artificial Systems,” University of Michigan Press.1975.
[6]Booker, L.B. Binary Strings. C3.3:1 of: Blck.T., Fogel, D.B. & Michalewicz, Z. eds. Handbook of Evolutionary Computation, Oxford University Press. 1997.
[7]Hinterding, R., Gielewski, H. & Peachey, T.C. “The Nature of Mutation in Genetic Algorithms,” Proc . 6th Int. Conf. on Genetic Algorithms, 1995, pp. 65-72.
[8]Blck, T. “The Interaction of Mutation Rate, Selection, and Self-Adaptation Within a Genetic Algorithm,” Proc. 2nd Conference of Parallel Problem Solving from Nature, Elsevier Science Publishers. 1992, pp.85-94.
[9]Hesser, J. & Manner, R. “Towards an Optimal Mutation Probability in Genetic Algorithms,” In H.-P. Schwefel and R.
Manner, eds., Parallel Problem Solving from Nature, Volume 496 of Lecture Notes in Computer Science, 1991, pp. 23-32, Springer.
[lO]Srinivas, M. & Patnaik, L.M. “Adaptive Probabilities of Crossover and Mutation in Genetic Algorithms,” IEEE Transactions on Systems, Man and Cybernetics, Vol. 24, No.
4, 1994,~~. 656-667.
[I l]Smith, J.E. & Fogarty, T.C. “Adaptively Parameterised Evolutionary Systems: Self Adaptive Recombination and Mutation in a Genetic Algorithm,” In H.-M. Voigt, W.
Ebeling, I. Rechenberg and H.-P. Schwefel eds, Parallel Problem Solving from Nature - PPSN IV, Volume 1141 of Lecture Notes in Computer Science, 1996, pp. 441-450, Springer.
[12]Tanese, R. “Distributed Genetic Algorithms,” Proc. of 4th Int. Conf. on Genetic Algorithms, Morgan Kaufmann, 1989, pp. 434-439.
[13]Belding, T. C. “The Distributed Genetic Algorithm Revisited,” Proc. of 6th Int. Conf. on Genetic Algorithms, Morgan Kaufmann, 1995, pp. 114-121.
[ 14]Biick, T. “Parallel Optimization of Evolutionary Algorithms,” In G. Goos, J. Hartmanis and J. Leeuwen eds, Parallel Problem Solving from Nature - PPSN III, Volume 866 of Lecture Notes in Computer Science, 1994, pp. 430-440, Springer.
[ 15]Pedroso, J.P. “Niche Search: An Evolutionary Algorithm for Global Optimization,” In H.-M. Voigt, W. Ebeling, I.
Rechenberg and H.-P. Schwefel eds, Parallel Problem Solving from Nature - PPSN IV, Volume 1141 of Lecture Notes in Computer Science, 1994, pp. 441-450, Springer.
[16]Schnecke, V. & Vornberger, 0. “An Adaptive Parallel Genetic Algorithm for VLSI-Layout Optimization,” In H.-M.
Voigt, W. Ebeling, I. Rechenberg and H.-P. Schwefel eds, Parallel Problem Solving from Nature - PPSN IV, Volume
1141 of Lecture Notes in Computer Science, 1996, pp. 859- 868, Springer.
[17]Whitley, D., Mathias, K., Rana, S. and Dzubera, J.
“Building Better Test Functions,” Proc. 6th Int. Conf. on Genetic Algorithms, Morgan Kaufmann, 1995, pp. 239-246.
I -700