Proceedings of the ASME 2012 International Mechanical Engineering Congress & Exposition IMECE2012 November 9-15, 2012, Houston, Texas, USA
IMECE2012-86220
CONTACT ANALYSIS CONSIDERING SURFACE STRESS AND SURFACE ELASTICITY - INCREASE OF INDENTATION HARDNESS AND YIELD STRESS -
Takao Hayashi Department of Material Science
Graduate School of Nagaoka University of Technology Nagaoka, Niigata 940-2188, Japan
E-mail: [email protected]
Hideo koguchi
Department of Mechanical Engineering Nagaoka University of Technology Nagaoka, Niigata 940-2188, Japan E-mail: [email protected]
ABSTRACT
An increase in indentation hardness with decreasing indentation depth has been observed in nanoindentation studies.
It is known as the indentation size effect. The indentation modulus in Molecular Dynamics (MD) contact analysis is larger than that in theoretical analysis (Hertz contact theory). In this paper, elasto-plastic contact analysis for an anisotropic elastic half-space is performed using the surface Green’s function considering surface stress and surface elasticity. A contact analysis is conducted to investigate the effect of surface stress on yield stress and indentation hardness. The discrete convolution, fast Fourier transform method and conjugate gradient method are applied to the contact analysis. The hardening model of the elasto-perfect plastic law is used in this study. The yield stress is determined so that a contact area considering surface stress is agreed with the one ignoring surface stress. Then, the yield stress ignoring surface stress and surface elasticity fixed at a constant. It is found that the yield stress considering surface stress and surface elasticity increases with decreasing the indentation depth. The indentation hardness considering surface stress and surface elasticity is calculated using the determined yield stress. The effects of surface stress and surface elasticity on the indentation hardness and the yield stress is discussed.
INTRODUCTION
Recent developments in technology require the measurement of physical and chemical properties of the material surface. It is necessary to measure the material properties in the nanoscale region for manufacturing extremely sensitive sensors. Gibbs [1] introduced the concept of surface stress in solids. The energy of atoms near free surface is different from that of atoms in bulk. The surface stress related
from surface energy affect the mechanical behavior in the nanoscale region. Ibach [2] reviewed previous research related to surface stress. He reported the importance of the surface stress on the deformation in a small cantilever. Muller and Saul [3] reviewed the effects of surface stress and surface elasticity on surface phenomena in surface physics. The effect of surface stress on the elastic deformation and stress analysis for isotropic materials investigated in a few studies [4,5]. Koguchi [6] analyzed the contact problem for an isotropic elastic half- region coated with a thin film considering surface stress and surface energy. However, mechanical behavior in nanoscale structures depends on the anisotropy of the crystal structure.
Stroh's formalism is a mathematically elegant and technically powerful method for deriving the Green’s function of an anisotropic elastic material(see reference [7]). Tingand Lee [8], Yang and Pan [9] derived Green’s functions for general anisotropic elastic materials. Koguchi [10] derived a surface Green’s function for anisotropic materials considering surface stress and surface elasticity. The displacement field obtained using the Green’s function considering surface stress and surface elasticity exhibited good agreement with the displacement field obtained by the MD method. Koguchi show the distribution of displacement uz for several values of surface stress and surface elasticity. The effect of several values for surface elasticity on uz is less than that for surface stress.
Contact problems for anisotropic elastic materials have been considered previously. Barber and Ciavarella, [11] and Ting [12] reviewed some research of contact analysis for anisotropic materials. Vlassak and Nix [13] determined lead to the indentation modulus of a general anisotropic material. They investigate a contact problem for anisotropic elastic half-space
of a flat circular punch and an axisymmetric paraboloidal indenter. Vlassak and Nix [14] investigated the indentation modulus and compared the indentation modulus by contact analysis with the micro indentation test. Fan and Hwu[15]
investigated the contact between a punch and a general anisotropic elastic half-space. Lin and Ovaert [16] and He and Ovaert [17] investigated a rough surface contact problem for three- and two-dimensional anisotropic materials, respectively.
Lin and Ovaert used the conjugate gradient (CG) method by the Polonsky and Keer [18] to determine the contact area and contact pressure distribution. The conjugate gradient method guarantees fast convergence. Furthermore, Lilleodden et al.[19]
and Tsuru and Shibutani [20] used the molecular dynamics (MD) method for contact analysis. Lilleodden et al. [19]
compared the result obtained using the MD method with those using anisotropic contact theory by Vlassak and Nix[13] and showed that the indentation modulus for Au(111) obtained using the MD method is larger than that obtained by the anisotropic contact theory. The result of the contact analysis using MD method includes the surface properties, however, the anisotropic contact theory by Vlassak and Nix was not considered the surface properties. The surface properties must be considered in analyzing the mechanical behavior in a nanoscale domain. Koguchi and Hayashi [21] performed a contact analysis for anisotropic material considering surface stress and surface elasticity of Au(111) using the surface Green’s function derived by Koguchi[10]. In their study, the indentation modulus obtained by contact analysis considering surface stress and surface elasticity agrees with that obtained using the MD method by Lilleodden et al. [19]. In their study, the indenter was rotated with respect to the z-axis, which was perpendicular to the surface. The penetration depth of the elliptic and Knoop indenters was found to vary with the rotation angle of the indenter due to material anisotropy, whereas the penetration depth of the Berkovich and Vickers indenters varied only slightly.
In the nanoindentation test, indentation hardness increased with decreasing indentation depth. It is known as the indentation size effect (ISE). Nix and Gao [22] developed indentation size effect model for a conical indenter based on geometrically necessary dislocations. Swander et al. [23]
proposed a model for indentation size effect for indenters of general shapes. Zhang et al. [24] introduced indentation size effect model included with an apparent surface stress. The value of surface stress by Zhang et al. is larger than that known as a surface stress in solid materials.
Jacq et al. [25] developed a three-dimensional elasto- plastic contact code. In their analysis, the residual stress from plastic strain in a half-space is given by the expression of stress for a cuboidal inclusion with eigenstrains derived by Chiu [26, 27]. Wang et al. [28] investigated the elasto-plastic contact analysis based on the work of Jacq et al. with different hardening behavior (perfect plastic, linear hardening, and power law hardening).
The influence of surface stress on the indentation hardness and yield stress in nanoindentation test is investigated. In this paper, the value of yield stress and indentation hardness considering surface stress and surface elasticity are obtained by the elasto-plastic contact analysis. First, contact analysis is carried out for various value of indenter radius. Second, the values of indentation hardness and yield stress considering surface stress and surface elasticity are investigated for several values of surface stress.
THEORY
Surface Green function considering surface stress and surface elasticity
A more detailed derivation of the surface Green’s function considering surface stress and elasticity is provided in Reference [10]. In the present study, we present an outline of the derivation of the surface Green’s function.
The equilibrium equation for anisotropic materials can be expressed in terms of the displacement, ui, as follows:
Cijkluk,lj=0 (1)
where Cijkl is the elastic stiffness. Applying the two-dimensional Fourier transform to the above equilibrium equation, we obtain
Ci!k"#!#"ˆuk+i C
(
i!k 3+Ci 3k!)
#!ˆuk,3$Ci 3k 3ˆuk,33=0. (2)Here, the two-dimensional spatial Fourier transforms are defined as follows:
fˆ
(
!1,!2,x3)
= f x(
1,x2,x3)
ei(!1x1+!2x2)dx1dx2"#
$
#"#
$
#f x
(
1,x2,x3)
= 14%2
fˆ
(
!1,!2,x3)
e"i(!1x1+!2x2)d!1d!2"#
$
#"#
$
# (3)Here, the general solution of Eq. (2) can be expressed as follows:
uˆ
(
!1,!2,x3)
=a(
!1,!2)
e"ip#x3 (4)where p and a satisfy the following eigenrelation:
Q+p
(
R+RT)
+p2T{ }
a=0 (5)and Qi k = Ci j k snjns, Ri k = Ci j k snjms, an d Ti k = Ci j k smjms w ith n = [n1, n2, 0] = [cos θ, sin θ, 0]T and m = [0,0,1].
Next, the boundary condition is written using an equilibrium relationship of the surface stress tensor !"#, the bulk stress σi j, and the traction vector ti, as follows:
On the tangential plane of the surface:
!i"#i$%"&,&=t" (6)
In the normal direction of the surface:
!i3"i#$µ%&µ%"3=t3 (7)
where !µ"=#2u3 #xµ#x"
x3=0 is the curvature tensor of the deformed surface, ν1 and ν2 are the unit vectors in the tangential direction of the surface, ν3 is the unit normal vector of the surface, α, β, and µ = 1,2 correspond to the rectangular coordinates on the surface, and i = 1,2,3 corresponds to the rectangular coordinates,
Surface stress and surface strain are related by the surface elastic constant:
!"#=!"#0 +d"#$%&$%s (8)
where !"#
0 is the surface stress tensor for zero surface strain induced by an external load, d!"#$ is the surface elastic modulus, and !"#s is the surface strain. Surface stress depends linearly on surface strain.
Substituting Eq. (8) into Eqs. (6) and (7), the boundary condition can be expressed in matrix form as follows:
tˆ=!i"
(
b+i"F)
(9)where
b=
(
RT+pT)
a=!1p(
Q+pR)
a (10)and
F=
d1!1"n!n" d1!2"n!n" 0 d2!1"n!n" d2!2"n!n" 0
0 0 #$!0 n$n!
%
&
' ' '
(
)
*
*
*
. (11)
The general solution is obtained by superposing three solutions of Eqs. (5) and (9) associated with pj and aj, j = 1,2,3, which are eigenvalues and the corresponding eigenvectors, respectively, as follows:
uˆ
(
!1,!2,x3)
=A e"ip*#x3 q (12)tˆ
(
!1,!2,x3)
="i#(
B+i#F)
e"ip*#x3 q (13)where F is a real matrix, A = [a1, a2, a3], B = [b1, b2, b3],
e!ip*"x3 =diag#$e!ip1"x3,e!ip2"x3,e!ip3"x3%&, and q is a complex vector
that is to be determined. Next, let us consider the case in which a uniform force t is distributed on a surface can be expressed as
t
(
x1,x2, 0)
=f!(
x1,x2)
(14)where f = (f1,f2,f3). The Fourier transform is applied to Eq. (14), and the following equation is derived:
uˆ
(
!1,!2,x3)
= i"A e#ip*"x3
(
B+i"F)
#1f. (15) The corresponding physical-domain solutions can be derived by the inverse Fourier transform of the transformed-domain solution, i.e., Eq. (15). Here, we introduce the polar coordinate systems related to (x1, x2) by x1=rcos!0 and x2=rsin!0, and (η1, η2) by !1="cos# and !1="cos#:u
(
r,!0,x3)
=2"1#2Im A$
0
%
# fd! (16)where
!rk="rk gjrk
# $hjrk
e$i#%kd#
0
&
'
j=1 3
(
="rk gjrke$ihjrk%k)
(
0,$ihjrk%k)
j=1 3
(
(17)
and !k =pkx3+rcos
(
" #"0)
and !(
a,z)
=$
z#ta"1e"tdt.The Green’s function ignoring surface stress and surface elasticity can be derived by letting the matrix F in Eq. (15) approach 0, after which the inverse Fourier transform is applied to the equation, as follows:
u
(
r,!0,x3)
=4"i2 A e#ip*$x3 B#1fe#ir$cos(!#!0)d$d!0
&
% 02"
&
= i
4"2 A e#i$(p*x3+rcos(!#!0))
0
&
% d${ }
B#1fd!0 2"
&
(18)
Here, x3 < 0, and Im p* > 0.
Integrating Eq. (18) with respect to ρ yields u r,!
(
0,x3)
= 14"2 A 1
p*x3+rcos
(
! #!0)
B#1fd!
0 2"
$
(19)Contact theory
Now, the surface Green’s function is applied to the contact problem. Surface deformation w(x1,x2) can be expressed in terms of influence coefficient K and contact pressure p(x1,x2) , as follows:
w x
(
1,x2)
= "#p(
!1,!2)
K x(
1"!1,x2"!2)
d!1d!2$
#"#
$
# . (20)Next, applying the Fourier transform to Eq. (20) yields
wˆ
(
!1,!2)
=pˆ(
!1,!2)
Kˆ(
!1,!2)
(21)where, K(x1,x2) = u3(x1,x2,h) . In the present paper, a discrete convolution and fast Fourier transform (DC-FFT) method proposed by Liu et al.[29] is used to solve Eq. (21).
The normal contact problem between two bodies can be described by a set of equations that must be solved simultaneously. These equations are,
1. The surface separation equation.
The gap between two surfaces, gi j, can be expressed as
gij =hij!" +wij (22)
where hi j is the initial geometry, δ is the rigid displacement, and wi j is the surface displacement of both bodies.
Fig. 1 Modification of the pressure distribution for elasto- plastic contact analysis.
2. The load balance equation.
The sum of contact pressure distribution pi j must be equal to the external load W.
pij
!
=W (23)3. The contact conditions equation.
The bodies cannot interpenetrate each other. If the point is inside the contact region, the gap must be zero, otherwise, i.e., if the point is outside the contact region, the gap is larger than zero. The contact pressure is positive if the point is inside the contact region and is zero if the point is outside the contact region.
In contact: gij=0 then pij<0 (24) In separation: gij>0 then pij=0 (25) In the present paper, the system is solved using the conjugate gradient method [18], which solves the contact problem efficiently such that the contact pressure and the contact region can be determined simultaneously.
The upper limit on the contact pressure in contact analysis is imposed. The limiting pressure means a yield stress of the materials. As shown in Figure 1, the contact pressure does not exceed the limiting pressure. The region that pressure reached for the limiting pressure is a plastic region. This idea is the simplified elasto-perfectly plastic contact model. The following condition of the limiting pressure is added to the code of contact analysis
pij!pmax. (26)
where pmax is a yield stress of the materials. In conjugate gradient code, Eq. (26) is added to Eq. (24).
ANALSYS AND DISCUSSION
Indentation hardness and yield stress considering surface stress and surface elasticity
The indentation hardness is calculated using this equation H= P
Ap , (26)
where Ap is a contact projection area of yielding region and P is a indentation load.The contact projection area of yielding region is determined by multiplied unit lattice area by the number of lattice points which reached the yield stress.
The method obtained by the yield stress considering surface stress and surface elasticity is described. The yield stress in nanoindentation test increased with decrease indentation depth [30]. Thus, the surface stress has an effect on the yield stress. The following condition is employed in order to obtain the yield stress considering surface stress and surface elasticity. The indentation hardness is the same as considering and ignoring surface stress and surface elasticity under a fix load, i.e. the area of yielding region is the same. First, contact analysis ignoring surface stress and surface elasticity is performed, and the area of yielding region is obtained for each values of the indentation load. Next, contact analysis considering surface stress and surface elasticity is performed for an assuming any values of yield stress, and yielding area is obtained. The yield stress considering surface stress and surface elasticity is determined when the area of yielding region considering surface stress and surface elasticity agrees with that ignoring them. The yield stress is decided for each condition of loads, radiuses of indenter and surface stresses.
Contact analysis for a different radius of spherical indenter
An elasto-plastic contact analysis for a rigid spherical indenter with three types of radius R=200, 400, 1000nm and a flat surface of Cu(111) plane was performed. The elastic
0.84 0.82 0.80 0.78 0.76 0.74
Yield stress, GPa
6 10 2 3 4 5 6 100 2 3 4 5 6 1000 Load P, nN
R=200nm, R=400nm R=1000nm
Fig. 2 The relationship between yield stress and indentation load for indenters.
1
2 4
10
2 4
100
2 4
1000
Load P, nN
2 3 4 5 6 7 8 9
0.1 2 3 4
Indentation depth !, nm
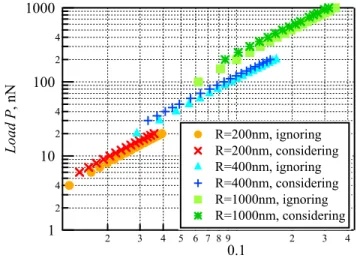
R=200nm, ignoring R=200nm, considering R=400nm, ignoring R=400nm, considering R=1000nm, ignoring R=1000nm, considering
Fig. 3 Elasto-plastic contact analysis for indenters.
“ignoring”: ignoring surface stress and surface elasticity.
“considering”: considering surface stress and surface elasticity.
constants for Cu(111) is C11=213.5, C12=147.8, C13=138.7, C15=12.96, C33=222.7, C44=23.67 and C66=32.833GPa. Here, the transformation between Cijks and C!"is accomplished by replacing the subscripts ij (or ks) by α (or β) using the following rules: subscripts ij (or ks) 11 to α (or β) 1, 22 to 2, 33 to 3, 23 or 32 to 4, 31 or 13 to 5, and 12 or 21 to 6.
The value of surface stress and surface elastic modulus were calculated by the MD method. Here, FS potential derived by Finnis and Sinclair [31] was used in MD analysis. FS potential is expressed as follows:
Etot=1
2 V r
( )
!"!#"
$
%A F( )
&!!
$
, (27)where, r!" is a distance between atoms α and β, F(ρ) is an embedded atom function and is expressed as F(!")=(!")1/2,
and !" is the electron density and is given by
!"=
%
"#( )
r"$ , (28)V(r) and F(r) are the contribution of repulsion force between an atom and the electron density. Here, V(r) and φ(r) are expressed by the following equations
!
( )
r = Ak(
Rk"r)
3H R(
k"r)
k"1 2
#
, (29)V r
( )
= ak(
rk!r)
3H r(
k!r)
k!1 6
"
, (30)where, H(r) is the Heaviside step function. The potential parameters for Cu are a1=29.059214 eV, a2=-140.05681 eV, a3=130.07331 eV, a4=-17.48135 eV, a5=31.82546 eV, a6=71.58749 eV, A1=9.806694 eV, A2=16.774638 eV, R1=1.2247449 eV, R1=1.0 1/a0, r1=1.2247449 1/a0, r2=1.1547054 1/a0, r3=1.1180065 1/a0, r4=1.0 1/a0, r5=0.8660254 1/a0, r6=0.7071068 1/a0, and a0(=3.615nm) is the lattice constant of Cu.
The value of surface stresses τij for Cu(111) are obtained τ11=τ22=1.49N/m and τ12=0N/m, and the value of surface elastic modulus d!"#$ are d1111=d2222=-7.34N/m, d1122=-2.93N/m and d1212=-1.38N/m. The grid numbers of analysis domain is 512×512 and the grid spacing of that is 0.10nm. The influence coefficient is calculated using the surface Green's function.
The yield stress considering surface stress and surface elasticity is obtained for each radius of spherical indenter. The yield stress ignoring surface stress and surface elasticity is set to 744MPa. This value is the indentation hardness in Cu(111).
The determined yield stress is shown in Fig. 2. The horizontal axis is a logarithmic scale. The yield stress decreases with increasing the indentation load. The yield stress is almost linear
1.3 1.2 1.1 1.0 0.9 0.8 0.7
Hardness H, GPa
400x10-6 350
300 250 200 150 100
!/R
R=200nm R=400nm R=1000nm
Fig. 4 The relationship between the indentation hardness and h/R for indenters.
0.90
0.85
0.80
0.75
0.70
Yield stress, GPa
3 4 5 6 7 8 9
100 2
Load P, nN
!xx and !yy, N/m 0.1 0.5 1 1.49 2
Fig. 5 The relationship between yields stress and indentation load for various values of surface stress.
2 3 4 5 6 7 8
1009 2
Load P, nN
3 4 5 6 7 8 9
0.1 Indentatino depth ! , nm
"xx and "yy, N/m 0.1 0.5 1 1.49 2
Fig. 6 Elasto-plastic contact analysis for various values of surface stress.
at the region where yield stress increases. The lower limit of yield stress is about 744MPa.
Contact analysis considering surface stress and surface elasticity is carried out using the determined the yield stress.
Figure 3 shows the relationship between indentation depth and the indentation load in elasto-plastic contact region. In this figure, “ignoring” expresses the result ignoring surface stress and surface elasticity and “considering” expresses the result considering them. The indentation depth considering surface stress and surface elasticity is smaller than that ignoring them under a fixed load. It is shown that the material stiffness considering surface stress and surface elasticity is larger than that ignoring them. The difference of indentation depth between considering and ignoring surface stress and surface elasticity decreases with increasing the indentation load. The effect of surface stress on material stiffness decreases with increasing indentation depth.
The indentation hardness considering surface stress and surface elasticity is calculated using Eq. (26). Figure 4 shows the result of indentation hardness considering surface stress and surface elasticity. The horizontal axis is δ /R, here δ is the rigid displacement and R is the radius of the indenters. The variation with δ/R of the indentation hardness is similar to each other.
The trend of the indentation hardness is found to be almost the same by δ/R. Gerberich et al. [32] showed the relationship between hardness normalized by yield stress and indentation depth in nanoindentation tests. The relationship between the normalized hardness and indentation depth deduce in their studies is similar to that deduced in the present analysis.
Contact analysis for several values of surface stress Next, the yield stress and the indentation hardness are investigated for various values of surface stress. The radius of rigid spherical indenter is 400nm. The values of surface stress
τxx and τyy are 0.1, 0.5, 1.0, 1.49, and 2N/m. Figure 5 shows the relationship between the yield stress and various values of surface stress. The yield stress for 0.1N/m and 0.5N/m values of surface stress are almost constant for each load. The yield stress increases with decreasing the indentation load when the value of surface stress is larger than 1.0N/m. Therefore, the surface stress has an effect on the material stiffness when the value of surface stress is larger than 1.0N/m.
Figure 6 shows the relationship between the indentation load and indentation depth curve for various values of surface stress. The load-indentation depth curves for 0.1N/m and 0.5N/m of surface stress are similar. The indentation load for surface stress 2N/m is the smallest in various values of surface stress. Consequently, the material stiffness increases with increasing the value of surface stress. The difference of indentation depth between surface stress 0.1N/m and 2N/m diminish with increasing the indentation load. The relationship between the indentation load and indentation depth curve is the same way as Fig. 3, the effect of surface stress on material stiffness decreases with increasing the indentation depth.
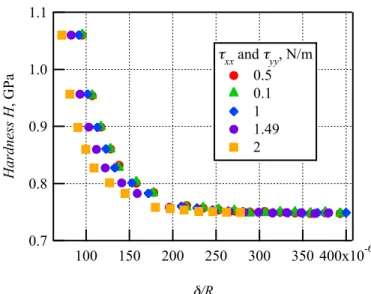
Figure 7 shows the curve of the indentation hardness against δ/R. The curve of the indentation hardness for each values of surface stress is different from each other. In Fig. 4, the indentation hardness for each radius of indenters is similar to each other. Therefore, the relationship between the indentation hardness and δ/R is decided by the stiffness of the materials.
In order to extend the present analysis to the other hardening rules following the study of Jacq et al.,, the derivation for the expression of the residual stress of plastic strain is needed. There are some expressions for anisotropic materials of the residual stress, but the expression considering surface stress and surface elasticity does not exist. The expression of residual stress for anisotropic materials considering surface stress and surface elasticity will be derived.
CONCLUSION
Elasto-plastic contact analysis considering surface stress and surface elasticity was conducted. The yield stress and the indentation hardness for a few radiuses of spherical indenters and various values of surface stress were investigated. It was found that the trend of the indentation hardness against δ/R was similar when the size of indenters was different. The relationship between the indentation hardness and δ/R for various values of surface stress were different from each other.
ACKNOWLEDGMENTS
The present study was supported by a Grant-in-Aid for Scientific Research (B) (No. 90143693).
1.1
1.0
0.9
0.8
0.7
Hardness H, GPa
400x10-6 350
300 250 200 150 100
!/R
"xx and "yy, N/m
0.5 0.1 1 1.49 2
Fig. 7 The relationship between the indentation hardness and h/R for various values of surface stress.
NOMENCLAURE Cijkl =Elastic constant
ui =Displacement p=Stroh Eigenvalues ai =Stroh Eigenvectors
!"# =Surface stresses
d"#$% =Surface elastic constants
&"# =Curvature of the deformed surface 'i =Unit vector of surface
("#s =Surface strain
gij =Gap of two surfaces hij =Initial gap of two surfaces wij =Surface displacement
pij =Pressure distribution pmax=Yield stress
)=Rigid displacement H =Hardness
P=Indentaiton load
Ap =Contact projection area of yielding region R=The radius of spherical indenters
REFERENCES
[1] Gibbs, J. W., 1928, The Collected Works of J.W. Gibbs, Longmans, Green and Co., New York.
[2] Ibach, H., 1997, “The Role of Surface Stress in Reconstruction, Epitaxial Growth and Stabilization of Mesoscopic Structures,” Surf. Sci. Rep., 29, pp. 195–263.
[3] Muller, P., and Saul, A., 2004. “Elastic Effects on Surface Physics” Surf. Sci. Rep., 54, pp. 157-258.
[4] He, L. H., Lim, C. W., 2006. “Surface Green Function for a Soft Elastic Half-Space: Influence of Surface Stress,” Int. J.
Solids Struct., 43, pp. 132-143.
[5] He, L. H., and Li, Z. R., 2006, “Impact of Surface Stress on Stress Concentration,” Int. J. Solids Struct., 43, pp. 6208–6219.
[6] Koguchi, H., 2004, “Contact and Adhesion Analysis Considering a Variation of Surface Stresses (2nd Report, a Comparison of the Present Theory and JKR Theory),” Trans.
Jpn. Soc. Mech. Eng., A 70, pp. 1332-1340.
[7] Ting, T. C. T., 1996, Anisotropic Elasticity: Theoty and Application. Oxford University Press, New York.
[8] Ting, T. C. T., Lee, V.-G., 1997, “The Three-Dimensional Elatostatic Green's Function for General Anisotropic Linear Elastic Solids,” Q. J. Mech. Appl. Math., 50, pp. 407-426.
[9] Yang, B., and Pan, E., 2001, “Three-Dimensional Green's Functions in Anisotropic Trimaterials,” Int. J. Solids Struct., 39, pp. 2235-2255.
[10] Koguchi, H., 2008, “Surface Green Function With Surface Stresses and Surface Elasticity Using Stroh's Formalism,”
Trans. ASME. J. Appl. Mech., 75, 061014.
[11] Barber, J. R., Ciavarella, M., 2000, “Contact Mechanics,”
Int. J. Solids Struct., 37, pp. 29-43.
[12] Ting, T. C. T., 2000, “Recent Developments in Anisotropic Elasticity,” Int. J. Solids Struct., 37, pp. 401-409.
[13] Vlassak, J. J., Nix, W. D., 1993, “Indentation Modulus of Elastically Anisotropic Half Spaces,” Philos. Mag. A., 67, pp.
1045-1056.
[14] Vlassak, J. J., Nix, W. D., 1994, “Measuring the Elastic Properties of Anisotropic Materials by Means of Indentation Experiments,” J. Mech. Phys. Solids, 42, 1223-1245.
[15] Fan, C. W., Hwu, C., 1996, “Punch Problems for an Anisotropic Elastic Half-Plane,” ASME J. Appl. Mech., 63, pp.
69-76.
[16] He, L., Oavert, T.C., 2008, “Three-Dimentional Rough Surface Contact Model for Anisotropic Materials,” ASME J.
Tribol., 130, 021402.
[17] Lin, Y., Ovaert T. C., 2004 “A Rough Surface Contact Model for General Anisotropic Materials,” ASME J. Tribol., 126, pp. 41-49.
[18] Polonsky, I. A., Keer, L. M., 1999, “A Numerical Method for Solving Rough Contact Problems Based on the Multi-Level Multi-Summation and Conjugate Gradient Techniques,” Wear, 231, pp. 206-219.
[19] Lilleodden, E. T., Zimmerman, J. A., Folies, S.M., Nix, W.D., 2003, “Atomistic Simulations of Elastic Deformation and Dislocation Nucleation During Nanotindentation,” J. Mech.
Phys. Solids, 51, pp. 901-920.
[20] Tsuru, T., Shibutani Y., 2007, “Anisotropic Effects Inelastic and Incipient Plastic Deformation under (001), (110) and (111) Nanoindentation of Al and Cu,” Phys. Rev. B, 75, 035415.
[21] Koguchi, H., Hayashi, T., 2009, “Contact Analysis for Anisotropic Mterials Considering Surface Stresses and Surface Elasticity,” Trans. Jpn. Soc. Mech. Eng. A, 75, pp. 1029-1036.
[22] Nix, W. D., and Gao, H., 1998, "Indentation Size effects in Crystalline Materials : A Law for Strain Gradient Plasticity," J.
Mech. Phys. Solids, 46, pp. 411-425.
[23] Swadener, J. G., George E. P., and Pharr, G. M., 2002,
"The Correlation of the indentation Size Effect Measured with Indenter of Various Shapes," J. Mech. Phys. Solids, 50, pp.
681-694.
[24] Zhang, T-Y., and Xu, W-H., 2002, “Surface Effect on Nanoindentation,” J. Mater. Res., 17, pp. 1715-1720.
[25] Jacq, C., Neiles, D., Lormand, G., and Girodin, D., 2002,
“Development of a Three-Dimensional Semi-Analytical Elastic-Plastic Contact Code,” ASME J. Tribol., 124, pp. 653- 667.
[26] Chiu, Y. P., 1978, “On the Stress Field and Surface Deformation in a Half- Space With a Cuboidal Zone in which Initial Strains Are Uniform,” ASME J. Appl. Mech., 45, pp.
302-306.
[27] Chiu, Y. P., 1977, “On the Stress Field due to Initial Strains in a Cuboid Surrounded by an Infinite Elastic Space,”ASME J. Appl. Mech., 44, pp. 587-590.
[28] Wang, F. and Keer, L.M., 2005, “Numerical Simulation for Three Dimentional Elastic-Plastic Contact with Hardening Behavior,” ASME J. Tribol., 127, pp. 494-502.
[29] Liu, S., Wang, Q., Liu, G., 2000, “A Versatile Method of Discrete Convolution and FFT (DC-FFT) for Contact Analysis,” Wear, 243, pp. 101-111.
[30] Gerberrich, W. W., Kramer, D. E., Tymiak, N. I., Volinsky, A. A.,Bahr, D. F., and Kriese, M.D., 1999, "Nanoindentation- Induced Defect-Interface Interactions: Phenomena. Methods and Limitations," Acta mater., 47, pp. 4115-4123.
[31] Finnis, M. W., and Sinclair, J. E., 1984, “A Simple Empirical n-Body Potential for Transition Metals,” Philos. Mag.
A, 50(1), pp. 45–55, 1986, Philos. Mag. A, 53(1), p. 161(E).
[32] Greberich, W. W., Tymiak, N. I., Grunlan, J. C., Horstemeyer, M. F., and Baskes, M. I., 2002, “Interpretations of Indentation Size Effect,” ASME J. Appl. Mech., 69, pp. 433- 442.