Detailed analysis of molecular volume, surface
area, and elasticity in the saturated
phospholipid/cholesterol binary membrane
system
著者(英)
Tsubasa Miyoshi
学位名
博士(理学)
学位授与機関
関西学院大学
学位授与番号
34504甲第564号
URL
http://hdl.handle.net/10236/00025135
Detailed analysis of molecular volume,
surface area, and elasticity in the
saturated phospholipid
/cholesterol
binary membrane system
A Thesis for the Degree
of
Doctor of Science
Submitted to School of Science and Technology
Kwansei Gakuin University by
Contents
Abstract 4
Abbreviations 6
1 Introduction 10
1.1 Biomembrane – Composition and Function . . . 10
1.2 Structure and Properties of Phospholipid and Cholesterol . . . 11
1.2.1 Phospholipid . . . 11
1.2.2 Cholesterol . . . 11
1.3 Phase Behavior in the Phospholipid Bilayer and Monolayer System . . . 12
1.3.1 Phospholipid Bilayer . . . 12
1.3.2 Phospholipid Monolayer . . . 14
1.4 Lipid Rafts Hypothesis and Liquid-ordered (Lo) Phase . . . 14
1.5 Previous Research in the Phospholipid/Cholesterol Membrane System . . 15
1.6 Purpose of This Study . . . 16
2 Materials and Methods 25 2.1 Materials . . . 25
2.2 Buoyant Density Measurement . . . 26
2.2.1 Neutral Flotation Method . . . 26
2.2.2 Partial Molecular Volume Analysis . . . 28
2.3 Fluorescence Decay Measurement . . . 29
2.3.1 Sample Preparation . . . 29
2.3.2 Fluorescence Decay of trans-parinaric acid . . . 29
2.4 Langmuir Monolayer Study . . . 30
2.4.1 Surface Pressure – Area (π − A) Isotherm Measurement . . . 30
2.4.2 Analysis of π − A Isotherms . . . 31
3 Results 40 3.1 Detailed Volumetric Behaviors of the Saturated Diacylphosphatidylcholine/Cholesterol Binary Bilayer System . . . 40
3.1.1 DPPC/Cholesterol Binary Bilayer System . . . 40
3.1.2 Diacylphosphatidylcholine Chain Length Dependence of Volumetric Behaviors . . . 43
3.2 Fluorescent Decay Analysis . . . 45
Conclusion I – The Saturated Diacylphosphatidylcholine/Cholesterol Binary Bilayer System 46 3.3 Detailed Surface Area Behavior of the Saturated Diacylphosphatidylcholine/Cholesterol Binary Monolayer System . . . . 47
3.3.1 DPPC/Cholesterol Binary Monolayer System . . . 47
3.3.2 Diacylphosphatidylcholine Chain Length Dependence of Surface Area Behaviors . . . 50
Conclusion II – The Saturated Diacylphosphatidylcholine/Cholesterol Binary Monolayer System 52 4 Discussion 75 4.1 Molecular Volume Analysis in the Saturated Diacylphosphatidylcholine/Cholesterol Binary Bilayer System . . . 75
4.1.1 Partial Molecular Volume of Diacylphosphatidylcholine . . . 75
4.1.2 Partial Molecular Volume of Cholesterol . . . 76
4.1.3 Molecular Interaction in the LoPhase . . . 77
4.2 Molecular Area Analysis in the Saturated Diacylphosphatidylcholine/Cholesterol Binary Monolayer System . . . . 79
4.2.1 Molecular State in the Cholesterol-induced Condensed (CC) Phase 79 4.2.2 A Three-state Model to Explain the Phase States in the DPPC/Cholesterol Monolayers at 30 mN/m . . . 80
4.2.3 Simple Simulation to Explain the Behaviors of A(xchol) and Cs−1(xchol) Profiles . . . 82
Appendix. A: Effect of the Interaction Volume on the Partial Molecular Volume in the DPPC/Cholesterol Binary Bilayer System . . . 92 Appendix. B: Simple Three-state Model for the Phase Behavior in the Saturated
Diacylphosphatidylcholine/Cholesterol Binary Monolayer System . . . . 94
References 102
Abstract
The lipid packing structures in biomembranes are thought to be closely related to their biological functions. Cholesterol is widely distributed in biomembranes and suggested to control the biomembrane physical properties through the modification of the lipid molecular packing structures, and to play a key role in the functional microdomain called “lipid raft.”
When cholesterol is added to phospholipid bilayers in the liquid-disordered (Ld)
phase, the liquid-ordered (Lo) phase, which is closely related to the lipid raft structure, is
known to be formed. In order to reveal the mechanism of the Lophase formation and the
molecular interactions between phospholipids and cholesterol, we thoroughly examined the dependence of the physical properties of saturated diacylphosphatidylcholine (diacyl PC)/cholesterol binary bilayers and monolayers on the cholesterol concentration by increasing data points.
The specific volumes of dimyristoylphosphatidylcholine (DMPC), dipalmitoylphosp-hatidylcholine (DPPC) or distearoylphospdipalmitoylphosp-hatidylcholine (DSPC)/cholesterol binary bilayers were measured by the buoyant density method with H2O/D2O mixed solvents
with higher accuracy and more cholesterol concentrations than in previous works. As a result, we succeeded in clearly identifying several phase regions. Moreover, detailed analyses of the obtained results according to the standard method gave reliable partial molecular volumes of diacyl PCs and cholesterol in the Lo phase. The obtained partial
molecular volumes of DPPC and DSPC in the Lo phase were located just in the middle
between those in the Ld and gel (Lβ0) phases whereas the partial molecular volume of
DMPC in the Lophase seemed to be close to that in the Ld phase. These results suggest
that there may be no specific degree of trans-gauche isomerization in the hydrocarbon chain that stabilizes the Lo phase. On the other hand, each of the partial molecular
volumes of cholesterol in the Ld, Lo and Lβ0 phases was almost constant irrespective
the area elastic modulus Cs−1 and the excess Gibbs free energy of mixing ∆Gex at a
given surface pressure were calculated as a function of xchol. As a result, data reliable
enough for the analysis of detailed phase behavior were obtained. We identified several characteristic phase regions and assigned the phase state in each region on the basis of the deviation of the A(xchol) and Cs−1(xchol) from the ideal additivity. We also estimated the
partial molecular areas of diacyl PC and cholesterol in the single-phase regions, where Cs−1(xchol) values are on an ideal additivity curve. Finally, in order to explain the A(xchol)
and Cs−1(xchol) profiles semiquantitatively, we introduced “vicinity lipids” surrounding
sparsely distributed cholesterol molecules in the low xcholregion and proposed a simple
model involving the vicinity lipids, which is fundamentally consistent with the phase behavior of the binary monolayer system.
Abbreviations
A average molecular area ¯
A simulated average molecular area Achol molecular area of cholesterol
ACCchol partial molecular area of cholesterol in the CC phase ALCchol partial molecular area of cholesterol in the LC phase ALC*chol partial molecular area of cholesterol in the LC* phase ALEchol partial molecular area of cholesterol in the LE phase
Apurechol partial molecular area of cholesterol in the pure cholesterol monolayer ADPPC molecular area of DPPC
ACCDPPC partial molecular area of DPPC in the CC phase ACCDPPC(π) the value of ACCDPPCas function of surface pressure ALCDPPC partial molecular area of DPPC in the LC phase ALC*DPPC partial molecular area of DPPC in the LC* phase Ai ideal average molecular area
ALipid partial molecular area of diacyl PC
ACCLipid partial molecular area of diacyl PC in the CC phase ALCLipid partial molecular area of diacyl PC in the LC phase ALELipid partial molecular area of diacyl PC in the LE phase A0 extrapolated molecular area to π= 0 mN/m
A0chol extrapolated molecular area to π= 0 mN/m in the cholesterol monolayer A0i ideal extrapolated molecular area to π = 0 mN/m
A0Lipid extrapolated molecular area to π= 0 mN/m in the diacyl PC monolayer ∆Aex area deviation from ideal additivity
Aαk surface area of diacyl PC in the αk state (k = 1,2,3)
Aβk surface area of cholesterol in the βk state (k = 1,2,3)
Csc area compressibility modulus of cholesterol CsL area compressibility modulus of diacyl PC Cs−1 area elasticity modulus
Cαk area compressibility modulus of diacyl PC in the αk state (k = 1,2,3)
Cβk area compressibility modulus of cholesterol in the βk state (k = 1,2,3)
diacyl PC diacylphosphatidylcholine
DMPC 1,2-dimyristoyl-sn-glycero-3-phosphocholine dimyristoylphosphatidylcholine
DPPC 1,2-dipalmitoyl-sn-glycero-3-phosphocholine dipalmitoylphosphatidylcholine
DSC differential scanning calorimetry
DSPC 1,2-distearoyl-sn-glycero-3-phosphocholine distearoylphosphatidylcholine
D2O deuterium oxide
GPI glycosylphosphatidylinositol ∆Gex excess Gibbs free energy of mixing
h heterogeneity parameter I fluorescence decay curve I RF impulse response function LC liquid-condensed phase
LC* liquid-condensed phase (vicinity lipids only) Lc’ subgel phase Ld liquid-disordered phase LE liquid-expanded phase Lo liquid-ordered phase Lα liquid-crystalline phase Lβ0 gel phase
Mchol molecular weight of cholesterol
n number of hydrated waters per diacyl PC molecule MLV multi-lamellar vesicle
NMR nuclear magnetic resonance PC phosphatidylcholine
PE phosphatidylethanolamine PG phosphatidylglycerol PI phosphatidylinositol PS phosphatidylserine
Pαk existence probability of the αk state (k = 1,2,3)
Pβk existence probability of the βk state (k = 1,2,3)
Pβ0 ripple phase
S solid phase T temprature
Tm chain-melting (main) transition temperature of diacyl PC
¯v specific volume ¯
V average volume per molecule
Vb average volume of the bilayer membrane
Vchol molecular volume of cholesterol
VcholL β0 partial molecular volume of cholesterol in the Lβ0 phase
VcholLd partial molecular volume of cholesterol in the Ldphase
VcholLo partial molecular volume of cholesterol in the Lophase
vD volume of deuterium oxide (D2O)
VDPPC molecular volume of DPPC
VL β
0
DMPC partial molecular volume of DMPC in the Lβ0 phase
VDMPCLd partial molecular volume of DMPC in the Ldphase
VDMPCLo partial molecular volume of DMPC in the Lophase
vH volume of H2O
VLipid molecular volume of diacyl PC
VLipidLd partial molecular volume of diacyl PC in the Ldphase
VLipidLo partial molecular volume of diacyl PC in the Lophase
Vv interaction volume
Vw volume of a hydrated water molecule
∆V interaction volume (interstitial void volume) ∆VLipid the difference between VLipidLd and VLipidLo
xchol mole fraction of cholesterol
α1 the state in the monolayer of pure diacyl PC (the LC phase)
α2 the state of the vicinity lipid surrounding a sparsely distributed
cholesterol molecule in the LC phase α3 the state of diacyl PC in the CC phase
β1 the state in the monolayer of pure cholesterol
β2 the state of cholesterol in the CC phase
β3 the state of isolated cholesterol in the LC phase
π surface pressure
ρD density of deuterium oxide (D2O)
ρH density of H2O
∆ρb difference of the bilayer membrane density from the solvent density
∆ρw difference of the hydrated water density from the solvent density
1
Introduction
1.1
Biomembrane – Composition and Function
Biomembrane, which is composed of many kinds of phospholipids, membrane proteins and cholesterol, is one of absolutely indispensable components in living cells because it has some crucial roles; enclosure of cell contents, transportation of chemical substances between the inside and outside of a cell and mediation of intercellular signaling [1–5].
Amphiphilic phospholipids form a bilayer structure (3∼5 nm thickness) spontaneously in an aqueous solution [2, 3, 5–8]. In order to stabilize the bilayer structure energetically, their hydrophilic head groups face the aqueous environment and the hydrophobic tail groups (the hydrocarbon chains) face the interior of the bilayer according to so-called hydrophobic interaction [2, 3, 5, 6, 8].
The fluid mosaic membrane model, which was proposed by Singer and Nicolson in 1972 [9], has been generally accepted as a basic model for biomembrane structure (Fig. 1.1). The main characteristic of the model is that the lipid bilayer, a basic structure of the biomembrane, is in a two-dimensional liquid-like state and the molecules in the biomembrane move around laterally. Hence, the biomembrane had been thought to have a homogeneous structure.
Since the concept of lipid raft microdomains was introduced by Simons and Ikonen in 1997 [10] based on the existence of the detergent-resistant membrane fraction, the inhomogeneity of the lipid bilayer has been widely recognized [11–16]. However, the detailed structure and formation mechanism of the lipid raft are still in debate.
1.2
Structure and Properties of Phospholipid and Cholesterol
1.2.1 Phospholipid
Phospholipids are major components of biomembranes (Section 1.1). They are categorized into glycerophospholipids and sphingophospholipids according to the difference in the backbone moiety (glycerol or sphingosine). Moreover, there are various kinds of phospholipids according to the combination of hydrophilic head groups and hydrophobic hydrocarbon chains (Fig. 1.2). Most phospholipids are glycerol-based phospholipids having two esterified fatty acids and a hydrophilic head group such as phosphatidylcholine (PC), phosphatidylethanolamine (PE), phospatidylglycerol (PG), phosphatidylinositol (PI) and phosphatidylserine (PS) [2, 5–8]. The esterified fatty acid consists of an acyl chain with an even number of carbon atoms in the biological system. The properties of phospholipid depend not only on the hydrocarbon chain length but also on the unsaturation degree of the acyl chain [17–28]. Phospholipids with acyl chains of 14–18 carbon atoms and 0–2 double bonds have been commonly used in the study of bilayer properties [29–48].
Sphingophospholipids, i.e., sphingosine-based phospholipids, have a fatty acid amide-bound to the sphingosine and are known to be distributed in the outer leaflet of the plasma membrane [26, 49–58]. The amide-bound fatty acids are usually long in the biological system.
1.2.2 Cholesterol
Cholesterol is widely distributed in eukaryotic cell membranes and works as a modulator of their physicochemical properties [2, 5, 8], It is a kind of steroid, which is a general term for chemical compounds with three six-membered rings and a five-membered ring, having a hydroxyl group on one ring (Fig. 2.1). Although cholesterol does not form the bilayer structure by themselves, it is intercalated between phospholipids so as to tighten or loosen their packing depending on the phase state of the membrane [2, 5, 59–68].
1.3
Phase Behavior in the Phospholipid Bilayer and Monolayer
System
1.3.1 Phospholipid Bilayer
Phospholipids and phospholipid/cholesterol mixtures spontaneously form a bilayer structure, which is the most basic structure in vivo and in vitro and has been used extensively [2, 3, 5–9, 13, 16].
The phase transition in phospholipid and phospholipid/cholesterol binary bilayers, which can be induced by changing the experimental conditions such as temperature, pressure [69–74], pH [75–81] and cholesterol concentration, has attracted attention as one of important physical properties, and has been analyzed by using various methods.
Differential scanning calorimetry (DSC) measurement is widely known as an effective method for obtaining the thermodynamic properties of the phase transitions in phospholipid bilayers such as phase transition temperature and enthalpy [7, 8, 82–95]. The observed phases in the dipalmitoylphosphatidylcholine (DPPC) bilayer are the subgel (Lc’), gel (Lβ0), ripple (Pβ0) and liquid-crystalline (Lα) phases, and the transitions between
these phases are called the subtransition (Lc’/Lβ0), the pretransition (Lβ0/Pβ0) and the
chain-melting (main) transition (Pβ0/Lα) (Fig. 1.3) [7, 8, 82–84, 86, 89, 90, 92, 96–99].
The phase transition temperature is a characteristic value and depends on the kinds of the ester-linked fatty acids. In general, the main transition temperature tends to be higher, when the phospholipid has longer acyl chains, and greatly lower if the acyl chain has double bonds between the carbon atoms. The physical characteristics of each phase are as follows.
Subgel (Lc’) phase
This phase is formed by keeping the sample at lower temperature (∼0°C) for days or weeks [96, 97, 99–101]. In the Lc’phase, saturated phospholipid molecules arrange more
the formation of the Lc’phase [103].
Gel (Lβ0) phase
The hydrocarbon chains of saturated phospholipids are predominantly in the all-trans conformation and tilt with respect to the bilayer normal. In the DPPC bilayers the tilt angle is about 30° with respect to the bilayer normal [6–8, 38, 104–114].
It has been reported that the head group arrangement is disordered and the hydrocarbon chains are packed less tightly and less orderly than those in the Lc’ phase
[98, 99, 115, 116]. Moreover, addition of cholesterol into the saturated phospholipid bilayers decreases their hydration [117–119].
Ripple (Pβ0) phase
The Pβ0 phase appears at the temperature between pretransition and chain-melting
transition in the bilayers of saturated phospholipids with large head groups. It has a unique periodically undulated surface structure (the wavelength is ∼15 nm) and has been studied by various methods; DSC [7, 8, 82–92, 94, 95], x-ray diffraction [120–129], and freeze-fracture electron microscopy [97, 126, 130–134]. It has been also reported that the ripple repeat distance increases and the pretransition temperature decreases when cholesterol is added [130, 135–139].
Liquid-crystalline (Lα) phase
The Lα phase is formed above the chain-melting transition temperature Tm when
the lamellar structure is maintained [6–8, 14, 36, 38, 46, 47, 140–145]. Recently, the Lα
phase is also called the liquid-disordered (Ld) phase in reference to “raft domain” or “the
liquid-ordered (Lo) phase.” (see Section 1.4)
In the Lα phase, phospholipid molecules move fast, trans-gauche isomerization in
the hydrocarbon chains occurs rapidly, the hydration level is higher, the surface area per molecule is larger and the bilayer thickness is smaller than in the above phases [6–8, 36, 38,116,140,142–145]. Biomembranes are thought to be mostly in this phase to keep their fluidity optimal for the activity of membrane proteins.
1.3.2 Phospholipid Monolayer
A monolayer is formed when amphiphilic molecules, including phospholipids and cholesterol, are spread over aqueous subphase. The hydrophilic head groups are located in the aqueous side and the hydrophobic tail groups are exposed to the air (Fig. 1.4) [146]. The monolayers formed at the air – water interface have been used as a biomembrane model to examine the lateral organization, packing and the intermolecular interaction between molecules by various techniques, such as surface pressure – area (π − A) isotherm [39, 57, 81, 147–160], Brewster angle microscopy [48, 152, 154, 161–169], fluorescence microscopy [148, 170–176], and computer simulation [155, 156, 156, 177–180].
Fig. 1.5 shows a surface pressure – area (π − A) isotherm of a pure DPPC monolayer. The surface pressure increases with decreasing the molecular area. The π − A isotherm indicates that the monolayer assumes at least four phases (states); liquid-expanded (LE), liquid-condensed (LC), solid (S), and collapsed states [146, 156, 165, 168, 181].
1.4
Lipid Rafts Hypothesis and Liquid-ordered (L
o) Phase
Recently, much attention from various fields has been paid to a functional microdomain in a biomembrane called “lipid raft” because it has a major biological role as a relay station for signal transduction, membrane trafficking, and protein sorting in biomembranes [10, 182–195]. The presence of lipid rafts makes an important modification to the concept of homogeneous fluid mosaic membrane model. It is known that a particular group of molecules including sphinogomyelin, cholesterol, glycosylphosphatidylinositol (GPI) - anchored protein is segregated from the surrounding fluid matrix to make lipid rafts (Fig. 1.6) [10, 182–195]. However, the detailed structure and function of the lipid rafts are still under debate.
The sphingomyelin/cholesterol mixed membranes are often used as a model for lipid rafts. Cholesterol is suggested to interact attractively with sphingomyelin to make relatively rigid lipid rafts [183, 189, 196–205]. Addition of cholesterol molecules into
cholesterol also favor the ordered membrane formation [194, 204, 206–209].
In these artificial phospholipid bilayer systems, the addition of cholesterol induces formation of the Lo phase, which is thought to represent the physicochemical state of
the lipid rafts (Fig. 1.7) [12, 160, 189, 200, 204, 208, 210–218]. It has been reported that the Lo phase has intermediate properties between the Ld phase and the Lβ0 phase
[12, 189, 208, 219, 220]. Some experimental methods have shown that the hydrocarbon chain packing in the Lophase is tighter than those in the Ldphase [12, 160, 189, 200, 204,
208, 210–213, 215–220]. However, the detailed mechanism of the cholesterol-induced Lo
phase formation in the molecular level is still unclear.
1.5
Previous Research in the Phospholipid
/Cholesterol Membrane
System
The effect of cholesterol on biomembrane physicochemical properties has been intensively studied using various experimental methods such as DSC [83, 84, 87, 89–92, 95, 176, 221, 222], x-ray diffraction [120, 128, 129, 176, 214, 223–229], nuclear magnetic resonance (NMR) [95, 176, 196, 221, 222, 225, 230–237], fluorescence spectroscopy [173–176, 196, 237, 238], and computer simulation [65, 178, 179, 239–248]. Since the recognition of the existence of lipid rafts, lipid researchers have focused on clarifying the role of cholesterol in the raft domain formation using binary or ternary systems. In some studies cholesterol-analogues (stigmasterol, ergosterol, 7-ketocholesterol, and so on) were substituted for cholesterol to evaluate the influence of the sterol structure [37, 93, 157, 241, 243, 249–257].
In the Lo phase research, bilayers of saturated diacylphosphatidylcholine (diacyl
PC) such as DPPC have been mainly used as a membrane model, and effects of cholesterol on their physicochmical properties have been reported. In particular, phase diagrams of the diacyl PCs/cholesterol binary or ternary system, which give fundamental information on the effect of cholesterol on the properties of the Lo phase, have been
proposed by several researchers. We identified phase boundaries in the binary system by measuring the specific volume at constant temperatures above or below Tm and with
not necessarily consistent with those in previous works [203, 215, 237, 253, 258–261]. The mechanism of the Lo phase formation is still unclear. In the ternary system, phase
diagrams are still incomplete because the concentration combination of phospholipids and cholesterol is much larger than those in the binary system.
1.6
Purpose of This Study
As described in Section 1.5, the physicochemical properties of the Lophase (or lipid
rafts) are still unclear. How does cholesterol induce the Lo phase? In what state is the
hydrocarbon chains of PC in the Lo phase? In order to solve these problems, we tried to
examine the detailed molecular interaction between diacyl PCs and cholesterol by using simple methods with high accuracy and increasing data points.
We re-examined the volumetric behavior of DPPC/cholesterol binary bilayers with more cholesterol concentrations and temperatures than in previous works. Simple volumetric measurements are useful because they are able to give quantitative information on the volume of each molecule in a binary lipid bilayer [262]. In our study, some regions were clearly discernible in the average molecular volume – cholesterol mole fraction xchol
plot, especially at temperatures above Tm of the pure DPPC bilayer. On the basis of these
results, the partial molecular volumes of DPPC and cholesterol in the Lo phase were
estimated with high accuracy and reliability. In addition, we used diacyl PCs with the chain length different from that of DPPC to evaluate the influence of hydrocarbon chain length on the cholesterol-induced Lophase formation.
We checked the molecular mobility in the phases identified above by measuring the fluorescent decay of trans-parinaric acid (tPA) added into the binary bilayer to get further insight into the Lophase formation [262]. As a result, we obtained the characteristic time
scale reflecting the molecular mobility, which was almost constant in the Lo phase we
identified.
and the excess Gibbs free energy of mixing at fixed surface pressures [39, 81, 146, 151, 160, 165, 263]. We found that the several phase regions can be clearly identified from our data and assumption of three states for each of diacyl PC and cholesterol can sufficiently explain the phase behavior of the binary monolayer system we examined.
Cholesterol
Phospholipid Integral protein
Glycoprotein Glycolipid
Figure 1.1: Schematic representation of biomembrane based on the fluid mosaic membrane model [10, 16]. Phospholipids as well as integral, embedded, and peripheral proteins constituting the basic structure of biomembrane called the bilayer can move laterally within the membrane [2, 4, 5]. Cholesterol is involved in the regulation of the membrane fluidity [2, 5, 8].
CH CH2 CH2 OH OH OH P O O O-N+ CH2 CH2 CH3 CH3 CH3 P O O O-N + CH2 CH2 H3 OH P O O O-HO OH OH OH
(A)
Glycerol Glycerophospholipid CH CH2 CH2 O O O C C R O O R1 R2 Phosphatidylcholine (a) (b) (c) Phosphatidylethanolamine Phosphatidylinositol(B)
OH NH2 OH Sphingosine Sphingomyelin O NH H OH H O P O O O N - +Figure 1.2: (A) Parts of a phospholipid molecule. A hydrophilic head group (R) such as (a) phosphatidylcholine, (b) phosphatidylethanolamine, and (c) phosphatidylinositol and two fatty acids (R1and R2) are esterified to glycerol to produce a phospholipid molecule
[2,5–8]. (B) Sphingomyelin is classified as sphingophospholipid, which has a sphingosine backbone [53, 56].
20 30 40 50 Temperature (°C) 10 Endothermic L c L β’ P β’ L α Liquid-crystalline (L α) phase Gel (L ) phaseβ’ Ripple (P ) phaseβ’ Subgel (L c) phase
Figure 1.3: A DSC thermogram of the pure DPPC bilayer showing three phases transition (Lc’ → Lβ0 → Pβ0 → Lα) and schematic illustration of the bilayer stricture in each phase
[7, 8, 82–84, 86, 89, 90, 92, 93, 96–99]. The chain-melting (main) transition temperature is 41.5°C [7, 8].
Liquid-expanded (LE) phase
Liquid-condensed (LC) phase
Figure 1.4: Schematic illustration of the lateral molecular packing in a phospholipid monolayer [146]. In the LE phase, hydrocarbon chains are in the disordered state by rapid trans-gaucheisomerization and the molecular packing is loose (upper). In the LC phase, hydrocarbon chains are in the all-trans state and tilt at an angle of ∼33° with respect to the monolayer normal (lower) [264].
LE LE/LC
LC S Collapse state
Figure 1.5: A surface pressure – area (π − A) isotherm of the pure DPPC monolayer. The discrete change in the slope of the π − A isotherm represents a phase transition in the monolayer. In the pure DPPC monolayer, four phases are discernible as indicated in the figure; the liquid-expanded (LE) phase, the liquid-condensed (LC) phase, the solid (S) phase and the collapse state [146, 156, 165, 168, 181].
Raft Domain Raft Domain Glycerophospholipid Sphingogmyelin GPI-anchored protein Sphingoglycolipid Cholesterol
Figure 1.6: Schematic illustration of the raft domain [10, 185, 187, 192, 194]. This domain is a complex consisting of a specific molecule group containing sphingomyelin, cholesterol, glycosylphosphatidylinositol (GPI)-anchored protein and so on.
Addition of cholesterol
Liquid - ordered (Lo) phase
Liquid - disordered (Ld) phase
Figure 1.7: The cholesterol-induced Lo phase formation [194, 208, 213–215].
Cholesterol-rich domain forms when cholesterol is added to the Ld phase, which is
2
Materials and Methods
2.1
Materials
1,2-dimyristoyl-sn-glycero-3-phosphocholine (DMPC), 1,2-dipalmitoyl-sn-glycero-3 -phosphocholine (DPPC), 1,2-distearoyl-sn-glycero-3-phosphocholine (DSPC) and cholesterol were purchased from Avanti Polar Lipids (Alabaster, AL) and used without further purification. These diacylphosphatidylcholines (diacyl PCs) are suturated, and have a phosphocholine as a hydrophilic head, but differ in the hydrocarbon chain length; the number of carbon atoms in the acyl chain is 14 (DMPC), 16 (DPPC) and 18 (DSPC). The polyene fatty acid, trans-parinaric acid (tPA), was obtained from Cayman Chemical (Ann Arbor, MI) and used as the fluorescence probe in fluorescence spectroscopic measurements.
Deuterium oxide (D2O) used for the buoyant density measurements was obtained from
Cambridge Isotope Laboratories (Andover, MA), and stored in an ampule under room temperature away from moisture.
Stock solutions of diacyl PCs and cholesterol were prepared with chloroform/methanol (4:1, v/v) in buoyant density and surface pressure – area (π − A) isotherm measurements. In fluorescent decay measurements, stock solutions were prepared by dissolving diacyl PCs in methanol and cholesterol and tPA in hexane/2-propanol (3:2, v/v). They were stored at – 20°C until use.
2.2
Buoyant Density Measurement
2.2.1 Neutral Flotation Method
The specific volume of the diacyl PC/cholesterol binary bilayer ¯v was determined according to the neutral flotation method described by Nagle and Wilkinson [265] and Wiener et al. [266]. Briefly, diacyl PC and cholesterol were separately dissolved in chloroform/methanol (4:1, v/v) and mixed at an appropriate mole ratio. The obtained solution was dried under nitrogen flow and in vacuum, and the resulting lipid film was dissolved into an H2O/D2O mixed solvent, the density of which was adjusted to be as near
as possible to that of the bilayer. The density of diacyl PC/cholesterol binary bilayers ρ was estimated from the density of a bulk solution at neutral buoyancy as follows:
ρ = vH× ρH+ vD× ρD
vH+ vD
, (2.1)
where ρH, ρD, vH, and vD are the densities and volumes of H2O and D2O, respectively
(Table. 2.1). The ¯v(xchol) values are calculated as the reciprocal of ρ(xchol), where xchol
is the cholesterol mole fraction.
After centrifugation (19,800g × 10 – 20 min) in a temperature-controlled centrifuge (Kubota, Model5922), an aliquot of an H2O/D2O mixed solvent with either higher or
lower density than that of the solvent in the centrifugation tube was added according to whether the bilayers sedimented or floated (Fig. 2.2). This procedure was repeated until the change in density by the addition of the solvent became less than 5 × 10⁻⁴ g/cm3. As the bilayers were distributed as a fairly narrow band after the final centrifugation, the density difference between vesicles must be smaller than 5 × 10⁻⁴g/cm3. We repeated the measurement at least three times by using the data obtained in the last measurement as an initial density in the next measurement to eliminate the error caused by the difference in solvent density between inside and outside of the multi-lamellar vesicle (MLV) (Fig. 2.3).
temperature was within the desired temperature ±0.5°C.
Table 2.1: The density of H2O and D2O under the atmospheric pressure [267]
T (°C) ρH(g/cm3) ρD (g/cm3) 15 0.9991 1.1060 25 0.9970 1.1037 30 0.9957 1.1022 35 0.9940 1.1004 40 0.9922 1.0984 45 0.9902 1.0962 50 0.9880 1.0937 55 0.9857 1.0912 60 0.9832 1.0884
2.2.2 Partial Molecular Volume Analysis
Fig. 2.4 shows how to estimate the partial molecular volume of each molecule in the binary system. The procedure of the analysis is based on that described by Greenwood et al. [268]. We calculated the average volume per molecule ¯Vas function of xcholfrom the
obtained ¯v(xchol) value by:
¯
V(xchol)=
¯v(xchol)
NA
(
(1 − xchol) MLipid+ xcholMchol) , (2.2)
where NA, MLipid, and Mcholare the Avogadro number, the molecular weight of diacyl PC
and the molecular weight of cholesterol, respectively (Fig. 2.4B). In order to make the deviation from linearity clearly visible, we subtracted the value of a straight line from that of ¯V(xchol):
¯
V∗(xchol)= ¯V(xchol) − C xchol, (2.3)
where C is the gradient of the straight line fitted to the data at lower xchol region (Fig.
2.4C). Assuming that the partial molecular volumes of diacyl PC VLipid and cholesterol
Vcholare constant in a phase, ¯V∗(xchol) gives a straight line as
¯
V∗(xchol) = (1 − xchol)VLipid+ xcholVchol− C xchol
= −(VLipid− Vchol+ C)xchol+ VLipid. (2.4)
Therefore, the partial molecular volumes can be estimated as
VLipid = ¯V∗(0) (2.5)
and
2.3
Fluorescence Decay Measurement
2.3.1 Sample Preparation
DPPC in methanol was mixed with cholesterol in hexane/2-propanol (3:2, v/v) at an appropriate mole ratio. The fluorescence probe tPA in methanol was added at the DPPC/tPA mole ratio of 200:1 [269,270]. The obtained solution was dried under nitrogen flow and in vacuum, and the resulting DPPC film was dissolved into Milli-Q water (Milipore Co., Milford, MA). The final concentration of DPPC was 200 µM.
2.3.2 Fluorescence Decay of trans-parinaric acid
The fluorescence experiments were performed with a FluoTime 200 spectrometer (PicoQuant, Berlin, Germany). The excitation and emission wavelengths were 298 nm and 405 nm, respectively, and the temperature was adjusted to be 45°C.
The fluorescence decay curve I(t) of tPA was analyzed by using a stretched exponential function derived based on a continuous distribution of lifetimes [271–273] as follows: I(t) = Z t −∞ I RF(t) n X i=1 Aiexp − t − t 0 τi !1/hi dt0, (2.7)
where I RF (t) and τi are the impulse response function and the characteristic time scale
of the decay, respectively. When the heterogeneity parameter hi is 1, the each decay is a
2.4
Langmuir Monolayer Study
2.4.1 Surface Pressure – Area (π − A) Isotherm Measurement
The π − A isotherms of diacyl PC/cholesterol binary monolayers were measured using a computer-controlled Langmuir-type film balance (USI system, Fukuoka, Japan) with more cholesterol concentrations than in previous works. Before measurement, the trough (100 × 290 mm2) was carefully cleaned several times with ethanol and Milli-Q water, and filled with Milli-Q water as the aqueous subpahse. A 30 µL of the diacyl PC solution (1mg/mL) was spread over the subphase between barriers. After the solvent was evaporated for about 10 min, the monolayer was compressed at a rate of 0.1 mm/s. The subphase temperature was kept at 25.0 ± 0.1°C.
The surface tension was measured by the Wilhelmy plate method [146, 274] with a filter paper (1 × 1 cm2) and the surface pressure π was calculated as
π = γ0−γ, (2.8)
where γ0is the surface tension of aqueous subphase and γ is the surface tension of the
monolayer (Fig. 2.5). In order to obtain experimental data with high accuracy and make the error of the average molecular area at 30 mN/m less than 0.01 nm2, the measurements under the same conditions were repeated many times. Therefore, it took 7 – 10 days to finish the series of measurements for one binary monolayer system (the number of measurements was of the order of 100). Moreover, to reduce pipetting error, more than 100 µL of diacyl PC stock solution and more than 10 µL of cholesterol stock solution were mixed to prepare a sample solution. It was confirmed that there was little difference between the results in the first and final days.
2.4.2 Analysis ofπ − A Isotherms
The average molecular area A, the area elastic modulus Cs−1and the excess Gibbs free energy of binary mixtures ∆Gex at a fixed surface pressure were calculated as a function
of xchol from a series of π − A isotherms according to the standard analysis procedure
[39, 81, 146, 151, 160, 165, 263].
The ideal average molecular area Ai(xchol) was calculated by:
Ai(xchol) = (1 − xchol) ALipid+ xcholAchol, (2.9)
where ALipid and Achol are the molecular areas in the pure diacyl PC and cholesterol
monolayer, respectively. The area compressibility modulus Cs(xchol) was calculated by:
Cs(xchol)= − 1 A0 dA dπ ! , (2.10)
where A0 is the extrapolated molecular area to π = 0 mN/m, which is calculated from tangent line at relevant surface pressure (Fig. 2.6). The ideal compressibility modulus Csi(xchol) was calculated by:
Csi(xchol) = −
1 Ai0(xchol)
(
(1 − xchol)CsLALipid+ xcholCscAchol) , (2.11)
where CsL and Cscare the compressibility modulus of the pure diacyl PC and cholesterol monolayer, respectively, and A0i(xchol) is calculated by:
A0i(xchol) = (1 − xchol) A0Lipid+ xcholA0chol, (2.12)
where A0Lipid and A0chol are the extrapolated molecular areas to π = 0 mN/m in the pure diacyl PC and cholesterol monolayer, respectively. The area elastic modulus Cs−1 was calculated as the inverse of the Csvalues.
The partial molecular areas of diacyl PC and cholesterol in a single phase were estimated according to the method described by Edholm et al. [178]. Briefly, the average molecular area A was plotted as a function of xchol and the obtained A(xchol) in a single
constant, was fitted to a straight line (Eq. 2.9). The value of Ai(0) corresponds to the
partial molecular area of diacyl PC in the single phase and the value of Ai(1) to that of
cholesterol.
Further, the excess Gibbs free energy of binary mixtures ∆Gex(xchol) at a fixed surface
pressure π0was calculated by:
∆Gex(xchol, π0) =
Z π0
0
f
A(π) − ((1 − xchol) ALipid(π)+ xcholAchol(π)
) g
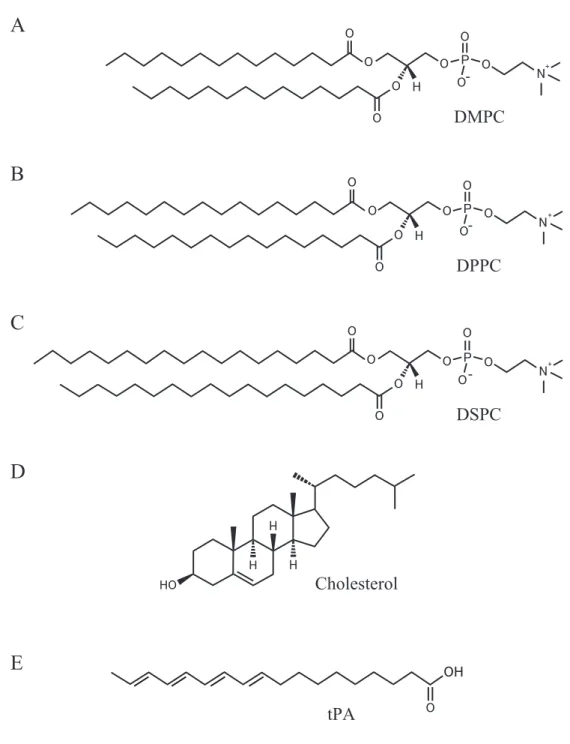
O O O O H O P O O O - N+ O O O O H O P O O O - N+ O O O O H O P O O O - N+ DMPC DPPC DSPC
A
B
C
D
HO H H H CholesterolE
OH O tPAFigure 2.1: Chemical structures of (A) DMPC, (B) DPPC, (C) DSPC, (D) cholesterol and (F) tPA. DMPC, DPPC and DSPC are categorized as glycerophospholipid, which consists of a phosphocholine, a glycerol and esterified fatty acids [2, 5–8]. Cholesterol is a kind of steroid, and has three six-membered rings and a five-membered ring. It exhibits amphipathic properties because of a hydroxyl group on the ring. The fluorescence probe tPA (all-trans-9, 11, 13, 15-octadecatetraenoic acid) has four double bonds in the hydrocarbon chain [275, 276].
H2O D2O centrifugation 19,800×g for 10 min or
ρ
1ρ
1< ρ
ρ
ρ
2ρ
< ρ
2ρ
1< ρ
< ρ
2Figure 2.2: Process for the determination of the bilayer density. After centrifugation, H2O or D2O was added according to whether the bilayers sedimented or floated. This
procedure was repeated until the change in density by addition of extra H2O or D2O
Sample Multi-lamellar vesicle
H2O/D2O mixed solvent
Figure 2.3: Problem in the measurement of the buoyant density of a multi-lamellar vesicle (MLV). It may take a fairly long time to cancel the concentration gradient between inside and outside of MLV because it consists of many diacylphosphatidylcholine (diacyl PC) layers [277, 278].
A
I
II
III
B
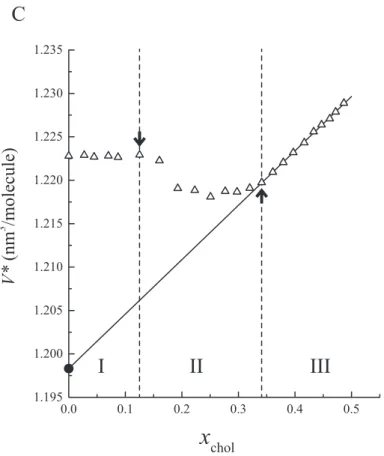
C
I
II
III
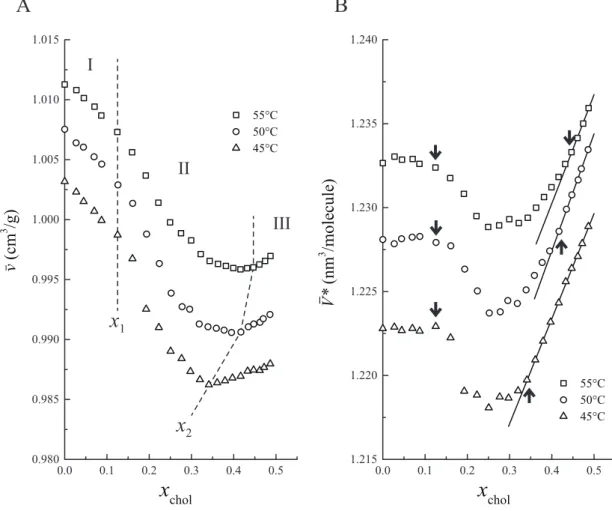
Figure 2.4: Estimation of partial molecular volumes in binary bilayers. (A) Dependence of the specific volume of DPPC/cholesterol binary bilayers ¯v on cholesterol mole fraction xchol. Temperature was kept at 45±0.5°C. Breakpoints corresponding to the boundaries
between the regions I, II and III are indicated by arrows. (B) The average specific volume per molecule ¯V(xchol) and (C) ¯V∗(xchol) = ¯V(xchol) − C xcholwere calculated, where C is
the gradient of the ¯V(xchol) in the low xcholregion (indicated by a straight line in (B)), so as
to make the deviation from linearity clear. The partial molecular volume of DPPC in the region III was estimated by fitting the ¯V∗(xchol) data to a straight line and extrapolating
Wilhelmy-type surface tension sensor
Barrier
Trough
A0
Figure 2.6: Schematic illustration showing how to determine the extrapolated molecular area A0to π = 0 mN/m. The A0value was calculated from the x-intercept of the tangent line of the π − A isotherm at an appropriate surface pressure (here at 30 mN/m).
3
Results
3.1
Detailed
Volumetric
Behaviors
of
the
Saturated
Diacylphosphatidylcholine
/Cholesterol Binary Bilayer System
3.1.1 DPPC/Cholesterol Binary Bilayer System Detailed Volumetric Behavior
In order to examine the molecular interaction in DPPC/cholesterol binary bilayers, we scrutinized the dependence of their specific volumes ¯v on cholesterol mole fraction xchol
at constant temperature by the neutral flotation method [160, 262, 268] (Figs. 3.1A and 3.2A). The ¯v(xchol) values of DPPC/cholesterol binary bilayers were measured carefully
with more cholesterol concentrations than in previous studies to quantitatively analyze the molecular volume behavior, and the average molecular volumes deviating from an appropriate straight line ¯V∗(xchol) were calculated as described in Section 2.2.2 (Figs.
3.1B and 3.2B). Although in principle, we had better use the molecular volume V (xchol)
for the analysis of the phase behavior rather than the obtained ¯v(xchol) profiles, the latter
can be helpful especially in the assignment of the phase boundary. Consequently, we divided the ¯v(xchol) profiles into three regions based on the breakpoints and the linearity.
At temperatures above the chain-melting transition temperature of pure DPPC bilayers (Tm = 41.5°C [7, 8]), regions I (xchol < x1) and III (xchol > x2) are the regions where
¯
V∗(xchol) showed linearity at the lower and higher xcholends, respectively (Fig. 3.1) and
region II is in-between (x1 < xchol < x2). Regions I and III correspond to the Ld phase
and the Lophase, respectively [203, 215, 237, 258].
The volumetric behaviors shared the fundamental characteristics, irrespective of the temperature:
4. The x1value was about 0.12, depending little on temperature.
5. The x2value was shifted toward higher xcholwith increasing temperature.
The volumetric behaviors in the region II were more complicated than expected, and cannot be explained simply by coexistence of the Ldand Lodomains.
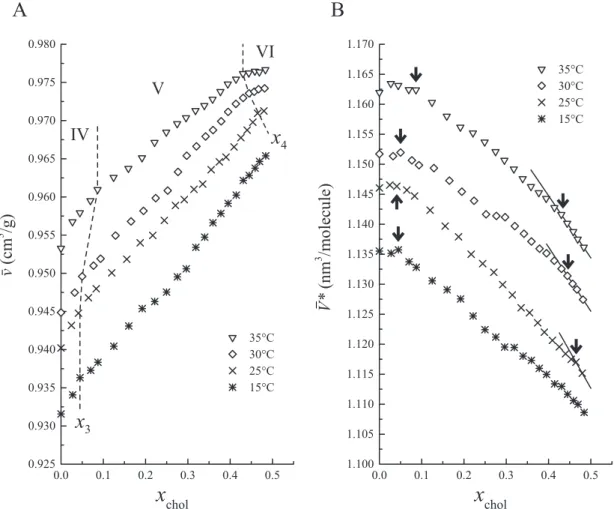
Below Tm, we selected the temperatures below the pretransition temperature of pure
DPPC bilayers (∼35°C [6–8, 89, 93]) for the measurement of ¯v(xchol) as the volumetric
behavior was expected to be somewhat complicated near Tm because of the existence of
the Pβ0 phase. The volumetric behaviors at the temperatures below Tm in Fig. 3.2 are
summarized as follows:
1. The ¯v(xchol) values increased with increasing xchol.
2. There appeared to be linear regions in the ¯v(xchol) profiles at the lower and higher
xcholends in the temperature range of 25 – 35°C.
3. Except for 35°C, the x3value, which is the breakpoint at lower xchol, was almost
constant.
4. The x4value, which is the breakpoint at higher xchol, was shifted toward lower xchol
with increasing temperature.
Based on the behaviors described above, the ¯v(xchol) profiles can be divided into three
regions IV, V and VI as previously described using different methods [198, 203, 215, 247], although it was difficult to accurately determine the boundary because of the small variation in the gradient at the breakpoints x3and x4. The regions IV and VI correspond to
the Lβ0 phase and the Lophase, respectively. The x3value was estimated to be about 0.05
below 30°C and about 0.1 at 35°C. In the region IV at 35°C, the linearity of ¯v(xchol) was
somewhat ambiguous and its gradient seemed to change gradually probably because the temperature is near the pretransition temperature and the Pβ0 phase may coexist with the
Lβ0 phase. The x4value seemed to shift gradually toward higher xcholas the temperature
decreased, although the number of data points belonging to the region VI at 25°C was too few to be unequivocally conclusive.
A rough phase diagram for the DPPC/cholesterol binary bilayer system was constructed by reference to the results described above (Fig. 3.3). The obtained phase diagram shares basic features with those previously summarized by Marsh [215]. However, the positions of phase boundaries differ greatly from diagram to diagram [198, 203, 215, 247] and are mutually inconsistent. In our phase diagram (Fig. 3.3), the phase boundary at x4 is evidently located at a higher value of xchol than in other phase
diagrams.
Estimation of Partial Molecular Volumes
The partial molecular volumes of DPPC VDPPCand cholesterol Vchol in the regions I,
IV, III and VI were estimated in Fig. 3.4 as described in Section 2.2.2.
The VDPPC values were almost linearly dependent on temperature with roughly the
same gradient, irrespective of the phase, and continuous between the regions III and VI, which is consistent with the continuity of these regions as a single Lophase. The partial
molecular volume in the Lo phase VDPPCLo lay just in the middle between those in the Ld
phase VDPPCLd and the Lβ0 phase VL β 0
DPPC. It should be mentioned that the change of VDPPCin
the cholesterol-induced Ldto Lophase transition was only about 3%.
In contrast to the VDPPC values, the Vchol values were larger in the order of VL β
0
chol >
VcholLo > VcholLd, and VcholLo lay nearer to VcholLd than to VcholL β0. Moreover, the change of Vchol
3.1.2 Diacylphosphatidylcholine Chain Length Dependence of Volumetric Behaviors
Detailed Volumetric Behavior
We employed DMPC and DSPC instead of DPPC to get insight into the influence of hydrocarbon chain length on the cholesterol-induced Lo phase formation. At every
temperature examined, linear regions were discernible at the lower and higher xcholends
(Fig.3.5). Therefore, the ¯v(xchol) profiles were divided into three regions for convenience
as in the DPPC/cholesterol binary bilayer system. Above Tm, regions I (xchol < x1)
and III (xchol > x2) may correspond to the Ld phase and the Lo phase, respectively,
judging from the linearity of ¯V∗(xchol) in the region I and III (data not shown). The
volumetric behaviors in the region II (x1 < xchol < x2) were as complicated as that in
DPPC/cholesterol binary bilayers.
In DMPC/cholesterol binary bilayers, the detailed volumetric behavior in the region II was examined in the wide range of temperature because of the relatively low Tm of
DMPC bilayers (∼24°C) (Fig. 3.5A) [7, 8]. The ¯v(xchol) values decreased in the region
I and II, and increased in the region III with increasing xchol as in DPPC/cholesterol
binary bilayers. In the region II, the values of ¯v(xchol) located below the straight line
connecting the data points at x1and x2, and the degree of the deviation from the straight
line diminished gradually with increasing temperature. Moreover, the x1 and x2 values
shifted toward higher xcholwith increasing temperature.
The ¯v(xchol) of the DSPC/cholesterol binary bilayer system was measured above and
below Tm of DSPC bilayers (∼54°C) (Fig. 3.5B) [7, 8]. The x1 position seems to shift
toward higher xchol with increasing temperature, though it is not conclusive because the
measurements were carried out at only two temperatures. In contrast to x1, the position
of x2 is confusing because there seem to be two candidates for x2; one at xchol ≈ 0.3
and the other at xchol = 0.4 ∼ 0.45. We assigned the breakpoint at xchol ≈ 0.3 as
x2, considering that in the DMPC/cholesterol and DPPC/cholesterol binary bilayers the
sign of the gradient of ¯v(xchol) is changed from negative to positive at x2 and that the
partial molecular volume of DSPC in the Lophase is expected to increase smoothly as the
is related to the formation of pure cholesterol domains.
Fig. 3.6 shows the phase diagrams of DMPC/cholesterol and DSPC/cholesterol binary bilayers constructed on the basis of the breakpoints in Fig. 3.5.
Estimation of Partial Molecular Volumes
The partial molecular volumes of DMPC and DSPC in the regions I, III, IV and VI were estimated as described in Section 2.2.2 (Fig. 3.7A). The partial molecular volume of diacylphosphatidylcholines (diacyl PCs) VLipid depended almost linearly on temperature
in each region. The thermal expansion coefficient [279] was in the range of 6.4 ∼ 9.8 × 10⁻⁴K−1 for all regions. The partial molecular volume in the Lophase VLipidLo was smaller
than that in the Ldphase VLipidLd and their difference ∆VLipid (= VLipidLd − VLipidLo ) was 2 ∼ 3%.
On the other hand, the values of Vcholin each region showed almost no dependence on
the diacyl PC chain length (VcholL β0 ≈ 0.71 nm3, VcholLo ≈ 0.62 nm3, VcholLd ≈ 0.58 nm3), though they were apt to be more scattered than that of VLipidprobably because of far extrapolation.
The thermal expansion of cholesterol was in the range of 7.1 ∼ 10.3 × 10⁻⁴K−1 for all regions.
The obtained values of VLipid and Vcholare summarized in Tables. 3.1 and 3.2 together
3.2
Fluorescent Decay Analysis
The fluorescence decay of trans-parinaric acid (tPA) added into DPPC/cholesterol binary bilayers was measured with more cholesterol concentrations. Fig. 3.8 shows time-resolved fluorescence intensity decay of tPA in DPPC/cholesterol binary bilayers. The peak top of decay curves decreased and the overall decay was slower with increasing xchol.
The fluorescence decay profile at 45°C was fitted to a stretched exponential function (Eq. 2.7) and the dependence of the fitting parameters on xchol is shown in Fig. 3.9.
Dependence of the characteristic time constant τ and the heterogeneity parameter h on xchol was consistent with the existence of the two phase boundaries suggested in the
volumetric measurements though the positions of boundaries did not agree exactly with those in Fig. 3.1A. Therefore, we can define three regions I, II and III as in the previous sections. In the region I (xchol ≤ 0.1), both the τ and h values increased as xcholincreased,
suggesting that the average motion of tPA molecules slows down due to appearance of slow components. In the region III (xchol ≥ 0.35), the τ values were almost constant with
the value about four times larger than those in the region I and the h values were also almost constant with the value near 1.0 probably because a homogeneous and relatively ordered Lophase was formed. In the region II (0.1 < xchol < 0.35), the τ values increased
sharply, suggesting that the motion of tPA is gradually restricted or the new domain with a larger τ value grows with increasing xchol. Preliminary analysis using two stretched
exponential functions showed that the behavior of τ in the region II can be roughly explained by superposition of two components; one with τ ≈ 4ns and the other with τ ≈ 12 ns (data not shown). However, we had better be careful because the obtained data were scattered considerably and dependent on the initial values for the curve fitting. Moreover, looking closer at Fig. 3.9, there seems to be a breakpoint at xchol ≈ 0.25.
Therefore, the behavior of tPA in the region II could be more complicated than a first glance would suggest.
Conclusion I
The Saturated Diacylphosphatidylcholine/Cholesterol Binary Bilayer System
The cholesterol-induced Lophase formation in the diacylphosphatidylcholine (diacyl
PC)/cholesterol binary bilayer system was examined by measuring the specific volume of the binary bilayer vesicles using density-controlled H2O/D2O mixed solvents. It was
also examined by analyzing the fluorescence decay profile of trans-parinaric acid as a fluorescent probe in DPPC/cholesterol binary bilayers. The repetitive measurements with small xchol intervals and careful experimental procedure made it possible to obtain the
information on the detailed volumetric behaviors, especially at temperatures higher than the chain-melting (main) transition temperature, and to provide reliable basic data for discussion about diacyl PC – cholesterol interaction in the Lo phase. On the basis of
obtained data, we identified the phase boundaries and estimated the partial molecular volumes of diacyl PCs and cholesterol in the Lβ0, Ld, and Lo phases. Moreover, the
partial molecular volumes of diacyl PCs in the Lophase suggested that their hydrocarbon
chain state in the Lophase is intermediate between those of the Lβ0 and Ldphases, and is
3.3
Detailed
Surface
Area
Behavior
of
the
Saturated
Diacylphosphatidylcholine
/Cholesterol
Binary
Monolayer
System
3.3.1 DPPC/Cholesterol Binary Monolayer System Surface Pressure – Area (π − A) Isotherms
The π − A isotherms of DPPC, cholesterol and DPPC/cholesterol binary monolayers were measured with more cholesterol concentrations than in previous studies [57, 81, 148–151, 154, 156–158] to obtain detailed information on the molecular interactions in the monolayer formed on an aqueous subphase (Fig. 3.10). When the surface area was decreased, the surface pressure started to detectably increase at the average molecular area A ≈ 0.95 nm2 and reached a maximum (collapse pressure) of about 60 mN/m at A ≈ 0.38 nm2 in the DPPC monolayer. The corresponding values for the cholesterol monolayer were 0.39 nm2, 45 mN/m and 0.38 nm2, respectively. It is interesting that the molecular areas of DPPC ADPPC and cholesterol Acholare very similar in the tightly
packed monolayers in spite of their definite structural difference.
The π − A isotherm of DPPC monolayers showed clearly two phase transitions; the liquid-expanded (LE) to liquid-condensed (LC) phase and the LC to solid (S) phase transitions. With increasing xchol, the A range where the LE and LC phases coexist
became narrower and the transition surface pressure increased slightly. On the other hand, additon of very low concentration of cholesterol abolished the LC to S phase transition. The overall characteristics in the π − A isotherms of the DPPC/cholesterol binary system are fundamentally consistent with those of previous studies [81, 148–151, 156, 157]
The values of A were plotted as a function of xcholat a fixed surface pressure (π = 5,
10, 15, 20, 25, 30 and 35 mN/m) to analyze the intermolecular interaction and the extent of the cholesterol-induced condensing effect (Fig. 3.11A). The average molecular area in the ideally mixed DPPC/cholesterol binary monolayer Aiwas calculated by Eq. 2.10 for
each surface pressure (the dotted lines in Fig. 3.11). If DPPC and cholesterol molecules are mixed ideally or completely phase-separated, the A(xchol) profiles should be placed on
there must be some interaction between DPPC and cholesterol molecules, which results in deviation from the additivity line. The deviation ∆Aex was negative regardless of xchol,
indicating attractive interaction (condensing effect).
Since the LE to LC phase transition appears at about 12 mN/m in the pure DPPC monolayer, cholesterol molecules were added into the LE phase at 5 and 10 mN/m and into the LC phase at the other analyzed surface pressures. Therefore, the cholesterol-induced condensing effect was 4 – 5 times greater for the LE phase than for the LC phase (Fig. 3.11B). Moreover, the maximum effect was given by less cholesterol molecules for the LC phase than for the LE phase. Roughly speaking, the xcholvalue that
gives the maximum value of the absolute area deviation from ideal additivity corresponds to the monolayer state where the number of DPPC molecules in the most ordered state is largest, assuming that the molecular area of cholesterol changes little. Above this xchol
value the binary monolayer must be in a definable phase irrespective of surface pressure because there seemed to be no barometric transition at xchol > 0.5 (Fig. 3.11A). Here, we
call it “the cholesterol-induced condensed (CC) phase,” as DPPC molecules must be in a highly ordered state judging from the smaller partial molecular area of DPPC molecule than in the LC phase (see Section 4.2.1). When xcholis further increased at high surface
pressure, a breakpoint appears at xchol ≈ 0.6 possibly because of the segregation of pure
cholesterol domains.
Analysis of Area Elastic Modulus and Excess Gibbs Energy
At the lower xcholregion the ∆Aex(xchol) values are complicated and depend on surface
pressure. In order to clarify the phase behavior of the DPPC/cholesterol binary monolayer system, we calculated the area elastic modulus Cs−1 and the excess Gibbs free energy of mixing ∆Gex as a function of xchol in addition to the values of ∆Aex according to the
conventional analytical method (see Section 2.4.2). Fig. 3.12 shows the representative data for these parameters for the low and high surface pressures.
the previous section though there may be another region at the vicinity of xchol = 1.0
where the CC phase and the pure cholesterol domain coexists. Thus, at least three regions were discerned in the Cs−1(xchol) profile. On the other hand, the A(xchol) profile was
rather smooth and the breakpoints in the A(xchol) profile did not seem to be coincide
with the phase boundaries identified in the Cs−1(xchol) profile, suggesting that the phase
behavior in the low xcholmay be more complex than expected from the Cs−1(xchol) profile.
However, we did not further analyze the A(xchol) profile as it was difficult to unequivocally
determine the breakpoint positions.
The Cs−1(xchol) profile at 10 mN/m seems to show another transition at xchol > 0.8 as
the Cs−1(xchol) profile at xchol > 0.6 cannot be fitted with an ideal additivity curve. These
results suggest that the segregation of pure cholesterol domains takes place at xchol > 0.8.
At the high surface pressure (30 mN/m), the Cs−1(xchol) profile shows a clear phase
transition region in the xchol range from 0.18 to 0.25 (Fig. 3.12B(b)). Comparing with
the similar transition at 10 mN/m, the transition at 30 mN/m occurs at smaller xcholand
the transition region is narrower. This sharp transition plausibly represents the LC to CC phase transition. Interestingly, the breakpoints in the A(xchol) profile (arrows in Fig.
3.12B(a)) does not coincide exactly with those in the Cs−1(xchol) profile: We can identify
at least three breakpoints in the A(xchol) profile, among which only the two breakpoints
with larger xchol values have their counterparts in the Cs−1(xchol) profile. Therefore,
we identified four breakpoints altogether in the case of 30 mN/m. The breakpoint at xchol ≈ 0.25 may correspond to the completion of the CC phase formation and the
breakpoint xchol ≈ 0.6 to segregation of pure cholesterol domains. We infer that a third
state other than the LC and CC phases should be required to explain the appearance of the breakpoints with lower xcholvalues. Another conspicuous characteristics in the low
xcholregion, which have already been pointed out previously [178], is the decrease in the
elastic modulus with increasing xchol. This fact suggests that the third state we assume
must have a smaller elastic modulus than that in the LC phase. We will discuss later about the inconsistency between the breakpoints in the A(xchol) and Cs−1(xchol) profiles using
3.3.2 Diacylphosphatidylcholine Chain Length Dependence of Surface Area Behaviors
Fig. 3.13 shows π − A isotherms of DMPC, DPPC and DSPC monolayers. Although these diacyl PCs differ in the hydrocarbon chain length (Section 2.1, Fig. 2.1), the π − A isotherm profiles in the LE, LC, and S phases agree well each other. Whereas DPPC monolayers assume the LE, LC, and S phases, DMPC monolayers, having shorter hydrocarbon chains, assume only the LE phase and DSPC monolayers, having longer hydrocarbon chains, assume the LC and S phases. In addition, the DSPC monolayer showed another phase transition from the S phase to the phase with more ordered molecular packing which appeared at surface pressures above 60 mN/m. The collapse pressure depended on the chain length, that is, the longer the chain length was, the higer the collapse pressure was.
In order to evaluate the effect of the hydrocarbon chain length, π − A isotherms of DMPC/cholesterol and DSPC/cholesterol binary monolayers were measured (Fig. 3.14) and the xcholdependences of the average molecular area A, the area elastic modulus Cs−1,
and the excess Gibbs free energy ∆Gexwere analyzed. We focused on the phase behavior
of these monolayers at 30 mN/m for comparison.
Fig. 3.15 shows the results of the analysis at 30 mN/m. The behaviors of DMPC/cholesterol and DSPC/cholesterol monolayers are quite similar to those of DPPC/cholesterol monolayers at 10 mN/m and 30 mN/m, respectively, suggesting that the phase in the absence of cholesterol mainly rules the phase states induced by addition of cholesterol. However, a close look at the data revealed that there were significant differences: In the DMPC/cholesterol monolayer system the Cs−1(xchol) profile showed
a two-step change in the xchol range from 0.2 to 0.7 (Fig. 3.15A (b)). The terrace in
the middle of the two-step change appeared at π ≥ 15 mN/m and became clearer as the surface pressure increased. The terrace may represent the CC phase because the elastic modulus of DMPC molecule estimated by fitting the data in the plateau to an ideal curve
end of the terrace region in the Cs−1(xchol) profile.
In the DSPC/cholesterol monolayer system an evident difference from the data in the DPPC/cholesterol monolayer system at 30 mN/m was that the Cs−1(xchol) data in the xchol
range from 0 to 0.1 fell on the ideal curve despite the negative deviation of A(xchol) from
the ideal line (Fig. 3.12B (a)). Another difference was that there seemed to be no definite region corresponding to the LC* phase seen in Fig. 3.12B (b).
Another common features are that ∆Gex was negative regardless of xchol and there
appeared a breakpoint indicating segregation of pure cholesterol domains as described in the DPPC/cholesterol monolayer system.
The partial molecular areas of diacyl PC and cholesterol at 30 mN/m were calculated as described in section 3.3 and plotted as a function of the hydrocarbon chain length (Fig. 3.16). The partial molecular areas of DPPC and DSPC in the LC phase ALCLipidwere almost the same as shown in Fig. 4. In contrast, the partial molecular area in the CC phase ACCLipid increased as the hydrocarbon chain length was decreased and became closer to the ALCLipid (Fig. 3.16A). Anyway, the lateral packing of diacyl PC molecules is tighter in the CC phase than in the LC phase. On the other hand, the partial molecular area of cholesterol in the CC phase ACCcholwas slightly larger than that in the pure cholesterol monolayer Apurechol (Fig. 3.16B). In addition, we calculated the partial molecular area of DPPC in the LC* phase ALC*DPPC by fitting the A(xchol) data in the xchol range from 0.12 to 0.2 in Fig. 3.12B
(a) to a straight line. The ALC*DPPCvalue was located just in the middle between ALCDPPCand ACCDPPCvalues (Fig. 3.16A) and the ALC*chol value was almost the same as ACCchol(Fig. 3.16B). Moreover, we calculated the apparent partial molecular area of cholesterol from the A(xchol) data in the xchol range from 0 to the first breakpoint on adding cholesterol.
(Here, we denote it as ALCchol for convenience). The ALCchol should contain information on the boundary lipids surrounding a cholesterol molecule in the LC phase as discussed by Edholm et al. [178]. Here, we call the boundary lipids “the vicinity lipids”and will propose a model in which all the DPPC molecules in the LC* phase are in the state of the vicinity lipid (see Discussion). If the small value of ALCchol in Fig. 3.16B is due to the areal shrinkage of the vicinity lipid from the bulk lipid in the LC phase, the value of ( Apurechol − ALCchol)/n corresponds to the molecular area difference between the vicinity lipid and the bulk lipid (n is the number of the vicinity lipids surrounding a cholesterol
molecule).
Conclusion II
The Saturated Diacylphosphatidylcholine/Cholesterol Binary Monolayer System The detailed phase behaviors in the saturated diacyl PC/cholesterol binary monolayer systems were examined by measuring π − A isotherms repeatedly under the same conditions to obtain reliable data. The intermolecular interaction between diacyl PC and cholesterol was evaluated by analyzing the cholesterol mole fraction dependence of the average molecular area A(xchol) and the area elastic modulus Cs−1(xchol) at a fixed
pressure. Our analysis revealed that several phase regions can be identified and the partial molecular areas and elastic moduli of diacyl PC and cholesterol in single phase regions can be estimated. We found that addition of cholesterol induces a highly condensed phase (here we call “the cholesterol-induced condensed (CC) phase”), in which the molecular area of diacyl PC is smaller than that in the solid phase, irrespective of the hydrocarbon chain length of diacyl PC and the surface pressure. Moreover, we needed to assume at least one more state for a diacyl PC molecule other than the states in the pure diacyl PC monolayer and the CC phase in order to explain the phase behavior in the low xchol
region. We demonstrated that the assumption of three states for each of diacyl PC and cholesterol can explain sufficiently the behaviors of the A(xchol) and Cs−1(xchol) in the
DPPC/cholesterol monolayer system at 30 mN/m except for the high xcholregion. Thus,
the π − A isotherms with high accuracy are very useful for the analysis of the phase state in the cholesterol-containing binary monolayer system.
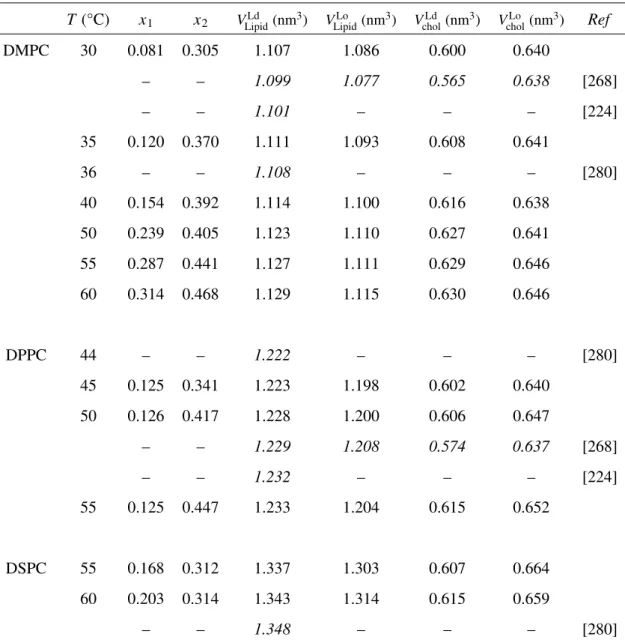
Table 3.1: Partial molecular volumes in the diacylphosphatidylcholine/cholesterol binary bilayer system above Tm
T (°C) x1 x2 VLipidLd (nm3) VLipidLo (nm3) VcholLd (nm3) VcholLo (nm3) Ref
DMPC 30 0.081 0.305 1.107 1.086 0.600 0.640 – – 1.099 1.077 0.565 0.638 [268] – – 1.101 – – – [224] 35 0.120 0.370 1.111 1.093 0.608 0.641 36 – – 1.108 – – – [280] 40 0.154 0.392 1.114 1.100 0.616 0.638 50 0.239 0.405 1.123 1.110 0.627 0.641 55 0.287 0.441 1.127 1.111 0.629 0.646 60 0.314 0.468 1.129 1.115 0.630 0.646 DPPC 44 – – 1.222 – – – [280] 45 0.125 0.341 1.223 1.198 0.602 0.640 50 0.126 0.417 1.228 1.200 0.606 0.647 – – 1.229 1.208 0.574 0.637 [268] – – 1.232 – – – [224] 55 0.125 0.447 1.233 1.204 0.615 0.652 DSPC 55 0.168 0.312 1.337 1.303 0.607 0.664 60 0.203 0.314 1.343 1.314 0.615 0.659 – – 1.348 – – – [280]
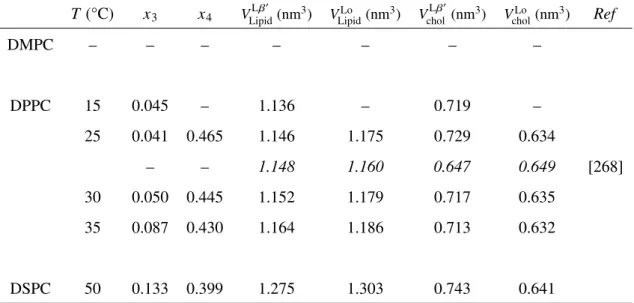
Table 3.2: Partial molecular volume in the diacylphosphatidylcholine/cholesterol binary bilayer system below Tm
T(°C) x3 x4 VLβ 0 Lipid(nm 3) VLo Lipid(nm 3) VLβ0 chol(nm 3) VLo chol(nm 3) Ref DMPC – – – – – – – DPPC 15 0.045 – 1.136 – 0.719 – 25 0.041 0.465 1.146 1.175 0.729 0.634 – – 1.148 1.160 0.647 0.649 [268] 30 0.050 0.445 1.152 1.179 0.717 0.635 35 0.087 0.430 1.164 1.186 0.713 0.632 DSPC 50 0.133 0.399 1.275 1.303 0.743 0.641 ※ The values in italics were cited from literature.
Table 3.3: Thermal expansion coefficients in the diacylphosphatidylcholine/cholesterol binary monolayer system
Thermal expansion coefficients (×10−4K−1) Lβ0 phase Lophase Ldphase
DMPC – 8.5 7.4
DPPC 9.8 8.7 8.5
Table 3.4: Partial molecular area in the diacylphosphatidylcholine/cholesterol binary monolayer system π (mN/m) ALE Lipid (nm2) ACCLipid (nm 2) ALE chol(nm2) ACCchol(nm 2) DMPC 5 0.773 – 0.238 – 10 0.687 – 0.198 – 15 0.628 – 0.205 – 20 0.582 0.455 0.218 0.351 25 0.547 0.438 0.223 0.352 30 0.517 0.422 0.221 0.355 35 0.492 0.404 0.217 0.367 π (mN/m) ALC Lipid (nm 2) ACC Lipid (nm 2) ALC chol(nm 2) ACC chol(nm 2) DPPC 5 0.776 0.482 – 0.304 0.376 10 0.680 0.456 – 0.216 0.375 15 0.514 0.444 0.247 0.371 20 0.479 0.433 0.181 0.369 25 0.457 0.399 0.152 0.386 30 0.441 0.385 0.112 0.381 35 0.430 0.379 0.102 0.383 π (mN/m) ALC Lipid (nm 2) ACC Lipid (nm 2) ALC chol(nm 2) ACC chol(nm 2) DSPC 5 0.504 0.396 – 0.005 0.404 10 0.481 0.357 0.050 0.402 15 0.467 0.347 0.053 0.400 20 0.456 0.340 0.042 0.397 25 0.446 0.334 0.034 0.393 30 0.436 0.329 0.030 0.388 35 0.427 0.323 0.027 0.385
![Figure 1.1: Schematic representation of biomembrane based on the fluid mosaic membrane model [10, 16]](https://thumb-ap.123doks.com/thumbv2/123deta/8222682.1281217/20.892.169.732.404.736/figure-schematic-representation-biomembrane-based-fluid-mosaic-membrane.webp)
![Figure 1.3: A DSC thermogram of the pure DPPC bilayer showing three phases transition (L c’ → L β 0 → P β 0 → L α ) and schematic illustration of the bilayer stricture in each phase [7, 8, 82–84, 86, 89, 90, 92, 93, 96–99]](https://thumb-ap.123doks.com/thumbv2/123deta/8222682.1281217/22.892.160.736.189.917/figure-thermogram-bilayer-showing-transition-schematic-illustration-stricture.webp)
![Figure 1.6: Schematic illustration of the raft domain [10, 185, 187, 192, 194]. This domain is a complex consisting of a specific molecule group containing sphingomyelin, cholesterol, glycosylphosphatidylinositol (GPI)-anchored protein and so on.](https://thumb-ap.123doks.com/thumbv2/123deta/8222682.1281217/25.892.145.751.348.835/schematic-illustration-consisting-specific-containing-sphingomyelin-cholesterol-glycosylphosphatidylinositol.webp)