A uthor(s )
K awaguchi, T akahisa; S hima, T oshihide; Mizuno, Masayuki;
Mitsumoto, Y asuhide; Umemura, A tsushi; K anbara, Y oshihiro;
T anaka, S aiyu; S umida, Y oshio; Y asui, K ohichiro; T akahashi,
Meiko; Matsuo, K eitaro; Itoh, Y oshito; T okushige, K atsutoshi;
Hashimoto, E tsuko; K iyosawa, K endo; K awaguchi, Masanori;
Itoh, Hiroyuki; Uto, Hirofumi; K omorizono, Y asuji; S hirabe,
K en; T akami, S hiro; T akamura, T oshinari; K awanaka, Miwa;
Y amada, R yo; Matsuda, F umihiko; Okanoue, T akeshi
C itation
PL OS ONE (2018), 13(1)
Is s ue D ate
2018-01-31
UR L
http://hdl.handle.net/2433/229128
R ig ht
©
2018 K awaguchi et al. T his is an open access article
distributed under the terms of the C reative C ommons
A ttribution L icense, which permits unrestricted use,
distribution, and reproduction in any medium, provided the
original author and source are credited.
T ype
J ournal A rticle
Risk estimation model for nonalcoholic fatty
liver disease in the Japanese using multiple
genetic markers
Takahisa Kawaguchi1, Toshihide Shima2, Masayuki Mizuno2, Yasuhide Mitsumoto2, Atsushi Umemura2, Yoshihiro Kanbara3, Saiyu Tanaka4, Yoshio Sumida4,
Kohichiro Yasui5, Meiko Takahashi1, Keitaro Matsuo6, Yoshito Itoh5,
Katsutoshi Tokushige7, Etsuko Hashimoto7, Kendo Kiyosawa8, Masanori Kawaguchi9, Hiroyuki Itoh10, Hirofumi Uto11, Yasuji Komorizono12, Ken Shirabe13, Shiro Takami14, Toshinari Takamura15, Miwa Kawanaka16, Ryo Yamada1, Fumihiko Matsuda1*, Takeshi Okanoue2*
1Center for Genomic Medicine, Kyoto University Graduate School of Medicine, Kyoto, Japan,2Department of Gastroenterology and Hepatology, Saiseikai Suita Hospital, Suita, Japan,3Department of Surgery, Saiseikai Suita Hospital, Suita, Japan,4Center of Hepatology, Nara Municipal Hospital, Nara, Japan,
5Department of Gastroenterology, Kyoto Prefectural University of Medicine, Kyoto, Japan,6Division of Molecular and Clinical Epidemiology, Aichi Cancer Center Research Institute, Aichi, Japan,7Department of Internal Medicine and Gastroenterology, Tokyo Women’s Medical University, Tokyo, Japan,8Department of Gastroenterology, Nagano Red Cross Hospital, Nagano, Japan,9Department of Gastroenterology, Saiseikai Wakayama Hospital, Wakayama, Japan,10 Department of Gastroenterology, Kure Saiseikai Hospital, Kure, Japan,11 Digestive and Life-style Related Disease, Kagoshima University Graduate School of Medicine and Dental Science, Kagoshima, Japan,12Department of Hepatology, Nanpuh Hospital, Kagoshima, Japan,13Department of Surgery and Science, Graduate School of Medical Science, Kyushu University, Fukuoka, Japan,14Department of Gastroenterology, Otsu Municipal Hospital, Otsu, Japan,
15Disease Control and Homeostasis, Kanazawa University Graduate School of Medical Science, Kanazawa, Japan,16Center of Liver Disease, Kawasaki Hospital, Kawasaki Medical School, Okayama, Japan
*fumi@genome.med.kyoto-u.ac.jp(FM);okanoue@suita.saiseikai.or.jp(TO)
Abstract
The genetic factors affecting the natural history of nonalcoholic fatty liver disease (NAFLD), including the development of nonalcoholic steatohepatitis (NASH) and NASH-derived hepa-tocellular carcinoma (NASH-HCC), are still unknown. In the current study, we sought to identify genetic factors related to the development of NAFLD, NASH, and NASH-HCC, and to establish risk-estimation models for them. For these purposes, 936 histologically proven NAFLD patients were recruited, and genome-wide association (GWA) studies were con-ducted for 902, including 476 NASH and 58 NASH-HCC patients, against 7,672 general-population controls. Risk estimations for NAFLD and NASH were then performed using the SNPs identified as having significant associations in the GWA studies. We found that rs2896019 inPNPLA3[p= 2.3x10⁻³¹, OR (95%CI) = 1.85 (1.67–2.05)], rs1260326 inGCKR [p= 9.6x10⁻¹⁰, OR (95%CI) = 1.38(1.25–1.53)], and rs4808199 inGATAD2A[p= 2.3x10⁻⁸, OR (95%CI) = 1.37 (1.23–1.53)] were significantly associated with NAFLD. Notably, the number of risk alleles inPNPLA3andGATAD2Awas much higher in Matteoni type 4 (NASH) patients than in type 1, type 2, and type 3 NAFLD patients. In addition, we newly identified rs17007417 inDYSF[p= 5.2x10⁻⁷, OR (95%CI) = 2.74 (1.84–4.06)] as a SNP a1111111111 a1111111111 a1111111111 a1111111111 a1111111111 OPEN ACCESS
Citation:Kawaguchi T, Shima T, Mizuno M, Mitsumoto Y, Umemura A, Kanbara Y, et al. (2018) Risk estimation model for nonalcoholic fatty liver disease in the Japanese using multiple genetic markers. PLoS ONE 13(1): e0185490.https://doi. org/10.1371/journal.pone.0185490
Editor:Silvia C. Sookoian, Institute of Medical Research A Lanari-IDIM, University of Buenos Aires-National Council of Scientific and Technological Research (CONICET), ARGENTINA
Received:February 13, 2017
Accepted:September 13, 2017
Published:January 31, 2018
Copyright:©2018 Kawaguchi et al. This is an open access article distributed under the terms of the
Creative Commons Attribution License, which permits unrestricted use, distribution, and reproduction in any medium, provided the original author and source are credited.
associated with NASH-HCC. Rs641738 inTMC4, which showed association with NAFLD in patients of European descent, was not replicated in our study (p= 0.73), although the com-plicated LD pattern in the region suggests the necessity for further investigation. The genetic variants ofPNPLA3,GCKR, andGATAD2Awere then used to estimate the risk for NAFLD. The obtained Polygenic Risk Scores showed that the risk for NAFLD increased with the accumulation of risk alleles [AUC (95%CI) = 0.65 (0.63–0.67)]. Conclusions: We demon-strated that NASH is genetically and clinically different from the other NAFLD subgroups. We also established risk-estimation models for NAFLD and NASH using multiple genetic markers. These models can be used to improve the accuracy of NAFLD diagnosis and to guide treatment decisions for patients.
Introduction
Nonalcoholic fatty liver disease (NAFLD) is frequently associated with metabolic syndrome, a broad range of pathologies including nonalcoholic fatty liver (NAFL), nonalcoholic steatohe-patitis (NASH), cirrhosis, and hepatocellular carcinoma (NASH-HCC). NAFLD is classified into four subgroups based on its long-term histological progression. Type 1 (steatosis) and type 2 (steatonecrosis) are classified as NAFL, and type 3 (steatohepatitis) and type 4 (steatohe-patitis with fibrosis) as NASH[1]. The prevalence of NAFLD varies widely across the world; for example, it is rare in Asian countries and more common in North America[2]. It was recently reported that the overall NASH prevalence among biopsied NAFLD patients is 59.1% [2].
NAFLD including NASH has a highly varied natural history. In a longitudinal study of 81 NASH and 27 NAFL patients with serial liver biopsies, 45 (42%) patients showed fibrosis pro-gression, while 20 (18%) showed regression after the median follow-up period of 6.6 years[3]. NASH-HCC is considered to be derived mainly from cirrhotic liver, although other factors such as advanced fibrosis and the presence of diabetes mellitus are high risk factors for HCC development[4,5]. Notably, approximately one third of NASH-HCC cases are derived from non-cirrhotic liver[6,7]. These findings indicate that multiple environmental, lifestyle, and genetic factors are involved in its onset and progression. Recent studies demonstrated that, among the pathologic features of NAFLD, only fibrosis independently predicts long-term liver-related mortality [8,9].
The first genome-wide association (GWA) study for NAFLD used NAFLD cases diagnosed by liver fat content, and identifiedPNPLA3as a major genetic determinant for fatty liver and triglyceride content[10] in Hispanic, African American, and European populations. Subse-quent studies[6,11–15] showed an association ofPNPLA3with inflammation, fibrosis, and HCC development. An association ofPNPLA3with NASH-HCC in European and Japanese populations was demonstrated by genotyping candidate SNPs[6,15,16]. Exome-wide analyses and subsequent replication studies showed an association ofTM6SF2with NAFLD[17,18]. Rs641738, originally regarded as located in theMBOAT7locus but now confirmed to be located inTMC4, was initially reported as a susceptibility variant for alcohol-related cirrhosis [19], and was later found to be associated with NAFLD patients of European descent[20]. This variant was not replicated further in any other populations.
We previously reported the results of a GWA study using 529 histologically proven NAFLD cases, that demonstrated that Matteoni type 4 (histologically typical NASH) was both geneti-cally and clinigeneti-cally different from the other three Matteoni types in the Japanese[21]. However, in that study only 29 Matteoni type 3 cases and no NASH-HCC cases were included.
email address (yamaguchi@genome.med.kyoto-u. ac.jp) or Fumihiko Matsuda at the email address (fumi@genome.med.kyoto-u.ac.jp) in order to request access to this data.
Funding:This work was supported by the grant from Ministry of Labor and Welfare Japan [T.O., H20-Hepatitis-general-008], Core Research of Evolutional Science & Technology (CREST), Research Program on Hepatitis from Japan Agency for Medical Research and Development, AMED. The funders had no role in study design, data collection and analysis, decision to publish, or preparation of the manuscript.
In the present study, we sought to identify genetic factors influencing the development of NAFLD and its progression to NASH-HCC in the Japanese using 902 NAFLD patients. These patients included our previously reported cases, plus 373 new histologically proven cases including 75 type 3 cases and 58 NASH-HCC cases. We also sought to establish risk estimation models for these diseases using multiple genetic markers associated with them.
Materials and methods
Study population
A total of 936 NAFLD patients were recruited at 16 hospitals participating in this study con-sortium. Among them, 888 samples were collected on Honshu Island, while 14 and 34 sam-ples were collected from Kyushu and Shikoku Islands, respectively. Clinical and laboratory data were collected within 14 days before liver biopsy for all of the patients. Inclusion criteria were the same as described in our previous report[21]. Information regarding alcohol usage was obtained from patient surveys. Patients who drank more than 20 g of alcohol per day were excluded. All patients were diagnosed by a hepatopathologist (T.O.) according to Mat-teoni’s classification[1]. We included 529 cases from our previous study[21], plus 349 new NAFLD and 58 new NASH-HCC patients. The 349 NAFLD cases were classified as 34 type 1, 60 type 2, 84 type 3, and 171 type 4. Non-tumor livers in 58 HCC cases were histologically examined by the same hepatopathologist and diagnosed as type 4 NASH. As a general-popu-lation control, 8,364 individual DNA samples of Honshu Island origin consisting of 3,037 collected at Aichi Cancer Center (ACC) including 932 used in our previous study[21], and 5,327 collected for the Nagahama Study[22] were used. In compliance with the Declaration of Helsinki, ethical approval for this study was given by the respective Institutional Review Board and subject written informed consent were obtained for all subjects (Institutional Review Board and Ethics Committee of Kyoto University School of Medicine; Ethical com-mittee of Saiseikai Suita Hospital; Ethics comcom-mittee of Kyoto Prefectural University of Medi-cine; Ethical Committee of Aichi Cancer Center; Ethics Committee of Tokyo Women’s Medical University; Institutional Review Board of Nagano Red Cross Hospital; Ethical com-mittee of Saiseiken Wakayama Hospital; Ethical comcom-mittee of Kure Saiseikai Hospital; Ethi-cal committee of Kagoshima University; EthiEthi-cal committee of Nanpuh Hospital; Kyushu University Institutional Review Board for Clinical Research; Ethical committee of Otsu Municipal Hospital; Medical Ethics Committee of Kanazawa University; Ethical Committee on Kawasaki Medical School and Kawasaki Medical School Hospital; Ethical committee of Nara City Hospital; Ethical Committee of Kochi Medical School, Kochi University; Ethical Committee of Juntendo University; Ethics Committee of Yamagata University School of Medicine; Ethical Committee of the Ikeda Municipal Hospital). Especially, the genome wide association study is approved by IRB at Kyoto University School of Medicine (G1094). All patients were fully informed of the purpose and procedures of this study, and written con-sent was obtained from each subject.
SNP genotyping and quality controls
Statistical analysis
Logistic regression was used for statistical analyses of the GWA studies, comparing 1) all NAFLD patients or 2) NASH-HCC patients with the controls. Population stratification was assessed by the genomic control method[23] and adjusted for 10 principle components (PCs) calculated using a tool for Genome-wide Complex Trait Analysis[24]. Genome-wide signifi-cance was set asp= 5.3x10⁻⁷based on Bonferroni’s correction for multiple testing. Regional genotype imputations were performed with MACH[25] using the 1000 Genomes Project Con-sortium[26] phase I release version 3 as a template, and SNPs passing an imputation quality threshold of r2>0.5 were used. Linkage disequilibrium (LD) indices were calculated by PLINK [27]. We also conducted a GWA study for the Brunt stage, Brunt grade, and fat-droplet con-tent using ordinal logistic regression. The allele distributions of the genome-wide significant SNPs were compared between the different subgroups of Matteoni types by logistic regression, adjusting for age, sex, BMI, and the 10 PCs.
Polygenic Risk Scores (PRS) were calculated for all NAFLD patients compared with con-trols. We also calculated the PRS for Matteoni type 4 + NASH-HCC compared with Matteoni type 1 to 3, and for NASH-HCC compared with Matteoni type 4. Using the genome-wide sig-nificant SNPs identified in the GWA studies, we generated models by a forward stepwise selec-tion procedure for each comparison, including sex as basic genetic background. PRS were then calculated for each subject using the estimated model, and the study subjects were divided into quintile groups (Q1 to Q5). We compared the lowest quintile group (Q1) with the other groups (Q2 to Q5) using fisher.test in the R package. We also sought to improve the model by adding SNPs previously reported to be associated with NAFLD. We performed additional GWAs for these SNPs, and those with a low p-value (p<1e-4) were included in the models.
Results
Characteristics of the study population
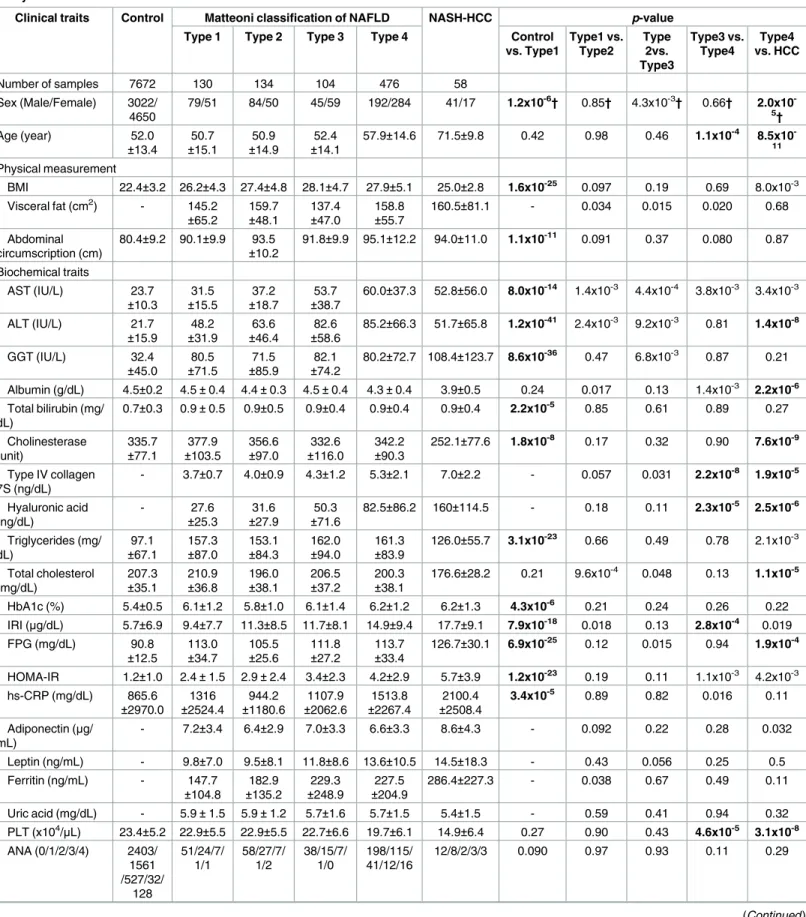
The clinical characteristics of the 902 patients and 7,672 control subjects are summarized in
Table 1. We compared the distribution of clinical traits between the general-population controls
and the Matteoni type 1 subgroup (21 traits), the type 1 and type 2 subgroups (31 traits), the type 2 and type 3 subgroups (31 traits), the type 3 and type 4 subgroups (32 traits), and the type 4 and NASH-HCC subgroups (31 traits). In agreement with our previous study, the results suggested that Matteoni type 4 (histologically typical NASH) was clinically different from the other three Matteoni types. The NASH-HCC and control subjects also showed a clearly different clinical back-ground from the NAFLD patients. A significant difference (p<3.5x10⁻⁴) was observed for 34 of the 146 traits examined, of which 16 were observed between the controls and the type 1 subgroup. There were no significant differences between the type 1 and type 2 or the type 2 and type 3 sub-groups, except for the fat-droplet content (p= 3.2x10⁻⁴) between type 1 and type 2. In contrast, six traits, including two biomarkers for liver fibrosis (type IV collagen 7S and hyaluronic acid) were significantly different between the type 3 and type 4 subgroups. These results suggested that Mat-teoni type 1, type 2, and type 3 belonged to the same subgroup, and MatMat-teoni type 4 formed a dis-tinct subgroup. In the comparison between type 4 and NASH-HCC, 11 clinical traits showed significant differences. All of these 11 markers were associated with the severity of fibrosis, decline of liver function, or a higher age range in the NASH-HCC compared to the type 4 NASH patients.
Genome-wide association studies
Table 1. Clinical characteristics of the patient populations according to histological classification and the control population enrolled in the study.
Clinical traits Control Matteoni classification of NAFLD NASH-HCC p-value Type 1 Type 2 Type 3 Type 4 Control
vs. Type1 Type1 vs. Type2 Type 2vs. Type3 Type3 vs. Type4 Type4 vs. HCC
Number of samples 7672 130 134 104 476 58
Sex (Male/Female) 3022/ 4650
79/51 84/50 45/59 192/284 41/17 1.2x10⁻⁶† 0.85† 4.3x10⁻³† 0.66† 2.0x10 -5†
Age (year) 52.0
±13.4 ±15.150.7 ±14.950.9 ±14.152.4 57.9±14.6 71.5±9.8 0.42 0.98 0.46 1.1x10
-4 8.5x10 -11
Physical measurement
BMI 22.4±3.2 26.2±4.3 27.4±4.8 28.1±4.7 27.9±5.1 25.0±2.8 1.6x10⁻²⁵ 0.097 0.19 0.69 8.0x10⁻³ Visceral fat (cm2) - 145.2
±65.2 159.7±48.1 137.4±47.0 158.8±55.7 160.5±81.1 - 0.034 0.015 0.020 0.68
Abdominal circumscription (cm)
80.4±9.2 90.1±9.9 93.5
±10.2 91.8±9.9 95.1±12.2 94.0±11.0 1.1x10
-11 0.091 0.37 0.080 0.87
Biochemical traits
AST (IU/L) 23.7
±10.3 31.5 ±15.5 37.2 ±18.7 53.7 ±38.7
60.0±37.3 52.8±56.0 8.0x10⁻¹⁴ 1.4x10⁻³ 4.4x10⁻⁴ 3.8x10⁻³ 3.4x10⁻³
ALT (IU/L) 21.7
±15.9 48.2 ±31.9 63.6 ±46.4 82.6 ±58.6
85.2±66.3 51.7±65.8 1.2x10-41 2.4x10⁻³ 9.2x10⁻³ 0.81 1.4x10⁻⁸
GGT (IU/L) 32.4
±45.0 80.5 ±71.5 71.5 ±85.9 82.1 ±74.2
80.2±72.7 108.4±123.7 8.6x10-36 0.47 6.8x10⁻³ 0.87 0.21
Albumin (g/dL) 4.5±0.2 4.5±0.4 4.4±0.3 4.5±0.4 4.3±0.4 3.9±0.5 0.24 0.017 0.13 1.4x10⁻³ 2.2x10⁻⁶
Total bilirubin (mg/ dL)
0.7±0.3 0.9±0.5 0.9±0.5 0.9±0.4 0.9±0.4 0.9±0.4 2.2x10⁻⁵ 0.85 0.61 0.89 0.27
Cholinesterase (unit)
335.7
±77.1 ±103.5377.9 356.6±97.0 ±116.0332.6 342.2±90.3 252.1±77.6 1.8x10
-8 0.17 0.32 0.90 7.6x10⁻⁹
Type IV collagen 7S (ng/dL)
- 3.7±0.7 4.0±0.9 4.3±1.2 5.3±2.1 7.0±2.2 - 0.057 0.031 2.2x10⁻⁸ 1.9x10⁻⁵
Hyaluronic acid (ng/dL)
- 27.6
±25.3 ±27.931.6 ±71.650.3 82.5±86.2 160±114.5 - 0.18 0.11 2.3x10
-5 2.5x10⁻⁶
Triglycerides (mg/ dL)
97.1
±67.1 157.3±87.0 153.1±84.3 162.0±94.0 161.3±83.9 126.0±55.7 3.1x10
-23 0.66 0.49 0.78 2.1x10⁻³
Total cholesterol (mg/dL)
207.3
±35.1 210.9±36.8 196.0±38.1 206.5±37.2 200.3±38.1 176.6±28.2 0.21 9.6x10
-4 0.048 0.13 1.1x10⁻⁵
HbA1c (%) 5.4±0.5 6.1±1.2 5.8±1.0 6.1±1.4 6.2±1.2 6.2±1.3 4.3x10⁻⁶ 0.21 0.24 0.26 0.22
IRI (μg/dL) 5.7±6.9 9.4±7.7 11.3±8.5 11.7±8.1 14.9±9.4 17.7±9.1 7.9x10⁻¹⁸ 0.018 0.13 2.8x10⁻⁴ 0.019
FPG (mg/dL) 90.8
±12.5 113.0±34.7 105.5±25.6 111.8±27.2 113.7±33.4 126.7±30.1 6.9x10
-25 0.12 0.015 0.94 1.9x10⁻⁴
HOMA-IR 1.2±1.0 2.4±1.5 2.9±2.4 3.4±2.3 4.2±2.9 5.7±3.9 1.2x10⁻²³ 0.19 0.11 1.1x10⁻³ 4.2x10⁻³ hs-CRP (mg/dL) 865.6
±2970.0 1316 ±2524.4 944.2 ±1180.6 1107.9 ±2062.6 1513.8 ±2267.4 2100.4 ±2508.4
3.4x10⁻⁵ 0.89 0.82 0.016 0.11
Adiponectin (μg/ mL)
- 7.2±3.4 6.4±2.9 7.0±3.3 6.6±3.3 8.6±4.3 - 0.092 0.22 0.28 0.032
Leptin (ng/mL) - 9.8±7.0 9.5±8.1 11.8±8.6 13.6±10.5 14.5±18.3 - 0.43 0.056 0.25 0.5
Ferritin (ng/mL) - 147.7
±104.8 ±135.2182.9 ±248.9229.3 ±204.9227.5 286.4±227.3 - 0.038 0.67 0.49 0.11
Uric acid (mg/dL) - 5.9±1.5 5.9±1.2 5.7±1.6 5.7±1.5 5.4±1.5 - 0.59 0.41 0.94 0.32
PLT (x104/μL) 23.4±5.2 22.9±5.5 22.9±5.5 22.7±6.6 19.7±6.1 14.9±6.4 0.27 0.90 0.43 4.6x10⁻⁵ 3.1x10⁻⁸
ANA (0/1/2/3/4) 2403/ 1561 /527/32/ 128 51/24/7/ 1/1 58/27/7/ 1/2 38/15/7/ 1/0 198/115/ 41/12/16
12/8/2/3/3 0.090 0.97 0.93 0.11 0.29
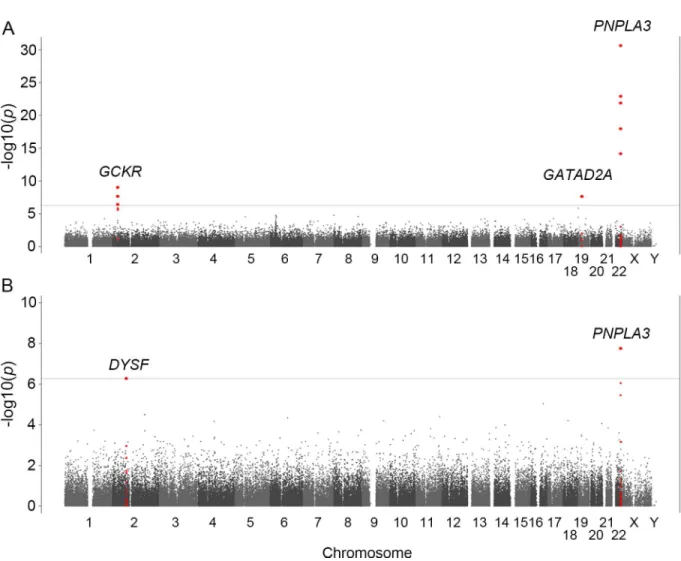
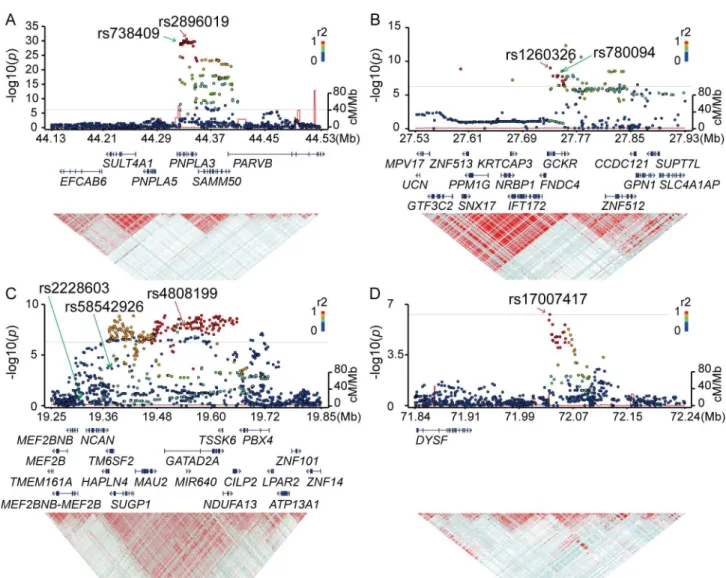
observed after adjusting the population stratification using 10 PCs (λ= 1.12). Significant asso-ciation signals (p<5.3x10⁻⁷) were detected in three chromosomes (Fig 1A,Table 2). The stron-gest association was observed for rs2896019 (p= 2.3x10⁻³¹), at 22q13.31 in thePNPLA3gene, which has repeatedly been reported as a strong genetic determinant for NAFLD. Rs738409, a non-synonymous SNP reportedly associated with NAFLD, was not identified in this analysis. However, its association with NAFLD was observed in the regional imputation analysis (p= 1.0x10⁻²⁹) (Fig 2A). The second strongest association was detected for rs1260326 (p= 9.6x10⁻¹⁰), at 2p23.3 in the glucokinase regulator (GCKR)gene, another known susceptibility gene for NAFLD[12] (Fig 2B). A previously reported SNP, rs780094, also showed significant association with NAFLD (p= 2.1x10⁻⁸). The third strongest association was detected for rs4808199 (p= 2.3x10⁻⁸), in the vicinity of the GATA Zinc Finger Domain Containing 2A (GATAD2A) gene at 19p13.11. Rs4808199 was located in a 360-kb LD block encompassingNCANandTM6SF2, which are both known to be associated with NAFLD[12,17] (Fig 2C). However, no association was detected for rs2228603 inNCAN, which was reported to be associated with NAFLD. The regional imputation analysis detected an indicative association signal for rs58542926 inTM6SF2 (p= 2.2x10⁻⁴). A weak linkage disequilibrium between rs58542926 and rs4808199 was observed (r2 = 0.21.) The associations ofPNPLA3andGATAD2Awere lost when the type 1 to type 3 patients were used as cases. In contrast, they became stronger when only type 4 and NASH-HCC patients were used (p= 2.9x10⁻³⁴for rs2896019 andp= 2.0x10⁻⁸for rs4808199, respec-tively), but the association ofGCKRwas lost (S2 Table).
We also performed a GWA study between 58 NASH-HCC patients and the same 7,672 con-trols. Population stratification was not observed (λ= 1.00) for this analysis. The significant
Table 1. (Continued)
Clinical traits Control Matteoni classification of NAFLD NASH-HCC p-value Type 1 Type 2 Type 3 Type 4 Control
vs. Type1 Type1 vs. Type2 Type 2vs. Type3 Type3 vs. Type4 Type4 vs. HCC Clinical history Diabetes (NGT/ IGT/DM)
- 48/17/38 48/11/32 35/9/11 214/51/ 120
31/4/8 0.59† 0.15† 0.23† 0.11†
Hyperlipidemia (-/+)
4133/ 518
48/73 54/72 30/48 174/266 27/20 3.6x10-58† 0.70† 0.63† 0.95† 0.027†
Hypertension (-/+) 3806/ 845
77/44 69/57 43/35 219/222 20/32 7.1x10⁻⁷† 0.19† 0.92† 0.44† 0.17†
Liver biopsy features
Brunt grade (1/2/3) - - - 71/24/4 203/196/
69
- - - - 1.7x10⁻⁷
-Brunt stage (1/2/3/ 4)
- - - - 184/101/
144/45
- - -
-Fat droplet (1/2/3/ 4) - 25/57/34/ 12 6/60/33/ 29 8/32/31/ 22 17/144/ 193/96
8/18/7/2 - 3.2x10⁻⁴ 0.53 0.41 2.5x10⁻⁷
Iron deposition (0/ 1/2/3/4) - 41/18/27/ 10/1 49/24/16/ 9/1 30/13/7/ 8/1 181/86/ 54/41/14
13/3/1/6/1 - 0.16 0.94 0.72 0.93
Measurements are shown as mean±standard deviation. Categorical values are shown by the count number. The distribution of each class is compared to that immediately to its left.The p-values less than the threshold are in bold text. The threshold for significant association was set at 2.4x10⁻³for the
comparison between control and Matteoni type 1 and at 1.6x10⁻³for the other comparisons. BMI: Body Mass Index, AST: Aspartate Aminotransferase, ALT: Alanine transaminase, GGT: Gamma-glutamyl transferase, IRI: Insulin, FPG: Fasting Plasma Glucose, HOMA-IR: Homeostasis model assessment-Insulin Resistance, PLT: Platelets, ANA: Antinuclear Antibodies. P-values are calculated by logistic regression otherwise stated:
†Chi-squared test.
association ofPNPLA3was again observed (p= 1.8x10⁻⁸for rs2896019). In addition, we detected a significant association in the vicinity of the dystrophy-associated fer-1-like protein (Dysferlin orDYSF)gene on 2p13.3 (p= 5.2x10⁻⁷for rs17007417) (Fig 1BandTable 2). Regional imputation analysis detected an association peak consisting of multiple SNP markers, of which rs17007417 showed the highest association (Fig 2D). The list of SNP markers for whichp<1.0x10⁻⁵is provided as supplementary information (S3 Table) We also performed a GWA study using the ordinal logistic regression for Brunt grade as a metric for necroinflam-matory activity, Brunt stage as the fibrosis stage, and fat-droplet content. No genome-wide sig-nificant SNPs were identified in these studies except for rs2896019 inPNPLA3, which showed a moderate association with fat-droplet content (p = 3.7x10⁻⁴) (S4 TableandS1 Fig).
Associations of previously reported SNPs with NAFLD
Rs641738, a genetic variant that was recently shown to be associated with NAFLD[20], was included in the SNP markers examined in the current GWA study. However, we did not find any association of rs641738 with NAFLD, or with the Matteoni type 4 or NASH-HCC sub-group. We also examined the association of 14 other SNPs reviewed in Anstee et al. that were
Fig 1. Manhattan plots of the GWA data.Thep-values for genotyped SNPs from the GWA study for all NAFLD patients (A) and for NASH-HCC patients (B) compared to controls are plotted along each chromosome in−log10scale. Horizontal line indicates the Bonferroni significance threshold (p= 5.3×10⁻⁷).
reported to be associated with the disease[28]. None of them showed genome-wide signifi-cance in our analysis, although rs58542926 inTM6SF2(p = 2.2x10⁻⁴) and rs1800234 inPPARA (p = 6.5x10⁻⁵) showed significant associations when the cut-offp-value was corrected for mul-tiple testing top<0.0035 (S5 Table). In addition, we examined whether the above 14 markers showed an association with the Brunt stage, Brunt grade, or fat-droplet content in the patient population. However, we did not find associations of any of the 14 markers with these NAFLD-related phenotypes.
Impact of genetic variations on the pathogenicity of NAFLD
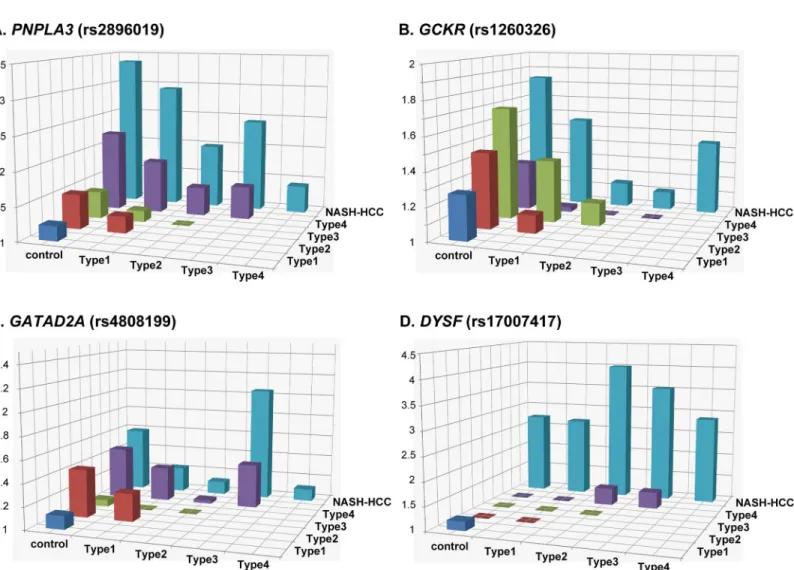
We next investigated the impact of the genetic variations identified as significant in the GWA studies on the pathogenicity of the disease. The genotype distributions of rs2896019 in
PNPLA3, rs4808199 inGATAD2A, rs1260326 inGCKR, and rs17007417 inDYSFwere
com-pared among the controls and the five patient subgroups. As reported previously[21], a signifi-cant difference (p<3.3x10⁻³) was observed for rs2896019 in Matteoni type 4 compared with the controls or the type 1 subgroup [p= 1.0x10⁻²⁸with an odds ratio (OR) of 2.23 and 95% confidence interval (95%CI) between 1.93 and 2.56, andp= 7.90x10⁻⁶, OR (95%CI) = 1.93 (1.45–2.58), respectively] (Fig 3AandS6A Table). The same trends were observed when type 4 was compared with type 2 and type 3, although the differences were not significant after correcting for multiple testing. The difference in rs2896019 was greatest between NASH-HCC and controls, type1, or type 3. The association was at the border of significance when NASH-HCC was compared with type 2 (p= 3.9x10⁻³), but more importantly, no association was observed when compared with type 4. Rs1260326 inGCKRshowed significant associations with type 3, type 4, and NASH-HCC when compared with controls (Fig 3BandS6B Table). Notably, no statistical differences were observed among the five subgroups of patients. For
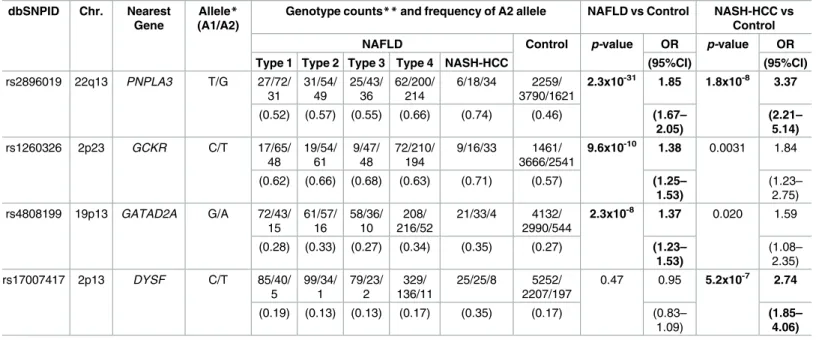
Table 2. SNP markers showing significant association in the GWA studies. dbSNPID Chr. Nearest
Gene
Allele*
(A1/A2)
Genotype counts**and frequency of A2 allele NAFLD vs Control NASH-HCC vs Control
NAFLD Control p-value OR p-value OR
Type 1 Type 2 Type 3 Type 4 NASH-HCC (95%CI) (95%CI)
rs2896019 22q13 PNPLA3 T/G 27/72/
31 31/54/ 49 25/43/ 36 62/200/ 214 6/18/34 2259/ 3790/1621
2.3x10⁻³¹ 1.85 1.8x10⁻⁸ 3.37
(0.52) (0.57) (0.55) (0.66) (0.74) (0.46) (1.67–
2.05)
(2.21– 5.14)
rs1260326 2p23 GCKR C/T 17/65/
48 19/54/ 61 9/47/ 48 72/210/ 194 9/16/33 1461/ 3666/2541
9.6x10⁻¹⁰ 1.38 0.0031 1.84
(0.62) (0.66) (0.68) (0.63) (0.71) (0.57) (1.25–
1.53)
(1.23– 2.75) rs4808199 19p13 GATAD2A G/A 72/43/
15 61/57/ 16 58/36/ 10 208/ 216/52 21/33/4 4132/ 2990/544
2.3x10⁻⁸ 1.37 0.020 1.59
(0.28) (0.33) (0.27) (0.34) (0.35) (0.27) (1.23–
1.53)
(1.08– 2.35)
rs17007417 2p13 DYSF C/T 85/40/
5 99/34/ 1 79/23/ 2 329/ 136/11 25/25/8 5252/ 2207/197
0.47 0.95 5.2x10⁻⁷ 2.74
(0.19) (0.13) (0.13) (0.17) (0.35) (0.17) (0.83–
1.09)
(1.85– 4.06)
SNPs showing the strongest association in each chromosomal region are indicated. *A2 represents the risk allele.
**Genotype counts are shown as (A1A1/A1A2/A2A2).
Odds ratio (OR) with 95% confidence interval (95%CI) was calculated for the risk allele. Thep-values less than the threshold (p= 5.3×10⁻⁷) are in bold text.
rs4808199 inGATAD2A, only the comparison of type 4 and controls showed a significant difference (Fig 3CandS6C Table). Rs17007417 inDYSFwas significantly different in NASH-HCC cases compared with controls or with any of the four Matteoni subgroups (Fig
3DandS6D Table).
Risk estimation of NAFLD using genetic variations
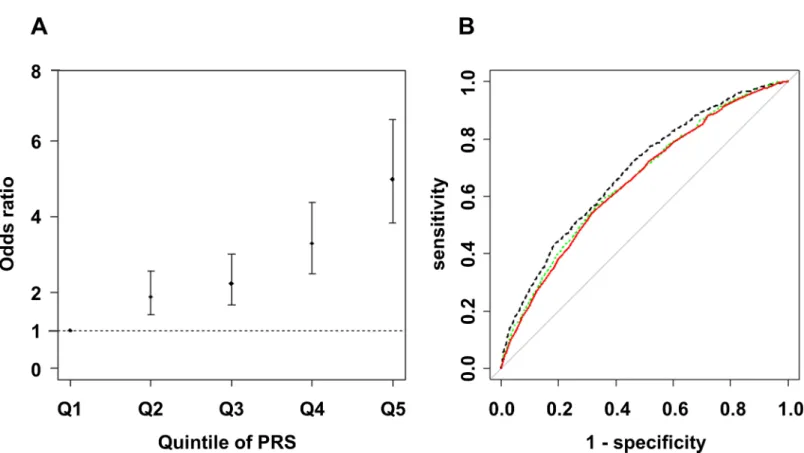
We next assessed the influence of risk alleles associated with NAFLD on the development of NAFLD. We first generated an estimated model by forward stepwise logistic regression using rs2896019 inPNPLA3, rs1260326 inGCKR, rs4808199 inGATAD2A, and rs17007417 in DYSF. Subsequently, rs2896019, rs1260326, and rs4808199 remained in the model. The ORs and 95%CIs compared with the 1st quintile PRS were 1.89 (1.40–2.58), 2.24 (1.68–3.01), 3.30
Fig 2. Regional Manhattan plots around the SNP markers showing genome-wide significance in the GWA studies.P-values, gene organization, and linkage disequilibrium (LD) plots according to the chromosomal position of the three significantly genome-wide associated regions for NAFLD (A-C) and the one region for NASH-HCC (D). Each figure spans 200 kb (A, B, and D) or 300 kb (C) in both the 5’ and 3’ directions from the SNP with the strongest association (shown with a red arrow) in the GWA studies.P-values are plotted for both genotyped and imputed SNPs in the upper panels, and previously reported SNPs with genome-wide significance are indicated by green arrows. The colors of the circles representingp-values correspond to the strength of LD (r2) from the most significant SNP in the GWA studies. The brightness of the red color in the LD plots in the lower panels also corresponds to the strength of LD.
(2.51–4.38), and 5.00 (3.83–6.57) for the 2nd to 5th quintile PRS, respectively (Fig 4A). The area under the curve (AUC) was 0.65 (95% CI = 0.63–0.67). Next, the model was refined by including rs780094, rs738409, and rs58542926 instead of rs2896019, rs1260326, and rs4808199 and including 14 previously reported SNPs for NAFLD (S5 Table). Although rs56225452 in SLC27A5, rs1800234 inPPARRA, rs1799945 inHFE, and rs17883901 inGCLCwere added to the model, the AUC was not improved (AUC = 0.65, 95%CI = 0.64–0.67). To estimate the pos-sible maximum AUC for the current GWA study, we additionally included 10 candidate SNPs for which the p-value was<1x10⁻⁴in our GWA study (S7 Table), and 13 total SNPs remained after the model selection. The AUC was increased to 0.69 (95%CI = 0.66–0.70) (Fig 4B). Risk estimation results for Matteoni type 1 to 3 vs. type 4 or NASH-HCC and for type 4 vs. NASH-HCC are shown in theS2 FigandS8 Table.
Discussion
PNPLA3is the strongest genetic determinant known for the development of NAFLD and
NASH-HCC[6,12].PNPLA3is a membrane protein located on the surface of lipid droplets. Rs738409, the I148M variant ofPNPLA3, decreases triglyceride breakdown, leading to lipid
Fig 3. Histogram of the odds ratios for genotype distributions between different subgroups.Each box denotes the odds ratio (OR) comparing the control or patient subgroups shown on the horizontal axes. Thep-values, ORs, and 95% confidence intervals are shown in theS6 Table.
retention in hepatocyte lipid droplets. The strong association ofPNPLA3with type 4 and NASH-HCC but not with type 1 to type 3 indicates that it is involved in the later stages of NAFLD, particularly in liver fibrosis.
We identifiedGATAD2A, the function of which is not well understood, as a novel sus-ceptibility gene for NAFLD. It is located in an LD block spanningTM6SF2andNCAN, which were previously reported as susceptible genes for NAFLD[12,17]. We also found that rs58542926 inTM6SF2, which had weak LD with rs4808199 inGATAD2A, showed a moderate association with NASH. Similar toPNPLA3, the association ofGATAD2Awas not observed with the type 1 to type 3 subgroups and was stronger with type 4 and NASH-HCC, indicating that it is related to the development of NASH. Rs4808199 inGATAD2Awas previously shown to be strongly associated with the expression ofGATAD2AandMAU2[22]. Furthermore, rs58542926 inTM6SF2and rs4808199 inGATAD2Aare located in the same LD block, and genome-wide significant SNPs were also found inTM6SF2. Since there is accumulating biolog-ical evidence for the association betweenTM6SF2and NAFLD, the association of rs4808199 may be driven by the group of SNPs in high LD, which includes rs58542826. Given that there is no direct evidence that the nonsynonymous variant rs4808199 is causative, it is possible that other genetic variants functionally affectTM6SF2.
GCKRis an inhibitor of glucokinase (GCK), and its hepatic concentration is increased in NAFLD[29,30]. The risk allele of rs780094 inGCKRwas shown to increase liver fat, possibly by increasing the expression ofC2orf16[12]. However, no effect of rs780094 genotypes on C2orf16expression has been observed[22,31]. Rs780094 was also reported to be associated
Fig 4. Risk estimation according to Polygenic Risk Scores for NAFLD patients compared with controls.The dot and bar denote the odds ratio (OR) and its 95% confidence interval in each quintile compared to the 1st quintile using rs2896019 inPNPLA3, rs1260326 inGCKR, and rs4808199 inGATAD2A (A), and the receiver operating characteristic (ROC) curve from the model (red line), and the ROC curves including previously reported SNPs (green dashed line) or candidate SNPs (p<1x10⁻⁴
) identified in our GWA study (black dashed line) (B) are shown.
with the blood C reactive protein (CRP) level[32], but we did not observe this association using a high-sensitive CRP test (p= 0.77 by linear regression). Hence, it is still premature to draw clear conclusions about the mechanisms underlying the biological effects of this disease.
We identified an association peak at chromosome 2p13.3 in the GWA study using the NASH-HCC cases (Figs1Band2D). This SNP, rs17007417, was located 125-kb downstream ofDYSFand was in an LD block encompassing a ‘gene desert’.DYSFis reported to be the caus-ative gene for monogenic muscular disorders, such as muscular dystrophy, limb-girdle, type 2b, and Miyoshi muscular dystrophy 1. However, there is no report showingDYSFto be sus-ceptible for multigenic diseases, including liver-related disorders. We also did not find an effect of rs17007417 on any gene expressions[22]. In addition, a limited number of NASH-HCC DNAs (58 samples) were included in the study due to the small number of biopsy-proven NASH-HCC patients, and this result was not validated using an independent sample set. Therefore, the involvement of rs17007417 in NASH-HCC still needs further investigation.
Rs641738 inTMC4located nearMBOAT7on chromosome 19 did not show association with NAFLD and NASH-HCC in our Japanese study (S5 Table). While the association of rs641738 in patients of European descent was initially reported in 2015[19], the association has not been replicated in any other population to date. This may be due to the difference in LD patterns of the populations. According to the varLD[33], LD pattern between CEU and JPT population was significantly different within theMBOAT7(p<0.001) andTMC4(p= 0.002, p-values were calculated using 1000 genome phase3 dataset) regions. In addition, there are no large LD blocks in this region, so we could only successfully impute the SNP genotypes located near the genotyped SNPs (S3 Fig). These data suggest that rs641738 is not the causal variant, and in the European population the actual causal variant may lie close to and show high LD with rs641738. To confirm this hypothesis, a very dense genotyping or target sequenc-ing in this region is necessary.
Risk estimation by PRS using the identified genome-wide significant SNPs for NAFLD clearly showed that the effect of the risk alleles, namelyPNPLA3,GATAD2A, andGCKRwas cumulative and increased the risk for NAFLD. Clinical and lifestyle information obtained from a prospective study might further improve this model.
The general population used as the control in this study could potentially include NAFLD patients. In addition, according to the 1000 Genomes Project phase 3 dataset[26], only 42.3% of the common SNPs in the Japanese population are tagged by the SNPs used in the current study with r2>0.5. These issues can lower the statistical power of the study and elicit false-neg-ative results. In addition, even though almost all of the patient samples and all of the control samples were collected on Honshu island in Japan, some population stratification was
observed, and none of our results were replicated in an independent cohort. Further confirma-tion of our findings is needed to draw conclusions with higher confidence.
The present study clearly demonstrated that genetic background exerted a marked influ-ence on the severity of liver fibrosis and the development of NASH-HCC. We believe that the risk estimation using genetic markers will improve the accuracy of NAFLD diagnoses and help to guide treatment strategy decisions for patients.
Supporting information
S1 Text. SNP genotyping and quality controls. (DOCX)
S2 Table.P-values of association studies comparing Types 1–3 with controls and compar-ing Type 4 and NASH-HCC with controls for the significantly associated SNPs identified in the GWA studies.
(DOCX)
S3 Table. List of the SNP markers showingp-values less than 1.0x10⁻⁵in patient cases com-pared to general-population controls in the GWA studies.
(DOCX)
S4 Table.P-values and odds ratios of association for Brunt grade, Brunt stage, and fat-droplet content for the significantly associated SNPs identified in the GWA studies. (DOCX)
S5 Table.P-values and odds ratios of the association studies for previously reported NAFLD associated SNPs.
(DOCX)
S6 Table.P-values and odds ratios for the genotype distribution between different sub-groups.
(DOCX)
S7 Table. List of the SNP markers showing the lowestp-value withp<1.0x10⁻⁴within each candidate locus identified in the GWA studies.
(DOCX)
S8 Table. Risk estimation according to Polygenic Risk Scores for NASH and NASH-HCC patients.
(DOCX)
S1 Fig. Manhattan plots for Brunt grade, Brunt stage, and fat-droplet content. (PPTX)
S2 Fig. Risk estimation according to Polygenic Risk Scores for NASH and NASH-HCC patients.
(PPTX)
S3 Fig. Regional plots around the rs641738 in the study of all NAFLD patients compared to controls.
(PPTX)
Acknowledgments
The authors thank Yutaka Kohgo, Hirofumi Uto, Tetsuo Takehara, and the Nagahama Pro-spective Cohort for Comprehensive Human Bioscience (the Nagahama Study) for sample col-lection and Miki Kokubo for performing the experiments.
Author Contributions
Conceptualization:Fumihiko Matsuda, Takeshi Okanoue.
Formal analysis:Takahisa Kawaguchi.
Funding acquisition:Fumihiko Matsuda, Takeshi Okanoue.
Investigation:Takeshi Okanoue.
Methodology:Takahisa Kawaguchi, Ryo Yamada.
Project administration:Fumihiko Matsuda, Takeshi Okanoue.
Resources:Toshihide Shima, Masayuki Mizuno, Yasuhide Mitsumoto, Atsushi Umemura, Yoshihiro Kanbara, Saiyu Tanaka, Yoshio Sumida, Kohichiro Yasui, Keitaro Matsuo, Yoshito Itoh, Katsutoshi Tokushige, Etsuko Hashimoto, Kendo Kiyosawa, Masanori Kawa-guchi, Hiroyuki Itoh, Hirofumi Uto, Yasuji Komorizono, Ken Shirabe, Shiro Takami, Toshinari Takamura, Miwa Kawanaka, Takeshi Okanoue.
Software:Takahisa Kawaguchi, Ryo Yamada.
Supervision:Fumihiko Matsuda, Takeshi Okanoue.
Validation:Fumihiko Matsuda, Takeshi Okanoue.
Visualization:Takahisa Kawaguchi.
Writing – original draft:Takahisa Kawaguchi, Fumihiko Matsuda, Takeshi Okanoue.
Writing – review & editing:Takahisa Kawaguchi, Meiko Takahashi, Fumihiko Matsuda, Takeshi Okanoue.
References
1. Matteoni CA, Younossi ZM, Gramlich T, Boparai N, Liu YC, McCullough AJ. Nonalcoholic fatty liver dis-ease: a spectrum of clinical and pathological severity. Gastroenterology. 1999; 116: 1413–1419. PMID: 10348825
2. Younossi ZM, Koenig AB, Abdelatif D, Fazel Y, Henry L, Wymer M. Global epidemiology of nonalcoholic fatty liver disease—Meta-analytic assessment of prevalence, incidence, and outcomes. Hepatology. 2016; 64: 73–84.https://doi.org/10.1002/hep.28431PMID:26707365
3. McPherson S, Hardy T, Henderson E, Burt AD, Day CP, Anstee QM. Evidence of NAFLD progression from steatosis to fibrosing-steatohepatitis using paired biopsies: Implications for prognosis and clinical management. J Hepatol. 2015; 62: 1148–1155.https://doi.org/10.1016/j.jhep.2014.11.034PMID: 25477264
4. Bugianesi E, Leone N, Vanni E, Marchesini G, Brunello F, Carucci P, et al. Expanding the natural history of nonalcoholic steatohepatitis: From cryptogenic cirrhosis to hepatocellular carcinoma. Gastroenterol-ogy. 2002; 123: 134–140.https://doi.org/10.1053/gast.2002.34168PMID:12105842
5. Adams LA, Lymp JF, St. Sauver J, Sanderson SO, Lindor KD, Feldstein A, et al. The Natural History of Nonalcoholic Fatty Liver Disease: A Population-Based Cohort Study. Gastroenterology. 2005; 129: 113–121.https://doi.org/10.1053/j.gastro.2005.04.014PMID:16012941
6. Liu Y-L, Patman GL, Leathart JBS, Piguet A-C, Burt AD, Dufour J-F, et al. Carriage of the PNPLA3 rs738409 C>G polymorphism confers an increased risk of non-alcoholic fatty liver disease associated hepatocellular carcinoma. J Hepatol. 2014; 61: 75–81.https://doi.org/10.1016/j.jhep.2014.02.030 PMID:24607626
7. Yasui K, Hashimoto E, Komorizono Y, Koike K, Arii S, Imai Y, et al. Characteristics of patients with non-alcoholic steatohepatitis who develop hepatocellular carcinoma. Clin Gastroenterol Hepatol Off Clin Pract J Am Gastroenterol Assoc. 2011; 9: 428–433; quiz e50.https://doi.org/10.1016/j.cgh.2011.01. 023PMID:21320639
8. Younossi ZM, Stepanova M, Rafiq N, Makhlouf H, Younoszai Z, Agrawal R, et al. Pathologic criteria for nonalcoholic steatohepatitis: Interprotocol agreement and ability to predict liver-related mortality. Hepa-tology. 2011; 53: 1874–1882.https://doi.org/10.1002/hep.24268PMID:21360720
10. Romeo S, Kozlitina J, Xing C, Pertsemlidis A, Cox D, Pennacchio LA, et al. Genetic variation in PNPLA3 confers susceptibility to nonalcoholic fatty liver disease. Nat Genet. 2008; 40: 1461–1465. https://doi.org/10.1038/ng.257PMID:18820647
11. Sookoian S, Pirola CJ. Meta-analysis of the influence of I148M variant of patatin-like phospholipase domain containing 3 gene (PNPLA3) on the susceptibility and histological severity of nonalcoholic fatty liver disease. Hepatol Baltim Md. 2011; 53: 1883–1894.https://doi.org/10.1002/hep.24283PMID: 21381068
12. Speliotes EK, Yerges-Armstrong LM, Wu J, Hernaez R, Kim LJ, Palmer CD, et al. Genome-wide associ-ation analysis identifies variants associated with nonalcoholic fatty liver disease that have distinct effects on metabolic traits. PLoS Genet. 2011; 7: e1001324.https://doi.org/10.1371/journal.pgen. 1001324PMID:21423719
13. Zain SM, Mohamed R, Mahadeva S, Cheah PL, Rampal S, Basu RC, et al. A multi-ethnic study of a PNPLA3 gene variant and its association with disease severity in non-alcoholic fatty liver disease. Hum Genet. 2012; 131: 1145–1152.https://doi.org/10.1007/s00439-012-1141-yPMID:22258181
14. Petta S, Grimaudo S, CammàC, Cabibi D, Di Marco V, Licata G, et al. IL28B and PNPLA3 polymor-phisms affect histological liver damage in patients with non-alcoholic fatty liver disease. J Hepatol. 2012; 56: 1356–1362.https://doi.org/10.1016/j.jhep.2012.01.007PMID:22314430
15. Valenti L, Dongiovanni P, Ginanni Corradini S, Burza MA, Romeo S. PNPLA3 I148M variant and hepa-tocellular carcinoma: A common genetic variant for a rare disease. Dig Liver Dis Off J Ital Soc Gastroen-terol Ital Assoc Study Liver. 2013;https://doi.org/10.1016/j.dld.2012.12.006PMID:23333103
16. Ueyama M, Nishida N, Korenaga M, Korenaga K, Kumagai E, Yanai H, et al. The impact of PNPLA3 and JAZF1 on hepatocellular carcinoma in non-viral hepatitis patients with type 2 diabetes mellitus. J Gastroenterol. 2015; 51: 370–379.https://doi.org/10.1007/s00535-015-1116-6PMID:26337813
17. Kozlitina J, Smagris E, Stender S, Nordestgaard BG, Zhou HH, Tybjærg-Hansen A, et al. Exome-wide association study identifies a TM6SF2 variant that confers susceptibility to nonalcoholic fatty liver dis-ease. Nat Genet. 2014; 46: 352–356.https://doi.org/10.1038/ng.2901PMID:24531328
18. Sookoian S, Castaño GO, Scian R, Mallardi P, Ferna´ndez Gianotti T, Burgueño AL, et al. Genetic
varia-tion in transmembrane 6 superfamily member 2 and the risk of nonalcoholic fatty liver disease and histo-logical disease severity. Hepatology. 2015; 61: 515–525.https://doi.org/10.1002/hep.27556PMID: 25302781
19. Buch S, Stickel F, Tre´po E, Way M, Herrmann A, Nischalke HD, et al. A genome-wide association study confirms PNPLA3 and identifies TM6SF2 and MBOAT7 as risk loci for alcohol-related cirrhosis. Nat Genet. 2015; 47: 1443–1448.https://doi.org/10.1038/ng.3417PMID:26482880
20. Mancina RM, Dongiovanni P, Petta S, Pingitore P, Meroni M, Rametta R, et al. The MBOAT7-TMC4 Variant rs641738 Increases Risk of Nonalcoholic Fatty Liver Disease in Individuals of European Descent. Gastroenterology. 2016; 150: 1219–1230.e6.https://doi.org/10.1053/j.gastro.2016.01.032 PMID:26850495
21. Kawaguchi T, Sumida Y, Umemura A, Matsuo K, Takahashi M, Takamura T, et al. Genetic polymor-phisms of the human PNPLA3 gene are strongly associated with severity of non-alcoholic fatty liver dis-ease in Japanese. PloS One. 2012; 7: e38322.https://doi.org/10.1371/journal.pone.0038322PMID: 22719876
22. Higasa K, Miyake N, Yoshimura J, Okamura K, Niihori T, Saitsu H, et al. Human genetic variation data-base, a reference database of genetic variations in the Japanese population. J Hum Genet. 2016; https://doi.org/10.1038/jhg.2016.12PMID:26911352
23. Devlin B, Roeder K. Genomic control for association studies. Biometrics. 1999; 55: 997–1004. PMID: 11315092
24. Yang J, Lee SH, Goddard ME, Visscher PM. GCTA: A Tool for Genome-wide Complex Trait Analysis. Am J Hum Genet. 2011; 88: 76–82.https://doi.org/10.1016/j.ajhg.2010.11.011PMID:21167468
25. Li Y, Willer C, Sanna S, Abecasis G. Genotype imputation. Annu Rev Genomics Hum Genet. 2009; 10: 387–406.https://doi.org/10.1146/annurev.genom.9.081307.164242PMID:19715440
26. Consortium T 1000 GP. An integrated map of genetic variation from 1,092 human genomes. Nature. 2012; 491: 56–65.https://doi.org/10.1038/nature11632PMID:23128226
27. Purcell S, Neale B, Todd-Brown K, Thomas L, Ferreira MAR, Bender D, et al. PLINK: a tool set for whole-genome association and population-based linkage analyses. Am J Hum Genet. 2007; 81: 559– 575.https://doi.org/10.1086/519795PMID:17701901
29. Peter A, Stefan N, Cegan A, Walenta M, Wagner S, Ko¨nigsrainer A, et al. Hepatic glucokinase expres-sion is associated with lipogenesis and fatty liver in humans. J Clin Endocrinol Metab. 2011; 96: E1126– 1130.https://doi.org/10.1210/jc.2010-2017PMID:21490074
30. Bechmann LP, Gastaldelli A, Vetter D, Patman GL, Pascoe L, Hannivoort RA, et al. Glucokinase links Kru¨ppel-like factor 6 to the regulation of hepatic insulin sensitivity in nonalcoholic fatty liver disease. Hepatol Baltim Md. 2012; 55: 1083–1093.https://doi.org/10.1002/hep.24793PMID:22095588
31. Schadt EE, Molony C, Chudin E, Hao K, Yang X, Lum PY, et al. Mapping the Genetic Architecture of Gene Expression in Human Liver. PLOS Biol. 2008; 6: e107.https://doi.org/10.1371/journal.pbio. 0060107PMID:18462017
32. Yang Z, Wen J, Tao X, Lu B, Du Y, Wang M, et al. Genetic variation in the GCKR gene is associated with non-alcoholic fatty liver disease in Chinese people. Mol Biol Rep. 2010; 38: 1145–1150.https://doi. org/10.1007/s11033-010-0212-1PMID:20625834