A Raman Spectroscopic and Chemometric Study of
the Cellular State Changes during Cell
Differentiation
著者(英)
Sota Takanezawa
学位名
博士(理学)
学位授与機関
関西学院大学
学位授与番号
34504甲第560号
URL
http://hdl.handle.net/10236/13856
A Raman Spectroscopic and Chemometric
Study of the Cellular State Changes during
Cell Differentiation
A Thesis for the Degree
of
Doctor of Science
Submitted to
School of Science & Technology
Kwansei-Gakuin University
By
Sota TAKANEZAWA
i
Contents
List of abbreviation
... 1General introduction
... 31.Scope and background of this thesis... 3
2.Originality, novelty, and impact of this thesis ... 5
3.Cell fate decision in MCF-7 cell ... 7
4.Raman spectroscopy ... 8
4.1. History of Raman spectroscopy in biology and medicine ... 8
4.2. Resonance Raman spectra ... 14
5.Spectral analysis ... 15
5.1. Principal component analysis (PCA) ... 15
5.2. Generalized two-dimensional correlation spectroscopy (G2DCOS) ... 17
6.Abstract of each chapter... 19
References ... 23
Chapter 1: Raman and autofluorescence spectrum dynamics along the
HRG-induced differentiation pathway of MCF-7 Cells
... 33Abstract ... 34
1.Introduction ... 35
2.Materials and methods ... 37
2.1. Cell culture and sample preparation ... 37
ii
2.3. Data analysis ... 39
3.Results ... 40
3.1. Measurement of the Raman and autofluorescence spectra along the differentiation pathway of MCF-7 cells ... 40
3.2. Changes in the chemical components detected from Raman spectra ... 41
3.3. Principal component analysis of the Raman spectra... 42
3.4. Cell differentiation dynamics described in the Raman spectrum phase space . 42 3.5. Analysis using the entire information from single cell spectra ... 44
4.Discussion ... 45
References ... 49
Chapter 2: Raman spectrum dynamics of single cells in the early stages
of growth factor stimulation
... 67Abstract ... 68
1.Introduction ... 69
2.Materials and methods ... 71
2.1. Cell culture and sample preparation ... 71
2.2. Raman micro-spectroscopy ... 72
2.3. Data processing and spectral analysis ... 73
3.Results ... 75
3.1. Changes in Raman spectra at the early stages of growth factor stimulations .. 75
3.2. Principal component analysis of cellular chemical compositions ... 76
3.3. Single-cell dynamics of the chemical composition in response to the growth factors ... 77
iii
3.4. Grouping the single-cell chemical compositions in the PC1 and PC2 plane ... 79
3.5. Time-evolution of the cellular states upon stimulation with growth factors .... 80
3.6. Dynamics of single cells immediately after stimulation with growth factors .. 82
4.Discussion ... 82
References ... 88
Chapter 3: Two-dimensional Raman correlation analysis of diseased
esophagus in a rat
... 106Abstract ... 107
1.Introduction ... 108
2.Materials and methods ... 109
3.Results and discussion ... 112
4.Conclusion ... 115
References ... 116
Chapter 4: Raman spectroscopic analysis of H
2O
2-stimulated
three-dimensional human skin models containing Asian, Black,
Caucasian Melanocytes
... 122Abstract ... 123
1.Introduction ... 124
2.Experimental ... 125
3.Results and discussion ... 127
4.Conclusion ... 131
iv
Acknowledgements
... 1401
List of abbreviation
AT I Alveolar type I
AT II Alveolar type II
BCC Basal carcinoma cell
CCD Charge-couple device
CM Cardiomyocyte
EGF Epidermal growth factor
EGFR Epidermal growth factor receptor
ERK Extracellular signal-regulated kinase
ESC Embryonic stem cell
G2DCOS Generalized two-dimensional correlation spectroscopy
HER Human epidermal growth factor receptor
HRG Heregulin
iPSC Induced pluripotent stem cell
LDA Linear discriminant analysis
MAPK Mitogen-activated protein kinase
MS Mass spectroscopy
MSC Mesenchymal stem cell
NGF Nerve growth factor
NMR Nuclear magnetic resonance
NRG Neuregulin
OB Osteoblast
PCA Principal component analysis
2
3
General introduction
1. Scope and background of this thesis
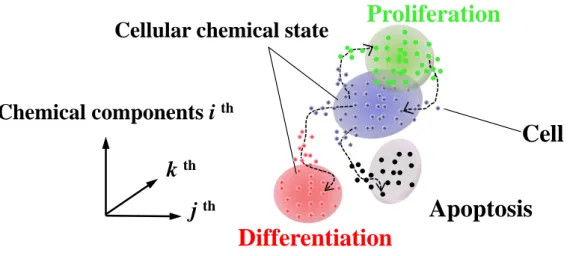
The aim of this thesis is to show that comprehensive chemical information, which is obtained by Raman micro-spectroscopy of single living cells, provides pathways on cell fate decisions in multidimensional chemical phase space (Fig. 1). In Chapter 1, Raman microscopic analysis shows the pathway of the cell differentiation process in a cell population during 12 days in the cellular chemical phase space. In Chapter 2, by Raman micro-spectroscopy, cellular chemical dynamics and chemical states were detected during the early stage of differentiation and proliferation processes. In Chapters 3 and 4, as groundwork studies for detecting the cellular dynamics, Raman analysis of biological samples, including those of the diseased rat esophagus and of human skin models with pigmentation upon H2O2 stimulation, was conducted.
Cell fate decision is important in development processes such as tissue formation and homeostasis. Apoptosis is necessary for the development of digits in the development process.1,2 Differentiation and proliferation are also required for tissue formation and for maintaining homeostasis.3 Cell fate decisions are guided by various external signals such as external cellular signals as well as internal cues. In addition, cellular fate decision is affected by cell–cell interactions and the cellular environment. As an example of a cellular external signal affecting cell fate decision, neuron growth factor (NGF) induces cellular differentiation through a cellular signaling pathway in PC12 cells.4, 5 In addition, in the breast cancer cell line MCF-7, the HER2 antibody, which binds to the membrane receptor ErbB2, induces differentiation.6 Proliferation of both PC12 and MCF-7 is induced by epidermal growth factor (EGF).7, 8 Cell–cell interaction affects the cell fate decision; the Notch signaling pathway is well known in
4
the development process.9, 10 With regard to cellular internal cues, the cell cycle also affects the cell fate decision. The differentiation of the endoderm, mesoderm, and neuroectoderm in human embryonic stem cells (hESCs) is strongly associated with the cell cycle.11 The microenvironment, e.g., substrate stiffness, also affects the cell fate decision in case of stem cells.12
On the other hand, an important point in cellular process is that cellular responses to external cues are fluctuated even in clonal cells. For example, when genetically homogenous Escherichia coli cells were exposed to the antibiotic ampicillin, a small fraction of cells survived and divided after the removal of ampicillin, whereas most cells were killed.13 Similarly, in case of the cell fate decision of PC12 exposed to the same external factors in a same culture medium, cell fate of individual cells were fluctuated.14 Such stochastic-like responses could be caused by a difference in the intracellular chemical state. These cellular states can be investigated by enumerative analysis technologies such as mass spectroscopy (MS)15-18 and nuclear magnetic resonance spectroscopy (NMR)15, 19. These technologies provide extensive information on the intracellular chemical composition. However, the information is provided for the entire cell population, and information on a single living cell cannot be obtained. Although most fluorescence imaging techniques are undoubtedly useful for detecting the cellular chemical state in the single cell,20 these techniques are not sufficient for detecting multi-dimensional molecular information and require prior knowledge to be applicable to the cell. Therefore, to trace the individual cellular chemical state of a cell population and a single cell, an optical non-invasive technique not requiring complex sample preparation is required.
5
and rotational information on molecules. Raman scattering light is derived from inelastic scattering of light caused by the interaction between molecular vibration and the incident light. Raman analysis of single cells and chromosomes by Raman micro-spectroscopy was first reported in 1990,21 and this technique has been widely used for detecting the chemical composition in biological samples since then. In the past two decades, Raman studies have succeeded in the detection and discrimination of changes in biological molecules in cells and tissues. At the tissue level, Raman spectroscopy was used for discriminating breast cancer from normal tissue,22, 23 endoscopic Raman spectroscopy was used for detecting in vivo esophageal cancer,24 and Raman imaging was used for differentiating cancerous skin from normal skin.25 At the single cell level, Raman spectroscopy was used to distinguish differentiate cancerous cells from normal cells26 and to detect the difference between primary cells and their derived differentiated cells, 27 while Raman imaging was used to determine the difference between hESC and hESC-cardiomyocytes (CMs).28 These studies are supporting evidence that Raman spectroscopy can detect the chemical changes in a single cell and provide in vivo information on the cellular status during cell differentiation and proliferation.
2. Originality, novelty, and impact of this thesis
Raman spectroscopy, which non-invasively provides information on multi-dimensional molecular entities, has been utilized in this thesis to visualize the chemical dynamics in single living cells and cell populations during cell differentiation and proliferation. Using chemometrics, information about important and hidden differences in cells was obtained from the Raman spectra. Most previous Raman cell studies had focused on the
6
discrimination and assessments in two- or three-cell conditions.26-33 Although several studies have investigated chemical changes in a single cell over time, only in time-series imaging data of a few cells were discussed.34-36 On the other hands, enumerative analyses of genes and proteins have identified mechanisms and marker molecules in cell fate decision at the cell population level. Marker molecules are useful for detecting the cellular state during differentiation; however, marker molecules do not allow the identification of the cellular chemical states in a cell before the change has occurred. In addition, it is impossible to detect differences in cell states affected by other factors.
The notable insights in this thesis are described as follows:
(1) By Raman micro-spectroscopy, the circular and oscillating dynamics of the chemical composition of a cell population during growth factor-induced differentiation are described. Cell differentiation process of the cell population was visualized by the multicomponent phase space on the basis of the Raman spectra and auto-fluorescence spectra. The results show that differentiation is not a monotonous chemical change in the cell population. In addition, the results showed that Raman analysis of a single cell can detect the cell dynamics of chemical compositions during cell fate decision.
(2) By tracing the chemical dynamics in a single cell during the early stages of differentiation and proliferation by Raman micro-spectroscopy, the time-evolution of cellular chemical states was detected and visualized. Despite similar cellular signaling pathways used for differentiation and proliferation, the dynamics of the chemical state are critically different between differentiation and proliferation process. These results showed that Raman micro-spectroscopy is a powerful tool for detecting these dynamics inside a single cell and for showing cell fate decision pathways.
7
cells before and during cell differentiation in the absence of any labeling, with non-destructive. Furthermore, the cellular chemical information and its dynamics were visualized, demonstrating for the first time that individual cells and a cell population use complex pathways during differentiation in the multivariate chemical space.
The Raman measurement of comprehensive chemical dynamics of either a single living cell or a cell population provides new insights during the cell fate decision processes. These new insights suggest that global chemical information and its dynamics in single cells by Raman spectroscopy can provide a new strategy for exploring the cell fate decision mechanism at the single cell level and that Raman micro-spectroscopy could be used as a prospective technique for predicting models of cell fate decision.
3. Cell fate decision in MCF-7 cell
The breast cancer cell line MCF-7 was used as a model system for cell fate decisions in this thesis. Whereas EGF stimulation induces the proliferation of MCF-7 cells, heregulin (HRG/NRG1) induces their differentiation.37 MCF-7 has previously been induced to differentiate express oil droplets composed of milk components (lipids and casein).6
MCF-7 cells express various ErbB protein-tyrosine kinase receptors (EGFR/ErbB1/HER1, ErbB2/HER2, ErbB3/HER3, and ErbB4/HER4) on the cell membrane. While EGF is the cognate ligand of EGFR and HRG/NRG1 is the cognate ligand of ErbB3 and ErbB4, no EGF family peptide binds to ErbB2. The dimerization of ErbB receptors triggers the activation of cellular pathways via their cytoplasmic tail domains.38 EGFR/HER1 activation induces the recruitment of Ras to the plasma
8
membrane, followed by the activation of the mitogen-activated protein kinase (MAPK/ERK) signaling pathway inside the cell. Similarly, ErbB3/HER3 and Erb4/HER4 activation induces the phosphatidyl-inositol-3-kinase (PI3K) signaling pathway.39 Although Ras-MAPK/ERK and PI3K signaling pathways are activated by ErbB receptors, these signaling pathways can negatively regulate each other.40 The mechanism of cell fate decision was investigated inside MCF-7 cells.37,41,42 EGF and HRG induce transient and sustained ERK activation, respectively. Although ERK activation induces the expression of the cell differentiation gene c-fos, c-fos protein is only activated by sustained ERK activation. Sustained ERK activation will trigger cell differentiation via the activation of c-fos protein, while transient ERK activation will not.
Several genes and proteins have been investigated in the MCF-7 cell population to identify which are involved in cell fate decision. However, these marker molecules of cell fate decision can only detect the cellular state once molecular changes have occurred. In addition, the cellular responses to external factors differ in each cell. In this thesis, measuring the comprehensive chemical information of a single living cell by Raman spectroscopy allowed us to investigate the cellular chemical states before and during cell differentiation, without labeling marker molecules. By tracing the cellular chemical dynamics, cell differentiation pathways were investigated and the transition rules were explored at the single cell level using comprehensive chemical information.
4. Raman spectroscopy
4.1. History of Raman spectroscopy in biology and medicine
9
1928. Gradually, improvement of the Raman instrumentation has been performed. Various light sources for Raman spectroscopy have been developed. In 1930s, mercury lamps were used for light excitation.43 In 1962, laser was applied for Raman spectroscopy.44 Simultaneously, detection systems such as charge-coupled devices (CCDs) were developed for Raman spectroscopy. These advances led to the development of various Raman techniques such as Raman micro-spectroscopy,45 Fourier-transform Raman spectroscopy,46 and endoscopic-Raman spectroscopy.47 Raman spectroscopy is an optical technique based on the inelastic scattering between molecular vibration and light, and it provides information about molecular vibration and rotation. Because the technique is non-invasive and represents a non-labeling analytical method, Raman spectroscopy has been applied to analyze biological samples.
In 1970–80s, in pioneering studies in the fields of biology and medicine, biological pure molecules were investigated by Raman spectroscopy. Biological molecules, including proteins, nucleic acids, lipids (lipid bilayer), and carbohydrates, were investigated.48,49 The secondary structure of proteins was investigated at the level of peptidic bonds, amino acid vibration mode, and the thermal denaturation process of protein structures, leading to the in situ detection of the secondary structure of proteins in the eye lens.48 In the same period, the heme group containing proteins, hemoglobin, and cytochrome c was investigated in a resonance Raman study. Both studies are now considered as pioneers in the field of biological chemistry.48,49 The study of resonance Raman spectroscopy was extended to natural chromophore molecules, including vitamin B, chlorophyll, carotenoid, and rhodopsin.48, 49 On the basis of these studies, Raman spectroscopy has been applied to increasingly complex biological samples such as cells and tissues.
10
In 1990, one of the first studies of Raman microscopic analysis reported the measurement of a high spatial resolution (approximately 1 µm3) in the cell.21 The technology was extended to other cell types and tissues, including cancer cells, primary cells, stem cells, and organs. At the tissue levels, Raman micro-spectroscopy allows the detection of chemical changes in the tissue without labeling and in a non-destructive manner. In 1998, P. J. Casper et al. and G. J. Puppels detected the Raman spectra of in vivo and in vitro human skin layers.50 In addition, they reported the in vivo depth profiles of skin chemicals and water concentrations in 2001.51 In the mid-2000s, Raman micro-spectroscopy was proposed as a new technique for rapid and non-invasive optical diagnosis, and it was rapidly applied to biopsy samples from patients. The technology allows to differentiate breast cancer from normal tissues ex vivo.22, 23 Using a combination of Raman imaging and fluorescence imaging of collagen and tryptophan, K. Kong et al. diagnosed basal cell carcinoma (BCC) using biopsy samples in 2013.25 Although Raman micro-spectroscopy has been successfully used for tissue discrimination ex vivo, the technology faces a major spatial limitation to be used as a diagnosis tool in vivo in clinical medicine. In 2000, E. B. Hanlon et al. and M. S. Feld first prospected in vivo Raman spectroscopy combined with optical fibers.52 In 2004, J. T. Motz et al. and M. S. Feld presented a Raman optical probe optimized to collect a good Raman to noise signal from a tissue sample during an exposure time of 1 s with a 830 nm excitation diode laser.47 Optical fiber probes have been developed and improved since mid-2000s. Y. Komachi et al. and H. Sato developed a micro-Raman probe (diameter 600 µm) with low fiber-optical Raman background.53
In addition, T. Katagiri et al. and H. Sato developed a high axial resolution hollow fiber Raman probe for endoscopy.54 In the application study, Y. Hattori et al. and H. Sato reported the findings
11
of their in vivo endoscopic Raman analysis: the Raman signals of the esophagus of a living rat were detected using an endoscope and a micro-Raman probe in 2007.55 Fiber Raman spectroscopy was used by A. S. Haka et al. and M. S. Feld in 2009 to differentiate in vitro breast cancer from normal tissue in biopsy samples.56 In vivo, human esophageal cancer was separated from normal tissues by M. S. Bergholt et al. in 2011.24 These Raman analyses were successful because of the development of both optical techniques and powerful spectral analysis, leading to the ability to extract important information from tissues composed of complicated chemical mixtures.
In the 2000s, Raman analysis performed on single cells confirmed that this technology can be used in the discrimination of cellular types and various cell states. I. Notingher et al. identified three bone cell phenotypes derived from MG63 cells on the basis of principal component analysis (PCA) and linear discriminant analysis (LDA) in 2004.29 By PCA/LDA analysis and Raman spectroscopy, P. Crow et al. separated four breast cancer cell lines 26, while Y. Oshima et al. differentiated normal cells from cancer cells.30 In lung primary cells, R. J. Swain et al. revealed Raman spectral changes because of the difference in cellular lipids during the differentiation from alveolar type II (AT II) to alveolar type I (AT I) cells.27 They discussed whether cancer cell lines are useful as a primary cell model on the basis of the results of Raman analysis.31 These studies showed that Raman micro-spectroscopy enables the detection of the chemical composition of different cell types.
Assessing specific cellular processes constitutes an important aspect of Raman studies; the processes studied include organelle function, proliferation, differentiation, and apoptosis. In 1998, Y. Takai et al. reported a difference in the degree of unsaturation lipids between cytoplasmic isolated minor granules and clustered major granules of
12
interleukin-2 activated killer T cells. The large difference in lipid unsaturation between the granule and plasma membrane may be relevant to the role of granulous lipid in packaging cytotoxic proteins inside the granule and preventing them from attacking the killer lymphocyte itself.57 In the early 2010s, apoptosis caused by doxorubicin58 and cisplatin59 was investigated by Raman micro-spectroscopy. Two studies showed that changes were observed in the signal intensity of nucleic acids and proteins depending on the concentration of drugs and exposure time. Studies of cell cycle have been conducted by Raman micro-spectroscopy. In 2005, Y. S. Huang et al. reported Raman spectral changes during the cell cycle of fission yeast cells.60 In 2008, R. J. Swain et al. showed that Raman spectra differ among cells in G0/G1, S, and G2/M phases.32 These studies showed that the chemical changes during cellular processes can be detected and assessed by Raman spectroscopy.
With the development of Raman mapping and imaging, chemical changes and localization with time have been investigated. A. Zoladek et al. reported a time-course of Raman imaging during the apoptosis process of human breast cancer cells in 2011. Raman imaging detected the increase in DNA (788 cm−1) intensity in the nucleus and the increase in lipids in apoptotic cells in comparison with those in control cells.34 In 2011, C. K. Huang et al. performed time-course Raman imaging of the yeast cell cycle and found biochemical differences depending on the cell cycle stage.35 During the cell division, the intensity of proteins continuously increases, whereas the intensity of lipids decreases. In the subsequent interphase, both phospholipids and proteins increase. Raman imaging enables us to visualize the dynamic chemical distribution during cell processes and to distinguish the chemical changes between the nucleus and cytoplasm.
13
Raman spectroscopy was used to assess the cellular processes in these particular cells. In 2004, I. Notingher et al. used hierarchical cluster analysis and PCA to study the difference between murine ESC cells and their spontaneously differentiated cells.29 In 2009, E. Gentleman et al. used Raman micro-spectroscopy to assess various types of susceptible cells to represent a new cellular resource for bone regenerative medicine. They compared mineralized nodules from murine ESCs, osteoblasts (OBs), and mesenchymal stem cells (MSCs) by Raman spectroscopy, the nano-indentation test, and transmission electron spectroscopy. OB- and MSC-derived mineralized nodules were similar to the native bone in their content and structure, while mESC-derived nodules were similar to the older bone in their chemical composition.61 hESCs, hESC-CMs, and human fetal left ventricular CMs were separated by PCA/LDA in 2009.33 In 2011, F. C. Pascut et al. studied hESCs and their derived hESC-CMs by Raman imaging and multivariate analysis.28 They identified marker bands specific to either hESCs or hESC-CMs. Then, they monitored the cardiac differentiation process of hESCs on the basis of the marker bands in 2013.62 By Raman imaging and PCA, A. Ghita et al. differentiated neural stem cells from their derived glial cells on the basis of cytoplasmic RNA bands (813 cm−1) in 2012.63
As presented in this history of Raman analysis of the cell, Raman spectroscopic detection and assessments of cell process have been succeeded by extracting information from spectral analysis and visualizing the chemical distribution in a single cell. However, most studies are only focused on analysis of two or three cellular conditions (phenotypes). In the previous Raman analysis of cellular processes, intermediate conditions and sequential changes in cellular chemicals were not considered. In this thesis, by Raman micro-spectroscopy, the dynamics of the cellular
14
chemicals were investigated in detail. In Chapter 1, the dynamics of the differentiation of the MCF-7 cell population is described in the phase space. In Chapter 2, single cell dynamics during the early stages of differentiation and proliferation are shown in the PCA space.
4.2. Resonance Raman spectra
A resonance Raman effect is caused when a sample is irradiated by light whose energy corresponds to the electronic transition energy of a particular chromophore group in the sample. Resonance Raman intensity is enhanced 103 to 105 times against non-resonant Raman scattering. This feature is useful to identify the vibration mode and specific molecules of low concentration.49
Theoretically, the intensity of Raman bands observed from the vibrational ground state m to the excited state n is given as follows:
𝐼𝑚𝑚= 16𝜋 4(𝜈
0− 𝜈)4
𝑐4 (𝑎𝜌𝜌)2𝐼0. (1)
Here, I0is the strength of the irradiating light, ν0 is the frequency, and c is the light velocity. aρσ shows the changes in polarizability a caused by the m ’ e → n transition, where ρ and σ are x, y, and z components of the polarizability tensor and e represents an electronic excited state. This equation shows that the intensity of Raman signals is proportional to the square of polarizability. The polarizability aρσ is given by the following Kramers–Heisenberg–Dirac formula:
𝑎𝜌𝜌 = �𝐸 (𝑀𝜌)𝑚𝑚(𝑀𝜌)𝑚𝑚 𝑚 − 𝐸𝑚− ℎ𝜐0− 𝑖Γ𝑚+ (𝑀𝜌)𝑚𝑚(𝑀𝜌)𝑚𝑚 𝐸𝑚− 𝐸𝑚 + ℎ𝜐0 − 𝑖Γ𝑚 𝑚 . (2) Here, Ee, Em, and En correspond to the energy of each state, and (Mσ)me corresponds to
15
the transitions from m to e, the intensity is proportional to the square of (Mσ)me. Here,
iΓe is the band width of the eth state; the iΓe term is called the damping constant. hν is
the energy of the irradiating light. The denominator of the first term, Ee − Em,
corresponds to the energy gap of the electronic transition. The denominator decreases as the energy of the irradiating light increases. When Ee − Em − hν is zero, the
polarizability aρσ has reached its maximum value. Here, if there is an absorption band in the molecule, (M)me and (M)en are different from zero.
The resonance Raman effect has a particular feature to detect biological molecules at a low concentration in a single living cell. Cytochrome c protein plays a major role in the mitochondrial electron transport chain.64 In addition, cytochrome c triggers the caspase cascade activation inducing cell apoptosis.65,66 Cytochrome c displays electronic absorptions around 530 nm;67 therefore, a laser excitation around530 nm induces a resonance Raman effect of cytochrome c.30 Using the resonance Raman effect, the presence of a reduced form of cytochrome c was confirmed in cells without labeling.30, 36 This indicates that the electron transport chain is active during Raman measurement. In Chapter 1 and 2 of this thesis, a 532 nm excitation laser was used to obtain the Raman spectra of a single cell. These studies also detected resonance Raman bands of cytochrome c. Because the resonance Raman intensity of cytochrome c in the oxidized form is known to be weak,30, 36 the presence of Resonance Raman bands of reduced form of cytochrome c is a marker for active energy synthesis in cells.
5. Spectral analysis
5.1. Principal component analysis (PCA)
16
with vibration spectroscopy, the obtained spectral data reach a huge size. In addition, biological samples are composed of many molecular ensembles. It is usually difficult to extract information from the spectra of sample mixtures. The extraction of information from data usually starts by visualizing or calculating the general features. For example, the average value and standard deviation are calculated, and the distribution type such as normal distribution is confirmed. These are important to define the character of the data. On the other hand, in vibration spectroscopy cases, the data sets are described by many variables (wave number, Raman shift). To display the data sets, over 100 dimensions would be required. Obviously, it is impossible to visually assess more than three-dimensional images; similarly, more than three dimensional plots of data cannot be visualized. Chemometrics provides methods for reducing the dimensions of multidimensional data into two- or-three dimensional plots.
PCA is the most used chemometrics analysis method for spectroscopic analysis. PCA is often used for the first analysis of a multivariate data set, providing an overview of the data sets, and it is designated to make a visual model based on all the variables. When Raman spectroscopic analysis is performed in cells or tissues, PCA is often used to detect differences and discriminations of data sets. PCA is applicable without preparing a model and/or pure spectra; this is an important characteristic for biological samples composed of unknown molecular entities. Let us suppose that we have a data matrix A with n rows and m columns, where the rows contain the “objective” variable (e. g., number of samples, temperature, pressure), while the columns list the “variables” (e. g. wave number, Raman shift). PCA works by projecting the hidden data structure in the matrix A to two spaces, which are score and loading (Fig. 2). Let us make a rough approximation of the 1st loading p1, which is given by the average spectrum (norm = 1).
17
Then, the 1st score t1 is given as follows:
𝑡1 = 𝐴𝑝1𝑇. (1)
Here, the data matrix A is written as follows:
𝐴 = 𝑡1𝑝1𝑇+ 𝑅. (2) R is the residue of A – t1p1T. The process is repeated to R for obtaining the 2nd component. The 2nd loading is chosen as the orthogonal relation to the 1st loading. These processes are iterated until the maximum number of “objective” variables.68 Finally, we have the following:
𝐴 = 𝑡1𝑝1𝑇+ 𝑡2𝑝2𝑇+ 𝑡3𝑝3𝑇+ ⋯ + 𝑡𝑚𝑝𝑚𝑇. (3)
Here, the p loading vectors are orthogonal to each other.
In Chapter 1 and 2, PCA was used to visualize pathways composed of changes in chemical composition during cell differentiation. In these studies, the Raman spectra of single cells were multivariate data matrixes composed of Raman shift (over 500 dimensions) and objective variables ranging from several hundreds to a few thousand. PCA provides an overview of these multidimensional data by reducing the number of dimensions.
5.2. Generalized two-dimensional correlation spectroscopy (G2DCOS)
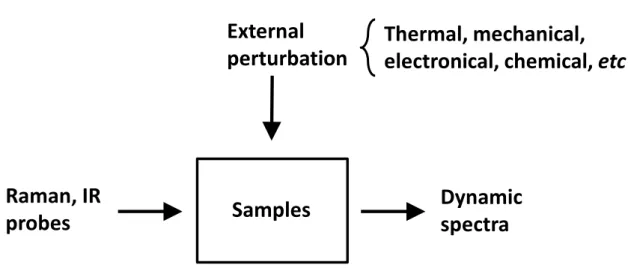
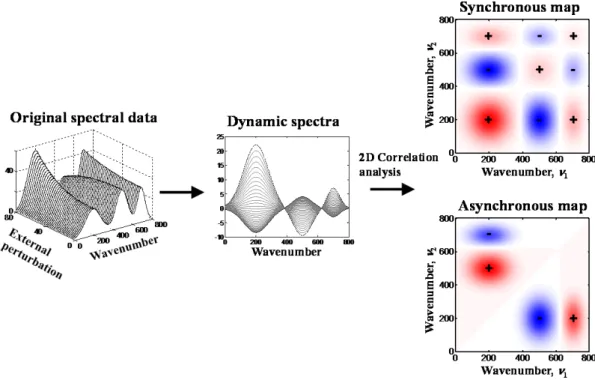
In 1993, the theory of G2DCOS was proposed.69-71 G2DCOS has been widely used to analyze the spectral intensity variations induced by an external perturbation, including changes in concentration, temperature, pH, and pressure. This technique can be applied to any type of samples and analytical probes, including infrared spectroscopy, Raman spectroscopy, and X-ray diffraction. The general scheme for obtaining the dynamics spectra for G2DCOS is shown in Fig. 3. There are many advantages of G2DCOS69, 70:
18
(i) simplification of complex spectra composed of many overlapping peaks and enhancement of spectral resolution, (ii) establishment of clear assignments through correlation bands, and (iii) truly versatile applicability to any type of spectroscopy and any form of analytical techniques.
The theoretical framework of G2DCOS is shown below. The dynamic spectra 𝑦�(𝜈, 𝑡) are given as follows:
𝑦�(𝜈, 𝑡) = �𝑦(𝜈, 𝑡) − 𝑦�(𝜈) for 𝑇𝑚𝑚𝑚 ≤ 𝑡 ≤ 𝑇𝑚𝑚𝑚
0 otherwise, . (1) Here, 𝑦(𝜈, 𝑡) is the spectral intensity variation observed as a function of the spectral variable 𝜈 over an interval where the external variable t ranges from Tmin to Tmax. As
the reference spectrum 𝑦�(𝜈) , the time-averaged spectrum is often used. The synchronous map Φ(𝜈1, 𝜈2) is given as follows:
Φ(𝜈1, 𝜈2) =𝑇 1
𝑚𝑚𝑚 − 𝑇𝑚𝑚𝑚 � 𝑦�(𝜈1, 𝑡) ∙ 𝑦�(𝜈2, 𝑡)𝑑𝑡 𝑇𝑚𝑚𝑚
𝑇𝑚𝑚𝑚
. (2)
The asynchronous map Ψ(𝜈1, 𝜈2) is given as follows: Ψ(𝜈1, 𝜈2) =𝑇 1
𝑚𝑚𝑚− 𝑇𝑚𝑚𝑚 � 𝑦�(𝜈1, 𝑡) ∙ 𝑧̃(𝜈2, 𝑡)𝑑𝑡 𝑇𝑚𝑚𝑚
𝑇𝑚𝑚𝑚
. (3)
Here, we recognize that 𝑧̃(𝜈2, 𝑡) is the Hilbert transform of 𝑦�(𝜈2, 𝑡), given as follows: 𝑧̃(𝜈2, 𝑡) =1𝜋 𝑝𝑝 �𝑦�(𝜈2, 𝑡 ′) 𝑡′− 𝑡 ∞ −∞ 𝑑𝑡′. (4)
Here, pv is the symbol for the principal value integral. Fig. 4 shows the general scheme for G2DCOS, and it shows an example of synchronous and asynchronous maps. The synchronous map Φ(𝜈1, 𝜈2) means that the intensities at 𝜈1 and 𝜈2 are synchronously increased or decreased. The asynchronous map Ψ(𝜈1, 𝜈2) represents the out-of-phase or sequential changes in spectral intensities at 𝜈1 and 𝜈2. In G2DCOS, one can
19
determine the sequential order of the spectral intensity changes on the basis of the signs of the cross peaks in the synchronous map Φ(𝜈1, 𝜈2) and the asynchronous map Ψ(𝜈1, 𝜈2).71 The rules for the sequential order decision are summarized as follows:
i) 𝑦(𝜈1, 𝑡) occurred before 𝑦(𝜈2, 𝑡) if sgn�Ψ(𝜈1, 𝜈2)/Φ(𝜈1, 𝜈2)� = +1 ii) 𝑦(𝜈1, 𝑡) occurred after 𝑦(𝜈2, 𝑡) if sgn�Ψ(𝜈1, 𝜈2)/Φ(𝜈1, 𝜈2)� = −1.
iii) If sgn�Ψ(𝜈1, 𝜈2)/Φ(𝜈1, 𝜈2)� = 0, 𝑦(𝜈1, 𝑡) and 𝑦(𝜈2, 𝑡) are completely synchronized.
In Chapter 3 of this thesis, using G2DCOS, the extraction of important changes for distinguishing diseased tissue was investigated. The use of G2DCOS allowed the unambiguous detection of band changes in the correlation maps representing the differences between the diseased tissue and normal tissue.
6. Abstract of each chapter
This thesis is composed of four chapters. The main studies of this thesis are described in Chapter 1 and 2. The dynamics of chemical components during the differentiation and proliferation of single and cell populations, obtained by Raman micro-spectroscopy and chemometrics, are discussed in these chapters. The studies presented in Chapter 3 and 4 are groundwork studies for Chapter 1 and 2 for technical acquisition for Raman analysis of the cells.
In Chapter 1, the differentiation of a MCF-7 cell population was investigated by Raman microscopic detection. MCF-7 cells were treated with HRG to induce their differentiation. The MCF-7 cells under HRG stimulation were assessed by Raman micro-spectroscopy during 12 days. The obtained Raman signals changed over time, reflecting the metabolic changes in the cytoplasm. The chemical changes in the Raman
20
spectra were roughly categorized as proteins, lipids, nucleic acids, and cytochrome c on the basis of the Raman peaks. The categorized peaks are dynamic over time and show an oscillating pattern. It was concluded that the differentiation process is not a monotonous pathway. Chemical distribution and dynamics were also observed in the PCA space for characterizing the differentiation pathway in a phase space. The dynamics of the cell population stimulated during 12 days showed that chemical changes circulated in the PC1 and PC2 components. Furthermore, in the PC3 component, oscillation dynamics were observed. The cells at day 6 could not be distinguished from those at day 0 by PCA. The soft independent model of class analogy (SIMCA), based on Raman and autofluorescence spectra, was also used to visualize differentiation pathways. In the SIMCA results, the cells at day 6 were completely separated in comparison with those at day 0. In conclusion, the dynamics of the differentiation pathway in a cell population can be detected by Raman and autofluorescence spectra with multivariate analysis.
In Chapter 2, reflecting the detection of the differentiation pathway in Chapter 1, intracellular chemical compositions in single cells were traced in the early stage of cell differentiation and proliferation induced by growth factors. The obtained time-course Raman spectra for MCF-7 cells under stimulation at 0–2 h and 24–26 h show the variation in the cytoplasmic chemical composition, and each growth factor stimulation condition shows differences in chemical components in comparison with the control. To visualize the chemical changes in a single cell and cell population in the phase space, PCA was used. For the differentiation process, PC1 and PC2 scores increased with time, reflecting increases in metabolite concentrations. For the proliferation process, PC scores also increased under EGF stimulation; however, the
21
increases were smaller than those in HRG-stimulated cells. Based on the results and assumptions, the “cellular chemical states” in the phase space were defined. The time-evolution of the cellular states and the dynamics of single cells in the initial 24 h of growth factor stimulation revealed the following: in the differentiation pathway, the chemical composition changed directionally and included both reversible and irreversible state change. In contrast, in the proliferation pathway, the chemical composition was homogenized into a single state. In addition, the differentiation factor amplified the fluctuations in the chemical composition, whereas the proliferation factor did not. In conclusion, Raman spectroscopy allows to characterize the chemical composition in single cells and cell populations during the initial stages of differentiation and proliferation.
In Chapter 3, an esophageal benign tumor in a rat was investigated by Raman micro-spectroscopy and two-dimensional correlation spectroscopy. The benign tumor of the esophagus was induced in a rat by N-nitro-methylbuthylamine (NMBA). The line profile Raman spectra of the esophageal benign tumor were measured using a home-made Raman micro-spectroscope. Biological samples often emit auto-fluorescence; therefore, to extract Raman band changes, the auto-fluorescence was removed from the Raman spectra by modified polynomial curve-fitting algorithms. To detect spectral differences between benign and normal regions, G2DCOS was applied to the Raman spectra. In the asynchronous map, at the Amide I band region, a cross-like pattern was observed. Based on a simulation study, the cross-like pattern indicated that the sharp band component correlated with the benign tumor region. It has been concluded from this chapter that G2DCOS with Raman spectroscopic analysis was effective in differentiating the benign tumor from the normal tissue of the esophagus.
22
In Chapter 4, a home-made Raman micro-spectroscope was used to detect the pigmentation induced by H2O2 in a human skin model. H2O2 is a substitute for UV irradiation to induce pigmentation. Human skin is composed of keratinocytes and different melanocyte types (Caucasian, Asian, and Black melanocytes). Caucasian, Asian, and Black skin types were chosen for early detection of skin pigmentation induced by H2O2. The difference in offset values and Raman bands of each skin type was detected around 1580 and 1380 cm−1, corresponding to the eumelanin pigment bands. To extract Raman band changes, the baseline of the whole obtained Raman spectra was corrected by modified polynomial curve fitting. In the time-course Raman spectra, the Raman band intensity of the Caucasian skin model largely decreased 4 days after stimulation, whereas the Raman band intensity of the Black skin model remained almost unchanged. With regard to the Asian skin model, the spectral changes were intermediate between those in the other skin models. Usually, in the skin model, pigmentation is only observed at 10–14 days by microscopy. The rapid intensity decrease in the Caucasian model is probably related to early changes in pigmentation caused by H2O2. In conclusion, different responses to H2O2 stimulation in each skin models and early changes in the Raman signals in comparison with those in the control are detected by Raman spectroscopy.
23
References
1. Wood, W.; Turmaine, M.; Weber, R.; Camp, V.; Maki, R. A.; McKercher, S. R.; Martin, P.; Development. 2000, 127, 5245-5252.
2. Yoshida, H.; Kong, Y. Y.; Yoshida, R.; Elia, A. J.; Hakem, A.; Hakem, R.; Penninger, J.M.; Mak, T. W.; Cell 1998, 94, 739-750.
3. Alberts, B.; Johnson, A.; Lewis, J.; Raff, M.; Roberts, K.; Walter, P.; Molecular biology of the Cell (5th Ed.), New York, Garland, 1983, chapter 23.
4. Gunning, P. W.; Landreth, G. E.; Layer, P.; Ignatius, M.; Shooter, E. M.; J. Neurosci. 1981, 1, 368-379.
5. Rudkin, B. B.; Lazarovici, P.; Levi, B. Z.; Abe, Y.; Fujita, K.; Guroff, G.; EMBO. J. 1989, 8, 3319-3325.
6. Bacus, S. S.; Kiguchi, K.; Chin, D.; King, C. R.; Huberman, E.; Mol. Carcinog. 1990, 3, 350-362.
7. Huff, K.; End, D.; Guroff, G.; J. Cell. Biol. 1981, 88, 189-198.
8. Osborne, C. K.; Hamilton, B.; Titus, G.; Livingston, R. B.; Cancer Res. 1980, 40,2361-2366.
9. Artavanis-Tsakonas, S.; Matsuno, K.; Fortini, M. E.; Science 1995, 268, 225-232. 10. Lai, E. C. Development 2004, 131, 965-973.
11. Pauklin, S.; Vallier, L.; Cell 2013, 155, 135-147.
12. Discher, D. E.; Mooney, D. J.; Zandstra, P. W.; Science 2009, 324, 1673-1677. 13. Balaban, N. Q.; Merrin, J.; Chait, R.; Kowalik, L.; Leibler, S.; Science 2004, 305,
1622-1625.
14. Mouri, K.; Sako, Y.; PLoS. Comput. Biol. 2013, 9, e1003320. 15. Griffin, J. L.; Shocker, J. P.; Nat. Rev. Cancer 2004, 4, 551-561.
24
16. Aebersold, R.; Man M.; Nature 2003, 422, 198-207.
17. Gygi, S. P.; Rist, B.; Gerber, S. A.; Turecek, F.; Gelb, M. H.; Aebersold, R.; Nat.
Biotechnol. 1999, 17, 994-999.
18. Ong, S. E.; Blagoev, B.; Kratchmarova, I.; Kristensen, D. B.; Steen, H.; Pandey, A.; Mann, M.; Mol. Cell. Proteomics 2002, 1, 376-386.
19. Spratlin, J. L.; Serkova, N. J.; Eckhardt, S. G.; Clin. Cancer Res. 2009, 15, 431-440.
20. Spiller, D. G.; Wood, C. D.; Rand, D. A.; White, M. R.; Nature 2010, 465,736-745. 21. Puppels, G. J.; de Mul, F. F.; Otto, C.; Greve, J.; Robert-Nicoud, M.; Arndt-Jovin, D.
J.; Jovin, T. M.; Nature 1990, 347, 301-303.
22. Haka, A. S.; Shafer-Peltier, K. E.; Fitzmaurice, M.; Crowe, J.; Dasari, R. R.; Feld, M. S.; Proc. Natl. Acad. Sci. U. S. A. 2005, 102, 12371-12376.
23. Chowdary, M. V.; Kumar, K. K.; Kurien, J.; Mathew, S.; Krishna, C. M.;
Biopolymers 2006, 83, 556-569.
24. Bergholt, M. S.; Zheng, W.; Lin, K.; Ho, K. Y.; Teh, M.; Yeoh, K. G.; So, J. B.; Huang, Z.; Technol. Cancer. Res. Treat. 2011, 10, 103-112.
25. Kong, K.; Rowlands, C. J.; Varma, S.; Perkins, W.; Leach, I. H.; Koloydenko, A. A.; Williams, H. C.; Notingher, I.; Proc. Natl. Acad. Sci. U. S. A. 2013, 110, 15189-15194.
26. Crow, P.; Barrass, B.; Kendall, C.; Hart-Prieto, M.; Wright, M.; Persad, R.; Stone, N.; Br. J. Cancer. 2005, 92, 2166-2170.
27. Swain, R. J.; Kemp, S. J.; Goldstraw, P.; Tetley, T. D.; Stevens, M. M.; Biophys. J. 2008, 95, 5978-5987.
25
Biophys. J. 2011, 100, 251-259.
29. Notingher, I.; Jell, G.; Lohbauer, U.; Salih, V.; Hench, L. L.; J. Cell. Biochem. 2004, 15, 1180-1192.
30. Oshima, Y.; Shinzawa, H.; Takenaka, T.; Furihata, C.; Sato, H.; J. Biomed. Opt. 2010, 15,017009.
31. Swain, R. J.; Kemp, S. J.; Goldstraw, P.; Tetley, T. D.; Stevens, M. M.; Biophys. J. 2010, 98, 1703-1711.
32. Swain, R. J.; Jell, G.; Stevens, M. M.; J. Cell. Biochem. 2008, 104, 1427-1438. 33. Chan, J. W.; Lieu, D. K.; Huser, T.; Li, R. A.; Anal. Chem.2009, 81, 1324-1331. 34. Zoladek, A.; Pascut, F. C.; Patel, P.; Notingher, I.; J. Raman spectrosc. 2011, 42,
251-258.
35. Huang, C. K.; Hamaguchi, H. O.; Shigeto, S.; Chem. Comm. 2011, 47, 9423-9425.
36. Okada, M.; Smith, N. I.; Palonpon, A. F.; Endo, H.; Kawata, S.; Sodeoka, M.; Fujita,
K.; Proc. Natl. Acad. Sci. U. S. A. 2012, 109, 28-32.
37. Nagashima, T.; Shimodaira, H.; Ide, K.; Nakakuki, T.; Tani, Y.; Takahashi, K.; Yumoto, N.; Hatakeyama, M.; J. Biol.Chem. 2007, 282, 4045-4056.
38. Olayioye, M. A.; Neve, R. M.; Lane, H. A.; Hynes, N. E.; EMBO. J. 2000, 19, 3159-3167.
39. Citri, A.; Yarden, Y.; Nat. Rev.Mol. Cell. Biol. 2006, 7, 505-516.
40. Mendoza, M. C.; Er, E. E.; Blenis, J.; Trends. Biochem. Sci. 2011, 36, 320-328. 41. Saeki, Y.; Endo, T.; Ide, K.; Nagashima, T.; Yumoto, N.; Toyoda, T.; Suzuki, H.;
Hayashizaki, Y.; Sakaki, Y.; Okada-Hatakeyama, M.; BMC. Genomics. 2009, 10, 545.
26
42. Nakakuki, T.; Birtwistle, M. R.; Saeki, Y.; Yumoto, N.; Ide, K.; Nagashima, T.; Brusch, L.; Ogunnaike, B. A.; Okada-Hatakeyama, M.; Kholodenko, B. N.; Cell 2010, 141, 884-896.
43. Veskatesachar, B.; Sibaiya, L.; Indian J. Phys. 1930, 5, 747-754.
44. Ferraro, J. R.; Nakamoto, K.; Brown, C. W.; Introductory Raman spectroscopy, Amsterdam: Academic press, 2003.
45. Delhaye, M.; Dhamelincourt, P.; J. Raman Spectrosc. 1975, 3, 33-43. 46. D. B. Chase; J. Am. Chem. Soc. 1986, 108, 7485-7488.
47. Motz, J. T.; Hunter, M.; Galindo, L. H.; Gardecki, J. A.; Kramer, J. R.; Dasari, R. R.; Feld, M. S.; Appl. Opt. 2004, 43, 542-554.
48. P. R. Carey 著、伊藤紘一、尾崎幸洋訳 “ラマン分光学-基礎と生物学への応用” (1984) 共立出版
49. 北川 禎三、Anthony T. Tu. “ラマン分光学入門” (1988) 化学同人
50. Caspers, P. J.; Lucassen, G. W.; Wolthuis, R.; Bruining, H. A.; Puppels, G.J.;
Biospectroscopy 1998, 4, S31-39.
51. Caspers, P. J.; Lucassen, G. W.; Carter, E. A.; Bruining, H. A.; Puppels, G.J.; J.
Inest. Dermatol. 2001, 116, 434-42.
52. Hanlon, E. B.; Manoharan, R.; Koo, T. W.; Shafer, K. E.; Motz, J. T.; Fitzmaurice, M.; Kramer, J. R.; Itzkan, I.; Dasari, R. R.; Feld, M. S.; Phys. Med. Biol. 2000, 45, R1-R59.
53. Komachi, Y.; Sato, H.; Aizawa, K.; Tashiro, H.; Appl. Opt. 2005, 44, 4722-4732. 54. Katagiri, T.; Yamamoto, Y. S.; Ozaki, Y.; Matsuura, Y.; Sato, H.; Appl. Spectrosc.
2009, 63, 103-107.
27
Sato, H.; Appl. Spectrosc. 2007, 61, 579-584.
56. Haka, A. S.; Volynskaya, Z.; Gardecki, J. A.; Nazemi, J.; Shenk, R.; Wang, N.; Dasari, R. R.; Fitzmaurice, M.; Feld, M. S.; J. Biomed. Opt. 2009, 14, 054023. 57. Takai, Y.; Masuko, T.; Takeuchi, H.; Biochem. Biophys. Acta. 1997, 17, 199-208. 58. Moritz, T. J.; Taylor, D. S.; Krol, D. M.; Fritch, J.; Chan, J. W.; Biomed. Opt.
Express. 2010, 1, 1138-1147.
59. Huang, H.; Shi, H.; Feng, S.; Chen, W.; Yu, Y.; Lin, D.; Chen, R.; Anal. Methods 2013, 1, 260-266.
60. Huang, Y. S.; Karashima, T.; Yamamoto, M.; Hamaguchi, H. O.; Biochemistry 2005, 44, 10009-10019.
61. Gentleman, E.; Swain, R. J.; Evans, N. D.; Boonrungsiman, S.; Jell, G.; Ball, M. D.; Shean, T. A.; Oyen, M. L.; Porter, A.; Stevens, M. M.; Nat. Mater. 2009, 8,763-770.
62. Pascut, F. C.; Kalra, S.; George, V.; Welch, N.; Denning, C.; Notingher, I.; Biochem.
Biophys. Acta. 2013, 1830, 3517-3524.
63. Ghita, A.; Pascut, F. C.; Mather, M.; Sottile, V.; Notingher, I.; Anal. Chem. 2012, 84, 3155-3162.
64. Alberts, B.; Johnson, A.; Lewis, J.; Raff, M.; Roberts, K.; Walter, P.; Molecular biology of the Cell (5th Ed.), New York, Garland, 1983, chapter 14.
65. Goldstein, J. C.; Waterhouse, N. J.; Juin, P.; Evan, G. I.; Green, D. R.; Nat. Cell.
Biol. 2000, 2, 156-162.
66. Hengartner, M. O.; Nature 2000, 407, 770-776.
67. Spiro, T. G.; Strekas, T. C.; Proc. Natl. Acad. Sci. U. S. A. 1972, 69, 2622-2626. 68. 長谷川健 “スペクトル定量分析” 講談社 53-56 頁
28
69. Noda, I.; Appl. Spectrosc. 1993, 47, 1329-1336.
70. Noda, I.; Ozaki, Y.; Two-dimensional Correlation Spectroscopy Application in Vibrational and Optical Spectroscopy, Chichester: Wiley, 2004.
29
Figure 1. Schematic representation of cellular chemical states and pathways in the cell fate decision
Differentiation
Proliferation
Cell
Cellular chemical state
Chemical components i
thj
thk
th30
Figure 2. The spectral data matrix A and decomposition of the data matrix by the outer product of the vectors t and p
=
A
m
n
t
1p
1+
t
2p
2+
t
np
n 0 200 400 600 800 0 20 40m
n
Spectral data・・・ +
31
Figure 3. The schematic representation of general scheme for obtaining the
dynamics spectra for perturbation-based two-dimensional correlation spectra.
Samples
Dynamic
spectra
Thermal, mechanical,
electronical, chemical, etc
External
perturbation
Raman, IR
probes
32
Figure 4. General scheme of the generalized two-dimensional correlation spectroscopy
33
Chapter 1: Raman and autofluorescence spectrum dynamics
along the HRG-induced differentiation pathway of MCF-7
34
Abstract
Cellular differentiation proceeds along complicated pathways, even when induced by extracellular signaling molecules. One of the major reasons for this complexity is the highly multi-dimensional internal dynamics of cells, which sometimes cause apparently stochastic responses in individual cells to extracellular stimuli. Therefore, monitoring internal dynamics of cells at single-cell resolution is required for understanding cell differentiation. Here, we detected the dynamic changes in the intracellular molecular components using a Raman and autofluorescence spectrum analysis of single cells. MCF-7 cells are a human cancer-derived cell line that can be induced to differentiate into mammary-gland-like cells with the addition of heregulin (HRG) to the culture medium. We measured the spectra in the cytoplasm of MCF-7 cells during 12 days of HRG stimulation. The Raman scattering spectrum, which was the major component of the signal, changed with time. A multicomponent analysis of the Raman spectrum revealed that the dynamics of the major components of the intracellular molecules, including proteins and lipids, changed cyclically along the differentiation pathway. The background autofluorescence signals of Raman scattering also provided information about the differentiation process. Using the total information from the Raman and autofluorescence spectra, we can visualize the pathway of cell differentiation in the multicomponent phase space.
35
1. Introduction
Cell differentiation is a complicated process that seems to be stochastic, even in clonal cells under the same growth conditions.1 One reason for this stochasticity must be the
complexity of the cellular internal dynamics. The state changes in cells are directed by a complex web of intracellular metabolic reactions interacting with the complex gene expression network. This complexity allows cells to take multiple states, even under the same environmental conditions. Therefore, it is sometimes difficult to regulate the differentiation of populations of cells effectively, although it is important to do so in many applications, including in regenerative medicine.2 A method must first be
established to monitor the dynamics of the intracellular components along the pathway of cell differentiation. Although various genomic, proteomic, and metabolomics technologies can be used for the precise analysis of cellular components, these “omic” technologies are invasive and usually only applicable to populations of cells.3 Therefore,
it is difficult to monitor the intracellular dynamics successively in individual living cells with the omic technologies.
Spectroscopic technologies can be used to complement the omic technologies in monitoring cell differentiation pathways because they allow successive measurements to be made in single living cells. Spectroscopic measurements potentially provide multidimensional information about the many chemical components of living cells with low invasiveness especially when long light wavelengths are used to monitor the cells. Raman scattering spectroscopy is the most popular spectroscopic technology for the detection of differences in the states of living cells and tissues.4 It can use long
excitation wavelengths and shows good contrast in detecting longer-wavelength signals, which can be separated from the excitation light. The greatest advantage of Raman
36
spectroscopy is probably its label-free detection of the multidimensional dynamics that reflect the differences between chemical components.5 The acquisition of
multidimensional data is essential to distinguish the various cellular states requiring no prior knowledge or speculation. The problems that arise from the low signals in Raman measurements can be overridden rapidly with recent improvements in the detection apparatus, including optics and photosensors.
Spectroscopic technologies can be extended straightforwardly into imaging or microscopic measurements. In fact, various cellular states or processes have been distinguished and analyzed using Raman microspectroscopy in tissues, single cells or sub-cellular volumes.4 For example, structure-specific signals have been detected in
human skin tissue,6 and cancerous and normal cells are distinguishable in the skin7 and
lung8 tissues with Raman microscopy. In single cells, Raman spectrum analysis has
successfully distinguished growth plateau conditions from exponentially proliferating conditions.9 Recently, differentiation markers in Raman spectra have been sought
vigorously by observing undifferentiated and differentiated embryonic stem cells10-12
and other cell types.13 However, as far as we know, most Raman spectroscopic studies
have been directed towards static comparisons of two states of cells, until now. Only a few studies have investigated the cellular internal dynamics during state changes in cells. Huang et al. 200514 examined the spatiotemporal changes in the Raman spectrum during
the yeast cell cycle and detected a specific Raman band for cells growing under good conditions. Their work has clearly emonstrated the power of Raman spectrum imaging measurements in detecting the dynamic state transitions in cells.
As well as Raman scattering, the autofluorescence of cellular components carries information about the cellular internal dynamics.15 Autofluorescence microspectroscopy
37
is another label-free multidimensional spectroscopic technology that can be naturally extended to allow imaging measurements to be made. It has been used for imaging tissues16 and in cancer diagnosis.17 Autofluorescence imaging can also be used for the
detection of functions of tissues18 and cells19. In this study, using the microspectroscopic
detection of both Raman and autofluorescence signals, we traced the heregulin (HRG)-induced differentiation pathway of MCF-7 cells. HRG is a small cell-signaling protein that is responsible for the development of various tissues of vertebrates.20 HRG
induces the differentiation of the MCF-7, a human-breast-cancer-derived cell line, into mammary-gland-like cells, which are characterized by the formation of oil drops and albumin secretion.21 We detected and characterized the multidimensional dynamics of
the metabolic components inside the cells during the HRG-induced differentiation pathway of MCF-7 cells. In this study, we concentrated on the multidimensional dynamics of the metabolites in the cell population. Therefore, we described the cell differentiation pathway in a phase space defined by the Raman and autofluorescence spectra. It is well known that cellular responses usually show wide variations, so we concentrated here on the distribution of the dynamics of single cells. If we can successfully describe the population dynamics in a phase space, this description can be extended to single-cell dynamics in the future.
2. Materials and methods
2.1. Cell culture and sample preparation
MCF-7 cells (obtained from the American Type Culture Collection) were maintained in Dulbecco’s minimal Eagle’s medium supplemented with 10% fetal calf serum at 37 °C in 5% CO2. The cells were transferred to a 35-mm cell culture dish with a quartz cover
38
slip on the bottom (SF-S-D27, Fine Plus International, Kyoto, Japan) for micro-spectroscopy. Lyophilized powder of recombinant human neuregulin1-² 1/heregulin1-² 1 EGF domain (HRG) was purchased from R&D Systems (Minneapolis), dissolved in PBS, and added to the culture medium with 1/60 dilution (final concentration of 30 nM) to induce cell differentiation. The culture medium containing HRG was refreshed every two days. Phase-contrast micrographs of the cells were acquired with an inverted optical microscope (CK40, NIKON, Tokyo, Japan) equipped with a 20× phase-contrast objective and a digital camera.
2.2. Micro-spectroscopy
Two days before the measurements were made, the cell culture medium was exchanged for medium without phenol red. Just before the measurements were made, the cells were washed with Hanks’ balanced salt solution containing 10 mM PIPES-Na (pH 7.2; HBSS–PIPES). HBSS-PIPES shows no significant background signal in the wavelengths we observed in this study. The Raman and autofluorescence spectra of the cells were measured in HBSS–PIPES with a confocal Raman microscope (inVia, Renishaw, Gloucestershire, UK), using an upright microscope equipped with a 63× dip-type water-immersion objective, NA = 0.9 (HCX APO LU-V-1, Leica, Wetzlar, Germany).
The cell cytoplasm was irradiated with a diffraction-limited spot from a 532-nm laser (7.4 mW after the objective). The spatial resolutions are 1 µm in lateral and 3–4 µm in focal directions. The positions of the measurements were selected randomly in the cytoplasm. Evident oil droplets and other organelles were avoided, though it is possible that some small droplets presented in the measurement volumes. 7–
39
24 spots in 3–5 cells were obtained in the cultures at each day of differentiation. Spectra from 7 spots on each day for 5 cells without HRG treatment were also obtained as the control. The emission from the excitation spot was selected with a confocal slit, diffracted with a grating (1800 lines/mm) and accumulated for 30 s on a 576 × 384 pixel cooled CCD sensor. The spectral resolution of the system is 1.7 cm-1 according to the
manufacture. Calibration of the wavelength was done using silicon substrate. Ununiformity of the detector response was not corrected but less than 5% over the observation wavelength.
Illumination with the excitation laser might cause certain damages on cells, even though the irradiation power and period used in this study were in the range of those used in the previous studies.8, 22, 23 To avoid possible photo-damage effects,
independent cell cultures were used for the measurements of different days of differentiation. Densities of cells were regulated to be about 70% of confluent. Cells in day 0 were in the steady state of log-phase growth condition.
2.3. Data analysis
After subtraction of the dark current, the Raman scattering and autofluorescence signals were separated in each spectrum, as shown in the Supporting Materials (Fig. 7). The Raman spectrum was vector normalized for the signals from 560 to 1790 cm–1. The
signals had 616 points (2 cm–1/point). A multivariate analysis of the spectra was
performed using MATLAB (The MathWorks Inc., Natick) and The Unscrambler 9.8 (CAMO Software, Tokyo, Japan).
40
3. Results
3.1. Measurement of the Raman and autofluorescence spectra along the differentiation pathway of MCF-7 cells
MCF-7 cells were cultured with a continuous supply of HRG in the culture medium to induce their differentiation. Phase-contrast micrographs of the cells were acquired along the differentiation pathway (Fig. 1). The accumulation of small oil droplets in the cytoplasm was observed in a small population of cells after HRG treatment for 1–3 days (Fig. 1B, C) and oil droplets were evident around the nucleus in most cells after six days of treatment (Figs. 1D, E and 8).
To detect the changes in the metabolite components of the cell cytoplasm during the differentiation process, the photo-excited emission spectra were measured with a confocal microspectrometer in cells before HRG stimulation (day 0), and after HRG stimulation for 1, 3, 6, and 12 days. No measurements were made at sites clearly containing oil droplets or other vesicles in order to detect the changes in the cytoplasmic solution. Spectra were obtained from ~1 µm3 of the confocal volume excited by a diffraction-limited 532-nm laser spot (Fig. 2A). After accumulation of emission for 30 s, a spectrum with an appropriate signal to noise ratio was obtained for further analysis (Fig. 2B). Most of the acquired signals were characteristic of the Raman scattering peaks of the metabolites. The spectra also contained a low-frequency background signal, probably caused by cellular autofluorescence. In each raw spectrum, 16 points at which Raman signal was small were selected (the wave numbers were 560, 656, 710, 738, 772, 800, 906, 994, 1014, 1140, 1192, 1388, 1518, 1728, 1772, and 1790 cm–1). The Raman
and autofluorescence signals were separated with respect to these 16 points (see Fig. 7 for the details of Raman and autofluorescence separation). The Raman,
41
autofluorescence, and entire spectra were vector normalized at 560–1790 cm–1 and used
for further analysis (Figs. 2C, D).
3.2. Changes in the chemical components detected from Raman spectra
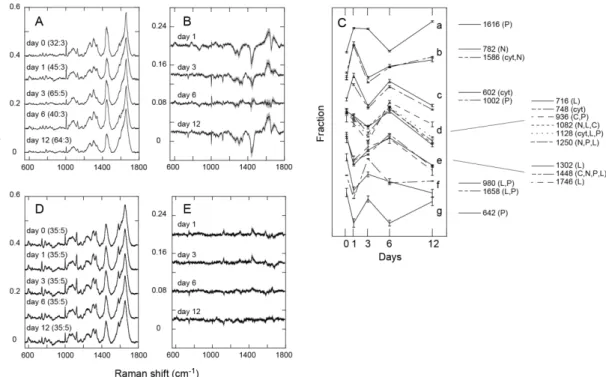
The normalized Raman spectra were averaged for each day of differentiation (Fig. 3A), and the difference spectra relative to the average spectrum on day 0 were calculated (Fig.3B). The average spectrum changed with the days of differentiation, and we could assign some of the peaks to specific chemical components, including nucleic acids, proteins, lipids, carbohydrates, and cytochrome c, based on previous reports.8, 10, 14, 24-26
The resonance Raman bands of the heme attached to the cytochrome c protein can be separated specifically from those of the other chemical components of cells by excitation at 532 nm.8 As shown in the difference spectra, the fractions of many of the
chemical components of the cells changed dynamically, with individually specific patterns. The dynamics of the major Raman peaks could be categorized roughly into several groups (Fig. 3C). Changes of spectrum from cells without HRG treatment were small (Fig. 3D, E).
Although the separations were incomplete because the Raman peaks derived from different chemical species overlapped, nucleic acids, lipids, carbohydrates, and cyt c generally showed specific dynamics for each individual category of chemical components: Signals largely specific for nucleic acids increased on day 1, then decreased on day 3, and increased again on day 12 (Fig. 3Cb). The cyt c fraction showed dynamics similar to those of nucleic acids, but the fraction on day 12 was small (Fig. 3Cc). The lipid and carbohydrate fractions were small in the early days of differentiation but increased in the middle period of the differentiation pathway (Fig.
42
3Cd, e). After the middle period, the lipid components were probably transferred to the large oil droplets excluded from the measurement. The dynamics of the protein fractions showed large variations as expected from the different roles of each species of protein. From these oscillating patterns of change in the metabolite fractions, it can be concluded that differentiation takes a complicated pathway with time, rather than a straightforward one, from the perspective of the cytoplasmic metabolite composition.
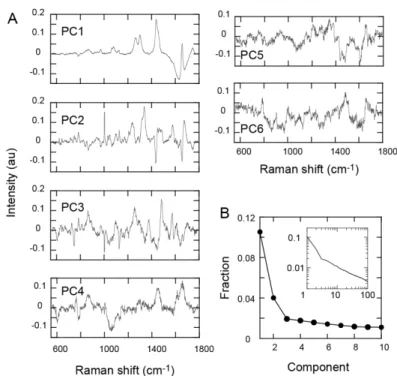
3.3. Principal component analysis of the Raman spectra
To characterize the differentiation pathway in a phase space, principal components analysis (PCA) was used, based on all the individual Raman spectra taken at different times and in different spaces (Fig. 2D). The loadings of the first six components and the distribution of the contribution ratios are shown (Fig. 4). About 16% of the information on the cellular dynamics was contained in the first three principle components (PC1– PC3; Fig. 4B). Although the higher-order components still contained extra information, the loadings for components higher than the third order were noisy. Therefore, for simplicity, we concentrated on PC1–PC3.
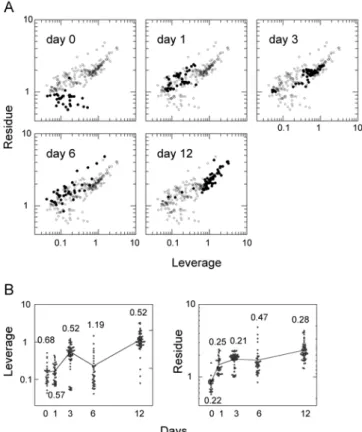
3.4. Cell differentiation dynamics described in the Raman spectrum phase space The PC1 and PC2 scores for individual spectra were plotted in a two-dimensional phase space (Fig. 5A). Interestingly, all the spectra were distributed in a triangular area, the bottom edge of which was parallel to the PC1 vector, and most of the spectra were aligned along the three edges of the distribution. We noted that the three vertices of this triangular distribution were characterized by the spectra each of which were enriched with protein, lipid, or water signals, respectively, i.e., the spectra in the middle-PC1 and