Farazi Binti Ferdous
A Dissertation submitted in fulfillment of the requirements for the degree of Doctor of Philosophy
Graduate School of Asia Pacific Studies, Waseda University Tokyo, Japan
June 2013
Dedicated to My Loving Husband
Dr. ATM Zafrul Azam
Acknowledgements
I wish to express my sincere gratitude to Professor Shujiro Urata, my Ph. D. supervisor, for his constant support and encouragement during the course of this work.
I am grateful to my deputy advisor Professor Kazuhiko Yokota and two other members of the screening committee, Professor Nobuhiko Fuwa and Dr. Atsuyuki Kato, for their insightful comments and critical examination of the dissertation.
I take the opportunity to express special thanks to my husband Dr. ATM Zafrul Azam, my daughter Eshat Fareeha, my parents, my parents-in-law and every other members of my family for their passionate encouragement and continuous support during my stay in Japan.
I thank each and every person who have helped and supported me during the entire research period, especially Dr. Ivan Deseatnicov, for his constructive support for the dissertation.
Finally I would like to thank the Global Institute for Asian Regional Integration (GIARI) and Waseda University, for the financial support to carry out the research.
Contents
Table of Contents List of Figures
List of Tables V
List of Abbreviation VI
VII
Chapter 1. Introduction ... 1
1.1 Background ... 1
1.2 Objectives of the Study ... 6
1.3 Hypotheses ... 6
1.4 Research Questions ... 7
1.5 Significance of the Study ... 8
1.6 Contributions of the Research ... 10
1.7 Organization of the Thesis... 11
Chapter 2. Literature Review... 13
2.1 Conceptualizing Export Diversification ... 13
2.2 Disaggregated Data ... 17
2.3 Importance of Export Diversification ... 19
2.4 Previous Studies ... 22
2.4.1 Export diversification and growth ... 25
2.4.2 Patterns and determinants of export diversification ... 27
2.4.3 Theoretical discussion on export diversification... 30
2.4.4 Trade cost and export diversification... 33
2.5 East Asian Studies in Export Diversification... 35
2.6 FTAs and Export Diversification in East Asia... 38
2.7 Gap in the Existing Literature... 42
Chapter 3. Patterns of Export Diversification in China, Japan and Korea ... 44
3.1 Objective ... 44
3.2 Literature Review... 44
3.3 Data and Methodology ... 46
3.3.1 Country selection ... 46
3.3.2 Export data and source ... 49
3.3.3 Measurement of export diversification ... 52
3.4 Trends of Sectoral Export Diversification in China, Japan and Korea... 53
3.4.1 Patterns of export diversification in China ... 53
3.4.2 Patterns of export diversification in Japan... 58
3.4.3 Patterns of export diversification in Korea ... 61
3.5 Export Diversification by New Goods... 66
3.5.1 Defining new goods in this study ... 67
3.5.2 New goods in China ... 68
3.5.3 New goods in Japan... 70
3.5.4 New goods in Korea... 73
3.6 Share of Intensive and Extensive Margins in Total Export... 76
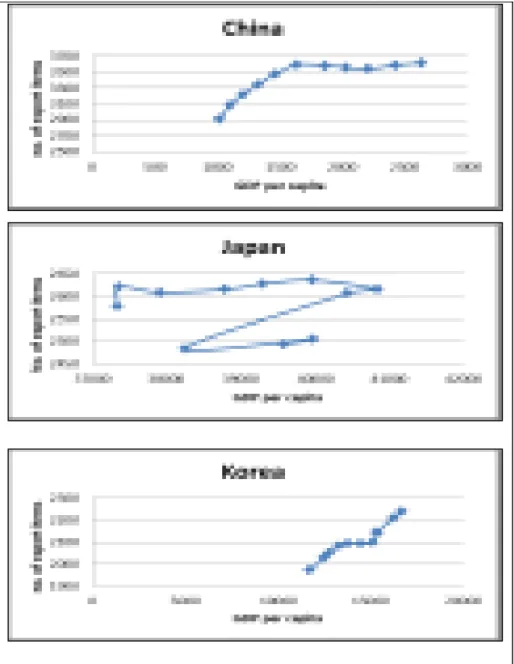
3.7 Export Diversification and Economic Development ... 77
3.8 Chapter Conclusion ... 83
Chapter 4. Determinants of Export Diversification Using Aggregate Level Data... 86
4.1 Objective ... 86
4.2 Literature Review... 86
4.3 Trends in Export Diversification ... 89
4.4 Evolution of Number of Export Items in China, Japan and Korea... 91
4.5 Export Diversification in Comparative Context ... 95
4.5.1 Economic development of the partner country ... 95
4.5.2 Size of the partner country ... 97
4.5.3 Distance... 99
4.6 Regional Trade ... 102
4.6.1 Sectoral share of regional trade ... 104
4.7 Demand for Diversified Goods... 108
4.8 Econometric Approach... 112
4.9 Analysis of Results... 123
4.10 Chapter Conclusion ... 126
Chapter 5. Determinants of Export Diversification Using Disaggregate Level Data .... 129
5.1 Objective ... 129
5.2 Literature Review... 129
5.3 Melitz (2003) Model ... 134
5.3.1 New-new trade theory (Revisions) ... 136
5.4 Econometric Approach using Disaggregate Data ... 140
5.5 Analysis of Results... 154
5.6 Chapter Conclusion ... 157
Chapter 6. Conclusion... 160
6.1 Summary of Findings ... 162
6.2 Concluding Remarks ... 167
6.3 Limitations of the Study ... 169
6.4 Future Work ... 169
Bibliography ... 171
Appendix .. 178
List of Figures
Figure 2-1: Flow chart of existing literatures for export diversification... 22
Figure 3- ... 47
Figure 3-2: Total export to the 20 partners... 49
Figure 3-3: Evolution of number of exported items from China ... 54
Figure 3-4: Changes in sector share by value from 2001 to 2011 (China-Mexico)... 55
Figure 3-5: Changes in sector share by value from 2001 to 2011 (China-Russia)... 55
Figure 3-6: Changes in sector share by value from 2001 to 2011 (China-Hong Kong)... 56
Figure 3-7: Changes in sector share by value from 2001 to 2011 (China-USA) ... 57
Figure 3- -2011)... 57
Figure 3-9: Evolution of number of exported items from Japan ... 58
Figure 3-10: Changes in sector share by value from 2001 to 2011 (Japan-Mexico) ... 59
Figure 3-11: Changes in sector share by value from 2001 to 2011 (Japan-Russia) ... 60
Figure 3-12: Changes in sector share by value from 2001 to 2011 (Japan-China) ... 60
Figure 3-13: Changes in sector share by value from 2001 to 2011 (Japan-Korea) ... 61
Figure 3- -2011)... 61
Figure 3-15: Evolution of number of exported items from Korea... 62
Figure 3-16: Changes in sector share by value from 2001 to 2011 (Korea-Netherlands)... 63
Figure 3-17: Changes in sector share by value from 2001 to 2011 (Korea-Mexico)... 63
Figure 3-18: Changes in sector share by value from 2001 to 2011 (Korea-China) ... 64
Figure 3-19: Changes in sector share by value from 2001 to 2011 (Korea-Japan) ... 64
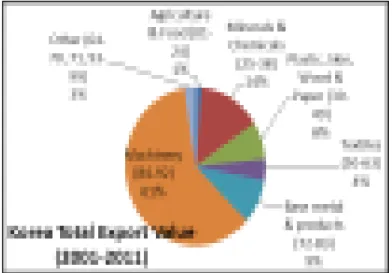
Figure 3- -2011) ... 65
Figure 3-21: New goods from China to partner countries (2001-2011) ... 68
Figure 3-22: Sectoral distribution of extensive margin to partners from China ... 69
Figure 3-23: New goods by sector to Asian partners from China ... 70
Figure 3-24: New goods by sector to non-Asian partners from China ... 70
Figure 3-25: New goods from Japan to partner countries (2001-2011)... 71
Figure 3-26: Sectoral distribution of extensive margin to partners from Japan... 72
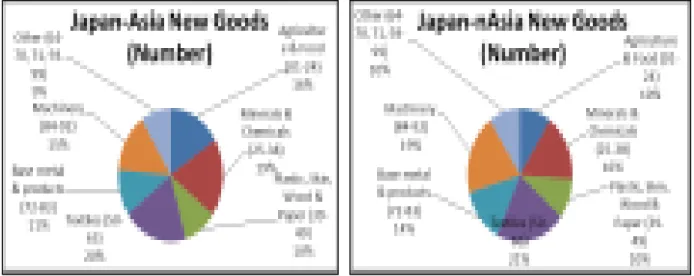
Figure 3-27: New goods by sector to Asian partners from Japan... 72
Figure 3-28: New goods by sector to non-Asian partners from Japan... 73
Figure 3-29: New goods from Korea to partner countries (2001-2011) ... 74
Figure 3-30: Sectoral distribution of extensive margin to partners from Korea ... 74
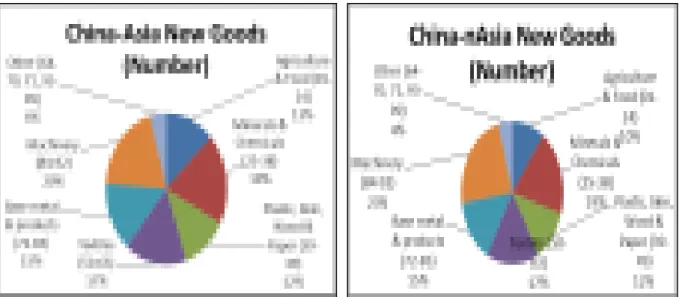
Figure 3-31: New goods by sector to Asian partners from Korea ... 75
Figure 3-32: New goods by sector to non-Asian partners from Korea ... 75
Figure 3-33: Stages of development and export diversification ... 80
Figure 3-34: Stages of development and export diversification in China, Japan and Korea... 81
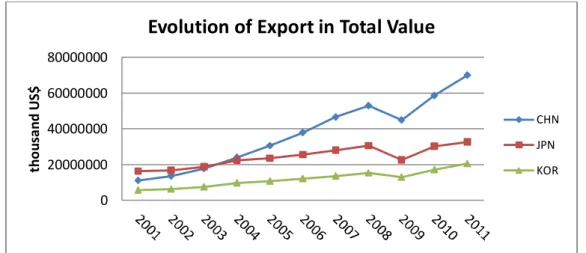
Figure 4-1: Evolution of export value in China, Japan and Korea for 20 partner economies ... 89
Figure 4-2: Evolution of average number of export items in China, Japan and Korea ... 90
Figure 4-3: Evolution of number of exported items from China ... 92
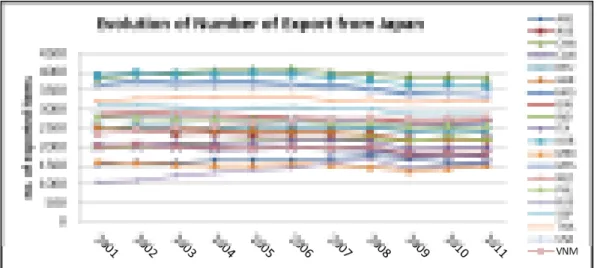
Figure 4-4: Evolution of number of exported items from Japan ... 93
Figure 4-5: Evolution of number of exported items from Korea... 94
Figure 4-6: Number of exports from China and destination country GDP p. c. (2001, 2011) . 96 Figure 4-7: Number of exports from Japan and destination country GDP p. c. (2001, 2011) . 96 Figure 4-8: Number of exports from Korea and destination country GDP p. c. (2001, 2011).. 97
Figure 4-9: Number of exports from China and GDP of the partner country (2001, 2011)... 98
Figure 4-10: Number of exports from Japan and GDP of the partner country (2001, 2011) .... 98
Figure 4-11: Number of exports from Korea and GDP of the partner country (2001, 2011) ... 99
Figure 4-12: Number of exports and distance of partner economies for China ... 100
Figure 4-13: Number of exports and distance of partner economies for Japan ... 100
Figure 4-14: Number of exports and distance of partner economies for Korea... 101
Figure 4-15: Regional share of export in value for Asian and non-Asian markets ... 102
Figure 4-16: Evolution of positive number of export goods for Asian and n-Asian partners . 103 Figure 4-17: Evolution of positive number of export goods for Asian and n-Asian partners . 103 Figure 4-18: Evolution of positive number of export goods for Asian and n-Asian partners . 103
Figure 4- ... 105
Figure 4- ... 105
Figure 4- total export per sector ... 106
Figure 4- ... 106
Figure 4- ... 107
Figure 4- ... 107
Figure 4- and... 110
Figure 4-26: Change in import cost from 2005 to 2011 ... 125
Figure 5-1: Export varieties and cost relation in Melitz model ... 137
Figure 5-2: Melitz model at a glance (clock-wise)... 139
List of Tables
Table 2-1: FTA status by country, 2012 ... 39
Table 2-2: FTA status with partner countries of this study ... 41
Table 3-1: Country names and country codes used in the study... 48
Table 3-2: Growth in share of new ... 76
Table 4-1: GDP per capita at 2001 and 2011 for all countries ... 112
Table 4-2: Model 1 GLS estimation results: Extensive margin... 117
Table 4-3: Model 1 GLS estimation results: Extensive margin with trade costs ... 119
Table 4-4: Model 2 GLS estimation results: Intensive margin... 120
Table 4-5: Model 2 GLS estimation results: Intensive margin with trade costs ... 122
Table 4-6 Factors affecting export diversification of China, Japan and Korea... 123
Table 4-7: Changes of nominal exchange rates against US$... 125
Table 5-1: Previous studies of export diversification, trade cost and findings ... 132
Table 5-2: Overall Tobit results ... 146
Table 5-3: Tobit results including cost factors ... 147
Table 5-4: Tobit results with each sector ... 149
Table 5-5: Marginal effects after Tobit (intensive margin) ... 151
Table 5-6: Marginal effects after Tobit (extensive margin) ... 153
Table A-1: Number of export from China... 178
Table A-2: Number of export from Japan... 178
Table A-3: Number of export from Korea ... 179
Table A-4: Average numbers of exported items for 20 partner economies ... 179
Table A-5: Average value of export for 20 partner economies (thousand US$) ... 179
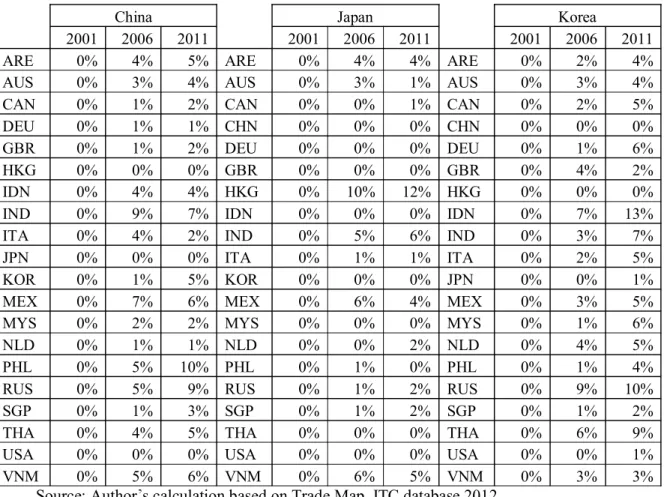
Table A-6: Percentage share of export for 20 partners... 180
Table A-7: Selection of countries: Top twenty for 2001 and 2011 ... 180
Table A-8: Classification of aggregated level for expositional simplicity... 181
Table A-9: FTA status by 2012, China ... 181
Table A-10: FTA status by 2012, Japan... 182
Table A-11: FTA status by 2012, Korea ... 182
Table A-12: FTA status by Asian country, 2012 ... 183
Table A-13: FTA dummy year counted for China ... 185
Table A-14: FTA dummy year counted for Japan... 185
Table A-15: FTA dummy year counted for Korea ... 186
Table A-16: Number of new goods (2001-2011)... 186
Table A-17: Cost to start a business (% of income per capita) and cost of export ... 187
Table A-18: Cost to import (US$ per container)... 187
Table A-19: Chapter 4 model data summary (China) ... 188
Table A-20: Chapter 4 model data summary (Japan)... 188
Table A-21: Chapter 4 model data summary (Korea) ... 189
Table A-22: Chapter 5 model data summary (China) ... 189
Table A-23: Chapter 5 model data summary (Japan)... 190
Table A-24: Chapter 5 model data summary (Korea) ... 190
Table A-25: What do the starting a business indicators measure? ... 193
Table A-26: What do the trading across borders indicators measure? ... 197
List of Abbreviation
ADB Asian Development Bank ASEAN Association of South East Asian
Nations
AFTA ASEAN Free Trade Area
APEC Asia-Pacific Economic Cooperation APTA Asia- Pacific Trade Agreement ASEAN+3 ASEAN+ China, Japan and Korea CECA Comprehensive Economic
Cooperation Agreement CEPA Comprehensive Economic
Partnership Agreement CEPEA Comprehensive Economic
Partnership in East Asia (ASEAN+6) CEPII Centre d'Etudes Prospectives et
d'Informations Internationales EPAs Economic Partnership Agreements FDI Foreign Direct Investment
FTA free trade agreements
GATT General Agreement on Tariffs and Trade
GDP Gross Domestic Product GLS generalized least squares HHI Herfindahl-Hirschman Index
HS harmonized system
ITC International Trade Center IMF International Monetary
Fund
ITS International Trade Statistics
OLS ordinary least squares PPP purchasing power parity
PRC Republic of China
RER real exchange rate SITC Standard International
Trade Classification UN COMTRADE United Nations Commodity
Trade
UNCTAD United Nations Conference on Trade and Development UNSD United Nations Statistics
Division
VIF variance inflation factor
WCO World Customs
Organization WDI World Development
Indicator
WTO World Trade Organization
THE SUMMARY OF DOCTORAL THESIS
PATTERNS AND DETERMINANTS OF EXPORT DIVERSIFICATION IN CHINA, JAPAN AND KOREA:
-A study using highly disaggregated data-
4009S318-4 Ferdous, Farazi Binti Chief Advisor: Prof. Urata, Shujiro
Most empirical works on export diversification have focused exclusively on positive trade flows. Recent studies of export diversification have revealed a wealth of new stylized facts.
The trend of using increasingly disaggregated data discovered surprising patterns of export entrepreneurship among the countries.
Contemporary studies in international trade have focused on changes in trade patterns driven by countries export in goods that they had not exported before. These sorts of changes are referred as changes on extensive margin or the new goods margin. At the same time, changes in intensive margin are changes in exports of goods that were previously exported. This study focuses on these two measures of diversification particularly in relation to China, Japan and Korea and their major twenty trade partners.
In order to understand export diversification, it is important to acknowledge its microeconomic determinants. The flawless dataset to deal with export diversification issues from a microeconomic point of view would be firm-level export data for each country pair. Unfortunately, such data is not available to researchers, so it is a common practice to use the highest level of internationally comparable disaggregated country level trade data.
The 6-digit Harmonized System (HS) from UN Comtrade database is one of the most reliable sources for this kind of trade data. This study extracts export data from the Trade Map of International Trade Center (ITC), based on UN Comtrade, from 2001 to 2011.
Previous literature on East Asian export diversification did not thoroughly study the intensive and extensive margins of export in China, Japan and Korea. The highly disaggregated data is used in this research in order to pick up the extensive margin of export, i.e. the range of products that one country export to another. At this level of disaggregation there are many zeros in the trade matrix due to the fact that countries export only a subset of goods to each partner. With the help of recent trade models as Melitz (2003) the existence of zeros in the trade matrix can be related to the variable and fixed trade costs. The new-new trade theories suggest that the likelihood of observing a zero in the trade matrix increases with the level of fixed trade costs.
Helpman et al. (2008) argues that estimates of the impact of trade resistance measures or trade costs provide important information. Countries should focus on discrete changes in which bilateral trade liberalization and other trade cost factors facilitate the transformation of some goods from non-traded to traded status.
For this reason, it is important to obtain reliable estimates of effects of those trade barriers (trade costs) or trade enhancers (FTAs) on international trade flows.
Existing literature that consider various cost factors as barriers to trade do not specifically cover individual country cases of China, Japan and Korea. In addition, they do not cover time series or panel data analysis for the barriers to trade and export diversification. This study estimates the effect of export, import and starting business cost on extensive and intensive margins of export.
These cost data are compiled from World Bank Doing Business database available from 2005 to 2011. Under the circumstances, this research is expecting to contribute to the international trade literature by including the study of export diversification and trade cost relations in China, Japan and Korea.
The study finds significant changes in the diversification
the number of exported products or the extensive margin of export;
an increase in the export numbers indicates export diversification.
The results show that China and Korea are increasing the average number of export items to their major twenty trade partners.
Nevertheless, Japan shows a decreasing trend of export diversification with the partner countries. This finding thus supports the previous literature that countries diversify at the beginning of their economic development and then concentrates on export products. At the same time, the extensive and intensive margins of export share are concentrated in some few sectors like machinery, metal and related products, minerals and chemicals.
Calculation of new goods reveals that growth in export is found to be mainly driven by intensive margin, while the contribution of extensive margin to export growth is rather limited.
This study hypothesized that trade will be most intensive among countries with similar demand structure due to a large overlap of production and consumption patterns; and this overlap of demand can be seen in terms of product variety or diversified trade. The results support the fact that China s export diversification does not depend on the similarity of income with the destination economy. On the other hand, Japan s existing export or the intensive margin of export diversification significantly depends on the reducing trend of the income gap with the partner economy.
Interestingly, Korea s export diversity is significantly affected by the increasing income gap with the partner economy.
All findings using aggregate level of export data (total number of exports and total value) support the fact that Korea, Japan and China export more goods of the new and existing category to countries with larger income. Trading with Asian economies induces export diversification for Japan and Korea but not for China. However, exchange rate fluctuations show strong influence on the export diversification in total values and in number of goods for all three exporters.
The study also finds evidence that supports the hypothesis that greater variety in export is associated with reduction of export costs. For example, trade liberalization through effective FTA reduces export cost and induces export diversification. Furthermore, reduced export costs through improved trade facilitation helps to increase export varieties. Distance, FTAs and trade costs significantly affect export diversification and are always important determinants for export diversification at any level of export (total and HS 6-digit) as found in the study.
When using disaggregated data the study confirms that FTAs increase the likelihood of exporting new varieties of export to the trade list of these countries. On the other hand, reduction of export cost at home and import cost at destination market helps to induce new varieties in the export list by encouraging new entrepreneurs in the export market. These results of trade and market entry costs provide an indication of the impact of the reduction in trade costs in creating new varieties. This effect is larger for Japan than that of Korea and China. This helps to explain the reduction of number of zeros in the export matrix.
Therefore, the study results show that trade costs have significant impact on overall diversification of exports which supports the study hypothesis that export diversification in both margins are influenced by all trade barriers and enhancers, for
Chapter 1. Introduction
1.1 Background
Trade theory is based on the principle that specialization according to comparative advantage is optimal. Therefore, export diversification is not a natural objective by itself for the academic trade economist. Literature on export diversification suggests that diversified export can have important effect on productivity and economic growth. One school of thought related to export diversification and economic growth reveals that export diversification can reduce exposure to external shocks and thus reduce macroeconomic volatility which will lead to economic growth. Empirical interest in trade diversification is not new, going (1958) work [Cadot, Carrère & Strauss- Kahn, 2012], however, recently interest has renewed under the compulsion of both empirical and theoretical advances.
One such recent development in international trade literature is the incorporation of monopolistic competition in the traditional trade model. Krugman (1980) presents homogeneous firms monopolistic competition model and shows that gains come from consumers to whom new foreign varieties become accessible. The other developments include the gains from trade that is explained by Melitz (2003) model which uses a heterogeneous firm model where trade induces self-selection of more efficient firms. Melitz (2003) explains how an increase in export variety can be the source of export diversification that increases productivity given that exporters are more productive than non- exporters. Studies [Feenstra & Kee, 2008] show that the relative total factor productivity increases with the relative export variety, with the help of Melitz (2003) model. In short, variety or diversification is the key determinant of gains from trade.
Export diversification has been measured in many ways by the researchers. For example, studies have used concentration indexes, counts of exported products or indexes that take into account the productivity content of the export basket. Existing empirical work on export diversification has focused exclusively in existing trade flows. The intent behind measures of concentration indexes, such as Herfindahl-Hirschman index, is: they are designed to pick up the extent to which different countries rely more or less heavily on a small range of products for a bulk of their export earnings.
From a theoretical perspective, there are two mechanisms by which such measures of diversification can increase. One possibility is that export goods at low aggregate values grow more quickly than those at high aggregate values. This kind of diversification can be thought of as occurring at the intensive margin, in the sense that it does not involve exporting any new products. The other way in
which diversification can occur is through the extensive margin: introducing new products into a country s export bundle necessarily increases its level of diversification, keeping all else constant.
Therefore, bilateral trade flows develop at two margins, the extensive and the intensive.
Empirical trade literature has a long history but research about the extensive margins of international trade flows started only a few years ago, both theoretically and empirically [Bernasconi, 2009].
Recent research in international trade has focused on changes in trade patterns driven by countries export in goods that they had not exported before. These sorts of changes are referred as changes on extensive margin or the new goods margin. At the same time, changes in intensive margin are changes in exports of goods that were previously exported. Besides counting exported products, this study looks at the extensive margin of export or the new goods margin which is a new trend in this research area. It is understood that this classification or definition followed in this study is well suited to discuss diversification issues from a product point of view and does not consider geographic dimension.
In this study, more empirical evidence for the patterns and determinants of export diversification is provided, specifically for the three important economies of Asia: Republic of China (hereafter China), Japan and Korea, Republic (hereafter Korea). This study has chosen three Asian countries that accounts for a very significant share of world export. According to WTO International Trade Statistics (ITS) 2012, the top ten merchandise traders accounted for over half (51%) of the world s total merchandise trade in 2011 and China, Japan and Korea are three of them among Asian economies. This research particularly looks at the export diversification pattern for the top twenty partner economies. This is a new contribution to the existing literature on trade diversification and also for China, Japan and Korea in particular because it takes care of detail measure of export variety for each partner under consideration. Focusing on the major export partner is important because it can investigate a possible heterogeneity in the export pattern of each exporter to the particular partner and for regional heterogeneity as well. The fact that country idoes export to country j contains valuable information which needs to be utilized in order to obtain consistent estimates.
Previous trade models with product differentiation by firms could be used to explain the facts on intensive and extensive margins. But early trade models such as those by Helpman and Krugman (1986) imply that big markets produce lots of varieties and all of those varieties are exported to all markets. However, it is empirically proven that countries export to a strict subset of actively importing destinations in most categories, reflecting the fixed costs to exporting a variety to each foreign market.
In addition, not all the firms in a country are engaged in international trade and only a number of goods are traded internationally. The traditional trade theories ignored the fact that trade barriers
could affect the number of goods exported by a nation [Amurgo-Pacheco & Pierola, 2008]. The common idea was that the basic determinants of the zero trade and the positive trade flows are the same. Therefore, it is not acceptable to use either the traditional or the new trade theory to explain the changes in the number of traded varieties. The model introduced by Melitz (2003) helps to address the question of differences of appearance between zero and positive trade and thus explains the presence of zeros in the trade matrix.
It should be noted that the product level extensive margin of a bilateral trade flow captures how many different product varieties are shipped while the corresponding intensive margin represents the total value of shipments in each product variety. The extensive margin should be considered as binary.
A countryimay export a certain product category to a country jor may not a or a . Recently, models have been developed which rely on the extensive margin to explain the changes in the trade volumes. The theoretical models as Melitz (2003), predict that changes in the underlying fundamentals of an economy, for example changes in tariffs due to FTAs, have an effect on the extensive margin.
Thus, in order to understand export diversification, it is important to understand its microeconomic determinants. The flawless dataset to deal with export diversification issues from a microeconomic point of view should be made up of firm-level export data for each country pair.
Unfortunately, such data are not available to researchers, so it is a common practice to use the highest level of internationally comparable disaggregated country level trade data that are available. The 6- digit level of the Harmonized System (HS) from UN Comtrade database is one of the most reliable sources for this kind of trade data. This study source is Trade Map of International Trade Center, whose data is based on UN Comtrade. The data period is from 2001 to 2011 due to the availability of data in the source and to keep consistency in the study.
This study uses HS 6-digit level export data among China, Japan and Korea and their major export partners. The highly disaggregated data is used in order to pick up the extensive margin of export, i.e. the range of products that one country export to another. At this level of disaggregation there are many zeros in the trade matrix due to the fact that countries export only a subset of goods to each partner. With the help of recent trade models as Melitz (2003) the existence of zeros in the trade matrix can be related to the variable and fixed trade costs. The new-new trade theories suggest that the likelihood of observing a zero in the trade matrix increases with the level of trade costs.
Recent research in international trade that use disaggregated data has two major components.
Some studies explore the stylized facts and causes of export diversification and the impact of
diversification on make arguments on the
evolution of export product diversification along the path of economic developments. Studies that
concentrate on the stylized facts of export diversification are again divided into two significant areas.
One strand of the literature has focused on export product diversification in terms of export growth at its extensive margin (new products) and intensive margin (existing products). Another strand of the literature has focused on geographic diversification in terms of entering international markets i.e., the disappearance of numerous zeros in bilateral trade matrixes.
Haveman and Hummels (2001) were the first to point out how many zeros there were in bilateral trade matrices. They did it in the context of a discussion of the adequacy of various complete and incomplete specialization formulations of the gravity equation. But they did not focus on the changing number of zeros in bilateral trade matrices [Evenett & Venables, 2002]. With limited theoretical guidance and more descriptive statistics, recent studies of export diversification have revealed a wealth of new stylized facts. The trend of using increasingly disaggregated data discovered surprising patterns of export entrepreneurship among the countries. In the field of export studies, decompositions of export growth into intensive and extensive margins have revealed many interesting patterns.
This research revisits the issue of export diversification from product s point of view and its determinants for China, Japan and Korea using the highest disaggregated level export data. This study particularly follows the recent trend of measuring the margins by looking at the number of active export lines in the export list of a country. The extensive margin of export simply counts the number of active lines as mentioned and if the number increases, it considers that as an increase in the export diversification. The mechanism of this increase is related to the changes of export values from a zero value to some positive value. The extensive margin has been proven useful empirically, in understanding firm-level export patterns [Melitz, 2003] and the growth in aggregate trade volume.
To understand where the changes in diversification (if any) coming from, it is necessary to [Klinger & Lederman, 2011]. This study acknowledges that there is a problem of using export data rather than firm level production data, for example, a product emerging as a new export may have been produced domestically for some time and therefore would not represent a genuine discovery.
Even so, exporting a particular good for the first time is itself an entrepreneurial act that requires discovery and can be imitated, even though that product was produced domestically [Klinger &
Lederman (2011); Ibeh (2003)]. Moreover, a number of researches these days have emphasised on product variety and the extensive margin of trade while considering the act of exporting as discoveries or export diversification worth investigating [e.g., Hummels & Klenow, 2005].
Due to its focus on export diversification and calculation of new goods, this research is also related to the literature that utilizes disaggregated trade data to study the influences of the intensive
and extensive margins of trade to export growth as in Hummels and Klenow (2005), Besedes and Prusa (forthcoming), Klinger and Lederman (2011), among others. In this study the intensive margin refers to the growth of exports of existing products and extensive margin refers to the emergence of newly exported products [Klinger and Lederman, 2011]. This research also characterizes export diversification in terms of trade growth at the extensive ( new goods ) margin. These terminologies follow the definition of Hummels and Klenow (2005); Cadot, Carrère, and Strauss-Kahn (2011);
Baldwin and Di Nino (2006); Amurgo-Pacheco (2006); Amurgo-Pacheco and Pierola (2008).
Accordingly, the definition of intensive margin refers to diversification of export values among active product lines and extensive margin refers to addition of new product lines.
The exporters of this study are China, Japan and Korea as mentioned above and there are twenty partner countries for each corresponding exporter. The set of countries includes Asian and outside Asian (n-Asia for this thesis) economies and also have a variety in their development status.
The twenty-one countries that are studied in this research are: Australia, Canada, China, Germany, Hong Kong SAR,China (hereafter Hong Kong), India, Indonesia, Italy, Japan, Korea, Malaysia, Mexico, Netherlands, Philippines, Russian Federation, Singapore, Thailand, United Arab Emirates, United Kingdom, United States, and Vietnam.
Recent models of trade with heterogeneous firms suggest that trade costs and market entry barriers should be negatively associated with the range of products exported by countries. The only trade costs that have been considered by the empirical literature on extensive margin growth are international transport charges and tariff. This study includes other fixed costs to investigate the hypothesis; those are cost of export and cost of starting business at home country; and cost of import at the destination market. Countries should also focus on discrete changes in which liberalization switches some goods from non-traded to traded status. If governments need to increase diversification in particular margins, they should take care of different factors affecting different margins of export diversification. Helpman et al. (2008) argues that estimates of the impact of trade resistance measures or trade costs provide important information. For this reason, it is important to obtain reliable estimates of effects of those trade barriers (trade costs) or trade enhancers (FTAs) on international trade flows.
The study finds that there are changes in the diversification pattern of China, Japan and Korea.
Destination country size and distance of the market are always important determinants for export diversification as found in the study. It also finds supportive results with the thesis hypothesis that, FTAs and export costs affect export diversification significantly. The study confirms that FTAs increase the probability of exporting new varieties of export to the trade list of these countries. At the same time, the extensive and intensive margins of export share are concentrated in some few sectors
like machinery, metal and related products, minerals and chemicals. The findings of this study confirm that export diversification in both margins are significantly influenced by all trade barriers and enhancers, for all three exporters.
1.2 Objectives of the Study
Although empirical trade literature has a long history, research about export diversification with respect to intensive and extensive margins of growth in international trade has started only a few years ago, both theoretically and empirically. With this background, this study is a contribution to the existing academic efforts that use highly disaggregated trade data, to explore the patterns and determinants of export diversification in China, Japan and Korea. Particularly this study has following 4 objectives:
1. To observe the evolution of export diversification using extensive and intensive margins of export, during the last eleven years (2001-2011) for China, Japan and Korea with their major export partners.
2. To investigate the differences in export diversification patterns between China, Japan and Korea using highly disaggregated export data.
3. To understand the determinants of export diversification in China, Japan and Korea with their major export partners during the study period. In particular, the impact of trade cost variables in creating trade in new varieties.
4. To investigate whether there are differences in findings due to the use of different levels of data.
1.3 Hypotheses
To achieve above objectives of this study, the following hypotheses have been derived:
Trade will be most intensive among countries with similar demand structure due to a large overlap of production and consumption patterns; and this overlap of demand can be seen in terms of product variety or diversified trade.
Greater variety in export is associated with reduction of export costs.
o Trade liberalization through FTA reduces export cost and induces export diversification.
o Reduced export costs through improved trade facilitation helps to increase export varieties.
1.4 Research Questions
The main overarching theme of this study is related to explore patterns and determinants of export diversification in China, Japan and Korea in particular. To address this theme, based on the objectives and hypotheses above, this study attempts to answer the following overarching question:
What is the pattern of export diversification in China, Japan and Korea with their major trade partners and what factors are affecting the scenario?
Sub questions: following sub questions are asked to answer the overarching research question:
Chapter 2:
Why diversification is important?
Why using disaggregate level data is important to study export diversification?
Why it is important to study extensive and intensive margins of export diversification?
Chapter 3:
What is the pattern of export diversification?
Within exporting countries: China, Japan, Korea Within destinations: Asia and non-Asia
Within diversification: Extensive and Intensive margins of export
Where are the changes? What products are bringing these changes of export diversification?
How important are these margins of export to the total export growth?
Chapter 4:
What are the determinants of total exports in numbers and in values?
Why does country iexport a very diverse good bundle to country jwhile it exports only a handful of product categories to countryk?
Chapter 5:
What are the determinants of positive exports and zero exports?
Are the factors affecting at the aggregate and disaggregate level have similar impact on export diversification?
1.5 Significance of the Study
Bilateral as well as world trade flows evolve at two margins, the extensive and the intensive.
The product level extensive margin of a bilateral trade flow captures how many different product varieties are shipped, while the corresponding intensive margin represents the total value of shipments in each product variety. Therefore, the diversity of bundle of goods or the extensive margin of trade is the driving force behind the diversification of trade growth. It helps to understand how much a country export a very diverse good bundle to some country while the same country exports only a handful of product categories to some other country. Therefore, the identification of the determinants of extensive margins of international trade is important as it focuses on how diversified or intense, in terms of product varieties, international trade relations are.
This study has chosen three Asian countries that accounts for a very significant share of world export. According to WTO international trade statistics 2012, the top ten merchandise traders accounted for over half (51%) of the world s total merchandise trade in 2011 and China, Japan and Korea are three of them. Most of the existing studies estimate the gravity equation on large group of countries and on only positive trade flows. This study argues that, by disregarding the zero export flows, specifically for these three countries in East Asia, these studies give up important information contained in the data set. Thus the existing studies produce biased estimates of export diversification for these countries. To correct these biases, this study follows the new-new trade theory proposed by Melitz (2003) that predicts positive as well as zero export flows between countries. Thus this study exploits the information contained in the data sets of these economies with the help of this theory.
This study uses the export data that are drawn from ITC, trade map, which is originally gathered from United Nations COMTRADE database under the Harmonized Commodity Description and Coding System (HS) available for most countries at the 6-digit level (more than 5000 products).
These UN Comtrade data have been widely used to analyze export dynamism and growth, geographic pattern of export distribution and other trade issues; but Klinger and Lederman (2004) used this data for the first time to study the emergence of new exports. However, using the data of ITC is not claimed by any other literature so far. Therefore, this study gives an attempt to research in the similar field and contribute to the export diversification literature by using a new source of data.
This study uses HS 6-digit level export data among China, Japan and Korea and their major export partners. The highly disaggregated data is used in order to pick up the extensive margin of export, i.e. the range of products that one country export to another. At this level of disaggregation there are many zeros in the trade matrix due to the fact that countries export only a subset of goods to each partner. With the help of recent trade models as Melitz (2003) the existence of zeros in the trade matrix can be related to the variable and fixed trade costs. The new-new trade theories suggest that the likelihood of observing a zero in the trade matrix increases with the level of trade costs.
Helpman et al. (2008) explained theoretically and empirically that drop in trade costs not only raise trade from country pairs that traded before the drop in trade costs but also that some countries start trading with one another. They also find that the extensive margin is especially important in determining the response of trade flows across country pairs because it generates substantial heterogeneity across country pairs. International transport charges and tariffs are the only trade costs that have been considered by the empirical literature on extensive margin growth.
Existing literature that consider various cost factors as barriers to trade do not specifically cover individual country cases of China, Japan and Korea. In addition, they do not cover time series or panel data analysis for the barriers to trade and export diversification. This study estimates the effect of export, import and starting business cost on extensive and intensive margins of export. These cost data are compiled from World Bank Doing Business database available from 2005 to 2011.
Under the circumstances, this research is expecting to contribute to the international trade literature by including the export diversification and trade cost relations in China, Japan and Korea.
Although studies for group of countries or developed and developing country studies were already done for similar purposes; several arguments can be presented to support the significance of this thesis which is as follows:
Previous literature on East Asian export diversification did not thoroughly study the intensive and extensive margins of export, particularly for China, Japan and Korea.
Existing studies did not use HS 6-digit level data for similar purpose and comparatively aggregated data were used to investigate trade structure.
Consequently, the existence of zeros in the trade matrix is ignored by the existing literature.
The effect of FTAs or trade liberalization and other fixed costs of export on export diversification were not discussed in these three country context before.
1.6 Contributions of the Research
This dissertation is a contribution to the existing academic efforts to explore recent trend of export diversification. By presenting and discussing new stylized facts on the differences in diversification patterns and determinants of China, Japan and Korea, this paper contributes to the export diversification literature in academic, empirical and practical level.
First, academically, it adds knowledge to the similarities as well as differences in the patterns of diversification in China, Japan and Korea to their major partners using time data on exports over the period 2001-2011. While it is generally granted that export diversification is good for a country s economic performance, theoretical and empirical uncertainties still exist on the precise nature of the patterns and determinants of export diversification. This study thus discusses these uncertainties, and studies the cases of three major economies in East Asia and their major export partners. Most of the focused on their export performance and determinants. Very few recent studies began to investigate their diversification and specialization patterns.
Second, empirically this research provides evidence of export diversification using intensive and extensive margins. The qualitative methodology used to calculate extensive margin exploited internationally comparable level of disaggregated export data that is HS 6-digit. Diversification is traditionally measured by concentration indexes such as a Gini or a Herfindhal index that are computed on the distribution of exports by sectors. Nevertheless, recent studies have the trend to use an index of discovery which is a counting of the new exports using highly disaggregated data. This study uses export data from the ICT Trade Map database which is also based on UN Comtrade database. To the knowledge of this study, the data source had not been used before to study the emergence of new exports.
Finally, this study contributes practically by investigating microeconomic determinants of export diversification using highly disaggregated data. Existing studies do similar research using intensive or total export value or aggregate level data. Chapter four of this thesis contributes to the existing literature by finding the determinants of export diversification at the aggregate level for both intensive and extensive margin. Existing literature only accounts for the intensive margin and does not consider the extensive margin in the similar context. The contribution of chapter five is in using the highly disaggregated data where the changes of the export matrix with respect to zero and positive values are taken care of. Previous studies ignored the existence of zeros in the export list which is a very important matter to research about. Moreover, with the help of appropriate statistical methodology (Tobit estimation), the determinants that influence the probability of changes in both
intensive and extensive margins are presented in this chapter. This also adds value to the thesis by enriching the knowledge of determinants of export diversification for these three countries, namely, China, Japan and Korea. Therefore, this study contributes to the literature in this field by answering the question, whether the determinants of intensive and extensive margins of export are different?
This study thus attempts to contribute to the existing literature of export diversification with empirical evidence to the understanding of the determinants of export diversification in China, Japan and Korea with their major export partners during the period of 2001 to 2011.
1.7 Organization of the Thesis
This study is divided into six chapters. It begins with this introductory chapter, Chapter 1.
Chapter 2 starts with the conceptual discussions about export diversification. Then it describes various measurement techniques of traditional and recent trends for export diversification. Additionally, the chapter briefly surveys the existing literature in the related topic like export diversification and growth, determinants of export diversification, theoretical motivation, studies in East Asian export diversification and FTAs. Chapter 2 also discusses the gap in the existing literature and how this study attempts to fill the gap in the field of international trade by export diversification research.
Chapter 3 describes the definition of diversification used in this study. It also explains methodological specifications for data and selection of countries for this study. This chapter presents detail descriptions of patterns and evolution of export diversification for China, Japan and Korea.
Export diversification trends are presented along the study time period using number of export and also sectoral distribution. While presenting each exporting country trends, this chapter uses Asian and non-Asian partner specific export diversification to observe regional differences. Numbers of new goods are calculated for all three exporters that occur over the eleven years of study period. Moreover, which products are bringing changes in the export diversification structure among these new goods are presented in this chapter. After that, how much share these new goods have in the growth of total export is calculated to see the importance of these goods. Finally this chapter finds out the development and export diversification relations for China, Japan and Korea following existing research and discusses the scenario. Chapter 3 concludes with remarks from the findings of the qualitative studies observed in the chapter.
Chapter 4 examines the changing patterns and evolution of export over time while disentangling the intensive and extensive margins of export using aggregate level data. Based upon the observations in the patterns, several determinants are introduced in this chapter as control variables and also variables of interest. This chapter then undertakes a statistical approach and
analyses the results using aggregate export data. After that, chapter 4 concludes with the effects of different factors on export diversification of China, Japan and Korea at the aggregate level. Finally, this chapter identifies and analyses differences within the findings among the exporters.
In chapter 5, Melitz (2003) model is described along with additional explanation of the model revised by other researchers. Following the theoretical presentation, this chapter conducts statistical tests using highly disaggregated export data on several determinants that are introduced in the previous chapter as control variables and also variables of interest. The chapter conclusion presents the analyzed results in relation to the three exporters and destinations, to better understand what factors influence firm level decisions for export diversification.
Chapter 6 starts with summarizing the main findings of the study from each chapter. It also presents some concluding remarks based upon the findings of the study. Finally this chapter acknowledges the limitations of the study and then points out possible future research following this study.
Chapter 2. Literature Review
2.1 Conceptualizing Export Diversification
Expanding international trade has been considered as an important policy for economic growth especially in many developing countries. And export diversification is seen as an important channel through which trade fuels economic growth. This growth is brought by facilitating improvements in productivity, by capturing economies of scale, and by curbing volatility. Raul Prebisch and Hans Singer argued that specialization in primary products would lead to secular falls in the purchasing power of primary exports. Since then, diversifying out of primary products into manufactures has been a major policy objective of developing countries. In the past 25 years, many developing countries have become less dependent on a narrow range of primary products [Newfarmer, Shaw &
Walkenhorst, 2009].
Changes in technology and investments in infrastructure stimulated many developing countries, to achieve significant export diversification over the past two decades. Chandra, Boccardo, and Osorio (2008) observe that some degree of export diversification has been widespread. They measured export diversification by the Herfindahl index and found that almost 60 percent of the developing countries diversified their export baskets in the past 30 years to some extent. Their findings also reveal that export diversification was evident in both middle- and low-income countries.
However, many countries have failed to take advantage of the great potential for further diversification. This failure was evidenced by the limited penetration of countries existing products into new markets. In addition, few low-income countries have made almost no progress in diversification, while a few initially upper-middle-income countries, like the Republic of Korea and Singapore, have begun specializing in high-tech exports [Newfarmer, Shaw & Walkenhorst, 2009].
When exports are concentrated volatility in export prices, sudden closure of export markets triggered by regulatory changes, entry of new competitors, supply shocks at home all of these are taken as threatening dimension even though these are part of the normal course of event on international markets. Therefore, low-income countries are concern about the vulnerability that arises from export concentration [Cadot, Carrère & Strauss-Kahn, 2012].
The risks of economies at an early stage towards growth and stability of an excessive concentration of the primary products exports have been highlighted by Prebisch (1950) and Singer (1950). But the effect of export diversification goes far beyond the logic of portfolio recently emphasized by Acemoglu and Zibilotti (1997); Kalemi-Ozcan, Scorensen, and Yosha (2003);
Levchenko and Di Giovanni (2010). It is also considered as a vector of long-term growth as it produces new complementarities between new and former activities [Nicet-Chenaf & Rougier, 2011].
Consequently, export diversification ensures sustainable economic growth as it unleashes productivity-inducing externalities and facilitates progressively more rapid moves into higher value- added production, less macroeconomic volatility, and less elite misappropriation of rents associated with a narrower economic base. Furthermore, while there is no easy instruction to promote diversification, a broad array of policies can make a difference. These policies might range from getting the incentive structure right, lowering the costs of trade-related services and other proactive policies. Such policies can help a country s exporters upgrade existing products, break into new geographic markets, and promote and merge new lines of business abroad.
Diversification can take the form of breaking into new product markets or into new geographic markets. The importance of diversification for development lies into the fact that while developing countries have achieved significant export diversification, there is enormous potential for further progress. If this progress is realized, that would likely lead to faster sustained growth. In one sense, the causality runs from growth to diversification, at least up to some level of income. But in another sense, diversification into new products and geographic markets can lead to higher sustained growth.
Researchers [Amurgo-Pacheco & Pierola (2008); Kehoe & Ruhl (2009)] believe that the value of trade between two countries can grow in two ways, one is intensive margin and the other one is extensive margin. When countries export more of the goods they had already been trading, is termed as growth on the intensive margin. On the other hand, when countries begin exporting goods they had not been previously trading, is known as the growth on the extensive margin. This classification is well suited to discuss diversification issues from a product point of view and does not consider geographic dimension.
Measuring diversification
There are several techniques of measuring export diversification used by the researchers. For example:
Share of the largest products: This index is the share of a country s total exports accounted for by the largest products. Studies base this measure on the three, or ten largest products. The higher the shares of these products the higher is the level of export concentration.
Overall indices: The most frequently used concentration indices are: Herfindahl, Gini, and Theil. All concentration indices are basically used to measure inequality between export shares.
Intensive and extensive margins: When export concentration is measured at the HS six-digit level, an active line corresponds to a non-zero export line of the HS6 nomenclature for a given year. Diversification at the intensive margin means convergence in export shares among goods that were exported at t0, during a period t0to t1. On the other hand, diversification at the extensive margin means a rising number of active export lines.
Quantitative measures of trade diversification that is mostly borrowed from the income- distribution literature, mostly measures concentration. These measures show that their evolution along the path of economic development shows a striking non-monotonicity znets [Cadot, Carrère & Strauss-Kahn, 2012]. All concentration indices basically measure inequality between export shares; these shares can be defined at any level of aggregation but the finer the disaggregation, the better the measure. The most frequently used concentration indices are Herfindahl, Gini, and Theil.
For a given country and year, the Herfindahl index of export concentration, normalized to range between zero and one, is given by the following formula (omitting country and time subscripts):
H =
where sk= is the share of export line k(with amount exported ) in total exports andnis the number of export lines.
For the Gini index, several equivalent definitions have been used in the literature, among which one of the simplest can be calculated by first ordering export items (at the appropriate level of aggregation) by increasing size (or share) and calculating cumulative export shares Xk = . The Gini coefficient is then
G = 1 - .
entropy index (Theil, 1972) is given by
T = where µ = .
index has the property that it can be calculated for groups of individuals (export lines) and decomposed additively into within-groups and between-groups components (i.e., the within- and between-groups components add up to the overall index). Specifically, Let nbe the notional number of export (e.g., the 5016 lines of the HS6 nomenclature or the total number of potential trade partners), njthe number of export lines in groupj, the average dollar export value, jgroup j
export value, andxkthe dollar value of export linek.
because of its classification rules administered by World Customs Organization (WCO). As a result, Gini indices are close to one and do not fluctuate much whereas Theil and Herfindahl indices are more expressive.
Empirical work on export diversification use indices to measure diversification, such as Herfindahl index of export values across a given range of products or sectors. This type of measures are intuitively appealing as they are designed to pick up the extent to which different countries rely more or less heavily on small range of products for the bulk of their export earnings, but these measures are theoretically informal [Dennis & Shepherd, 2011]. From a theoretical viewpoint, intensive and extensive margins are the two mechanisms by which such measures of diversification can increase. As explained by Dennis and Shepherd (2011), intensive margin is one possibility when export goods at low aggregate values grow more quickly than those goods at high aggregate values.
This kind of diversification does not involve exporting any new products. The other method through which diversification can increase is the extensive margin, which introduces new products into a
its diversification level, keeping all else constant.
The shift in export composition from primary commodities to manufactured goods is also considered as export diversification. Such a process inevitably encompasses extensive margin diversification and that is the core concept from a development policy perspective. Therefore, this study focuses exclusively on the extensive, or new goods , margin.
The link between trade diversification, income and growth is further understood by the intensive and extensive margins of trade diversification. Intensive margin helps to relate the changes in diversification among a set of goods that are commonly traded over the period. On the other hand,
extensive margin relates the effect of newly traded or disappearing goods and/or trade partners on diversification. It is very important to understand which margin is the stronger driving force of growth to design export promotion policies. The reason of market failures for these two margins might be different. For example, growth in the extensive margin that is exporting new products or breaking into new destination markets may consist of overcoming informational externalities. In contrast, growth in the intensive margin or the rise in the trade volume may entail different types of hurdles, for example, credit rationing.
Product level extensive margin
The product level extensive margin of countryi jis the one of the interests of this study. It captures how many of the domestically produced varieties country idoes export to countryj. The simplest approach to construct this variable is to count the product categories in which exports ij are positive. Thus, the measure for the extensive margin reflects how many varieties are exported to j among which overall exports of i. The extensive margin has been proven useful in understanding firm-level export patterns [Melitz, 2003] and the growth in aggregate trade volume.
Defining the products involved is the crucial step in measuring the degree of concentration or diversification of exports and imports. Using different definitions might obtain different results thus whatever classification of commodities is adopted, it is essential that it should be consistently applied to both exports and imports says Michaely (1958). He also added that to make meaningful international comparisons, the same classification must be used throughout. Fortunately, this can be done at present as United Nations records and provides international standard disaggregated trade data.
2.2 Disaggregated Data
In terms of simplest characterization, export diversification means an increase in the range of products a country exports. Therefore, the most obvious approach to measurement is to count the number of exported products for each country. However, this approach is not as simple as it seems because individual products identified in the trade data usually contains a number of distinct varieties. The most detail trade data available on a worldwide basis are at the six-digit level of Harmonized System (HS), and make a distinction amongst more than 5000 different products. HS or Harmonized System is an international nomenclature for the classification of products. It allows participating countries to classify traded goods on a common basis for customs purposes. At the international level, the Harmonized System for classifying goods is a six-digit code system.
Nevertheless, counts of export diversification based on six-digit data are likely to understate the true level of export diversity due to aggregation effects [Dennis & Shepherd, 2011].
At the six-digit level data, which is a very disaggregated trade nomenclature, countries have a large number of product lines with small trade values, while a relatively limited number of the product lines account for the bulk of all countries trade [Cadot, Strauss-Kahn & Carrere, 2007]. This might be explained by the fact that the harmonized system used by COMTRADE is driven from nomenclatures originally designed for tariff-collection purposes rather than to generate meaningful economic statistics. Thus, there is a large number of economically irrelevant categories e.g. in the textile- clothing sector while economically important categories in machinery, vehicles, computer equipment etc. are endured together in enormous lines.
The HS comprises approximately 5000 article/product descriptions that appear as headings and subheadings, arranged in 96 chapters, grouped in 21 sections. The six digits can be broken down into three parts. The first two digits (HS-2) identify the chapter the goods are classified in, e.g. 09 = Coffee, Tea, Maté and Spices. The next two digits (HS-4) identify groupings within that chapter, e.g. 09.02 = Tea, whether or not flavored. The next two digits (HS-6) are even more specific, e.g. 09.02.10 Green tea (not fermented) in immediate packing of a content not exceeding 3 kg. Up to the HS-6 digit level, different countries classification codes are identical. Beyond this, countries are free to introduce national distinctions for tariffs by adding more digits to make the HS classification of products even more specific.
Another widely used classification is Standard International Trade Classification (SITC). The characteristics of the SITC
commodity groupings of SITC reflect (a) the materials used in production, (b) the processing stage, (c) market practices and uses of the products, (d) the importance of the commodities in terms of world HS contributes to the harmonization of customs and trade procedures and the non-documentary trade data interchange in connection with such procedures, thus reducing the costs related to international
according to their stage of fabrication, their use, or origin. The Harmonized System nomenclature is
Therefore, HS is commonly used for economic analysis because it comprises about 5,000 commodity groups (each identified by a six digit code), greatly excee
3,100 groups. This study thus uses HS classification for the calculation of extensive and intensive margins of export for China, Japan and Korea.
The calculation of the extensive margin of export may be sensitive to the level of aggregation at which it is measured. For instance, as explained by Hummels and Klenow (2005), a country may export total variety V = NI, where I is the observable categories of goods. As data become more
aggregated, variety shifts from the observable category Ito the unobservable Ncategory. If the two- digit level internationally comparable export data is used, it is possible to find that most of the countries produce and export in all sectors. That finding will lead to observing less extensive margin (new export goods) and more intensive margin (existing export goods). Therefore, by using more detail export data with more than 5000 six-digit categories, a better job of assigning variety difference to the extensive margin can be done.
2.3 Importance of Export Diversification
For the academic trade economist, export diversification is not a natural objective by itself, as trade theory is based on the principle that specialization according to comparative advantage is optimal. Although theoretical guidance on normative questions (whether and how much diversification should be sought, and how) is limited, empirical interest in trade diversification is not (1958) work [Cadot, Carrère & Strauss-Kahn, 2012]. Recently interest has renewed under the compulsion of both empirical and theoretical advances.
Recent international trade theory provides two additional gains from trade that are not present in traditional trade models, by incorporating monopolistic competition in the model. Krugman (1980) presents homogeneous firms monopolistic competition model and shows that gains come from consumers to whom new foreign varieties become accessible. The other source of gains from trade is explained by Melitz (2003) model that use heterogeneous firm s model where trade induces self- selection of more efficient firms. Studies [Feenstra & Kee, 2008] show that the relative total factor productivity increases with the relative export variety, with the help of Melitz (2003) model. In short, variety remains the key determinant of gains from trade and what should be the distribution of gain between consumers and producers, depends on the specification of model.
Yokohama and Alemu (2009) highlights several essential channels through which diversification may stimulate growth or income. Firstly, diversification can increase the productivity of the factors of production by acting as an input of production itself. Secondly, it can increase income by expanding the possibilities to spread investment risks over various portfolios of economic sectors.
Thirdly, diversification contributes to the total factor productivity (TPF) growth and thus to economic growth. Moreover, diversification has positive effect on growth because of economies of scale in production. These economies of scale occur when the same inputs generate greater per unit profits which spread across multiple outputs than dedicated to any one output. Finally, production of a diversified export structure is likely to provide stimulus for the creation of new industries and expansion of existing industries by forward and backward linkages.