タイトル
The Impact of the EU-U.S. TTIP on ASEAN’s
Exports
著者
Uprasen, Utai
引用
北海学園大学経済学会, 64(4): 45-60
《特別寄稿》
The Impact of the EU-U.S. TTIP on ASEAN`s Exports
Utai Uprasen
Division of International and Area Studies College of Humanities and Social Sciences Pukyong National University, KOREA
Abstract
An EU-U.S. TTIP is under negotiation and it is expected to be in force by 2018. Since the U.S. is the major export competitor of ASEAN countries in the EU market, the implementation of an FTA agreement may have negative effects on exports from ASEAN to the EU market. This paper aims to identify the potentially-affected industries of ASEAN in the event of the application of such an FTA. Two approaches are employed in the study. The degree of export competition is observed through the elasticity of substitution approach, while the export threats are measured by the rivalry threat index (RTI index). The value of the elasticity of substitution between the export quantity and the price variable is estimated at the SITC 2-digit industry level for 17 major industries, using monthly time series data covering the period 2000-2015. The empirical findings show that ASEAN countries have higher degrees of competitiveness in exports in comparison to those of the U. S. in various industries, especially in SITC71 (power-generating machinery). Nonetheless, the ASEAN countries may not be able to compete with exports from the U.S. in various industries such as SITC75 (office machines), SITC78 (road vehicles) and SITC79 (other transport equipment). The findings from the RTI index at the 3-digit level of industry indicate that the high degree of export threat emanating from exports of the U.S. occurs in various industries such as SITC751 (office machines), SITC895 (office and stationery supplies) and SITC718 (power-generating machinery).
JEL classifications: F10, F14, F15
Keywords: Export competition, Elasticity of substitution, Rivalry threat index, EU-US TTIP, ASEAN
Ⅰ.Introduction
The European Union (EU) and the United States of America (U.S.) have been negotiating to establish a Transatlantic Trade and Investment Partnership (TTIP) or an EU-U.S. Free Trade Agreement (FTA) since 2013. Both tariffs and non-tariffs barriers will be reduced significantly between the EU and the U.S. Accordingly, a significant increase in trade volume between both entities is expected. This will pose a threat to exports from The Association of South East Asian Nations (ASEAN), composed of ten countries: Brunei, Cambodia, Indonesia, Laos, Malaysia, Myanmar, the Philippines, Singapore, Thailand and Vietnam as the engines of the economic growth of these countries rest mainly on exports. The reason is that the patterns of trade between the U.S., the EU and ASEAN countries (see section 2) show that the EU is the second largest export destination of ASEAN while the EU is also the second largest export destination of the U.S. In addition, the export structure from ASEAN to the EU is similar to the export structure from the U.S. to the EU market. Hence, the evidence implies that ASEAN may compete fiercely in exports to the EU market in certain product group vis-à-vis the exports from the U.S. The U.S. will turn out to be a stronger competitor of ASEAN for its exports after the implementation of the FTA.
To know in which industries ASEAN has higher (and lower) export competitiveness against the U. S. will help ASEAN determine its proper trade strategy in the EU market after the application of the EU-U.S. FTA. Therefore, this article investigates the degree of export competition between ASEAN and the U.S. in the EU market by employing two approaches. First, the degree of export competition is measured through the value of the elasticity of substitution between the export quantity and the price variable. The refined demand model is adopted in the study. The regression estimation is conducted at the SITC 2-digit industry level for the major exporting industries of ASEAN to the EU market. Second, the patterns of export competition are further observed at the SITC 3-digit industry level by calculating the rivalry threat index (RTI index). The rest of the paper is organized as follows. Section 2 describes the patterns of trade between ASEAN, the U.S. and the EU. Section 3 reviews the literature on export competition. Section 4 outlines the methodology upon which this study is based, while the results of the study are presented in section 5. Section 6 outlines the conclusions of the research.
Ⅱ.Patterns of trade: ASEAN, the U.S. and the EU
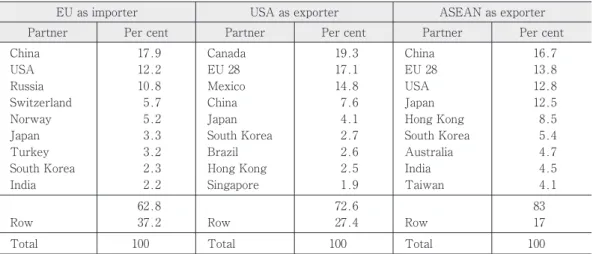
This section illustrates patterns of trade between the U.S., the EU and ASEAN countries in detail. According to Table 1, the EU is the second largest export destination of ASEAN (accounts for 13.8 per cent of total exports), behind China (16.7 per cent). The EU is also the second largest export destination of the U.S. (17.1 per cent of total exports), behind Canada (19.3 per cent). In addition, Table 2 shows that the export structure from ASEAN to the EU is similar to the export structure from the U.S. to the same destination. The main export products from both ASEAN and the U.S. to
EU destination are machinery and transport equipment (SITC7) and miscellaneous manufactured articles (SITC8).
The above-mentioned two groups of products account for approximately 52 per cent of the U.S.`s total exports to the EU and account for 67 per cent of ASEAN` s total exports to the same destination, respectively. The evidence implies that ASEAN and the U.S. may compete strongly in exports to the EU market in these two product groups. Given the significance of the EU market for ASEAN and also the high degree of similarity of export structures between the U.S. and ASEAN countries, the EU-U.S. FTA agreement may have a considerable negative impact on exports of ASEAN to the EU market.
The potential increase in trade between the EU and the U.S. emanating from the FTA application
Table 1. Patterns of trade: USA, EU28, ASEAN10, 2015 (per cent)
EU as importer USA as exporter ASEAN as exporter Partner Per cent Partner Per cent Partner Per cent
China 17.9 Canada 19.3 China 16.7
USA 12.2 EU 28 17.1 EU 28 13.8
Russia 10.8 Mexico 14.8 USA 12.8
Switzerland 5.7 China 7.6 Japan 12.5
Norway 5.2 Japan 4.1 Hong Kong 8.5
Japan 3.3 South Korea 2.7 South Korea 5.4
Turkey 3.2 Brazil 2.6 Australia 4.7
South Korea 2.3 Hong Kong 2.5 India 4.5
India 2.2 Singapore 1.9 Taiwan 4.1
62.8 72.6 83
Row 37.2 Row 27.4 Row 17
Total 100 Total 100 Total 100
Source: Author`s calculations based on the data from EUROSTAT ComExt
Table 2. Export structures, classified by industry in 2015 (per cent)
SITC Industry ASEAN 10 USA
0 Food and live animals 7.6 3.2
1 Beverages and tobacco 0.2 0.7
2 Crude materials, inedible, except fuels 2.7 4.3 3 Mineral fuels, lubricants and related materials 1.6 8.0 4 Animal and vegetable oils, fats and waxes 4.9 0.1 5 Chemicals and related products, n.e.s. 8.8 22.5 6 Manufactured goods classified chiefly by material 6.3 6.6 7 Machinery and transport equipment 43.9 39.4 8 Miscellaneous manufactured articles 23.4 12.6 9 Commodities not classified elsewhere in the SITC 0.4 2.6
Total 100.0 100.0
may reduce exports from ASEAN countries to the EU market, especially in the two main product groups: SITC7 and SITC8. Accordingly, this study aims to identify the industries of ASEAN countries which may encounter the greatest competition vis-à-vis the U.S. on exports to the EU market after the EU-U.S. FTA comes into force.
Ⅲ.Literature review
The current literature related to the research can be broadly grouped into three categories. The first category includes previous studies on the elasticity of substitution approach, while the second category involves the export threat index. The third category describes the existing literature on the export competitiveness of ASEAN countries.
First, according to basic economic theory, the degree of competition in exports between two countries in a third market can be represented through the value of the elasticity of substitution of the export quantity of the two countries with respect to the price. A high value of elasticity of substitution implies that one country`s exports can easily substitute another country`s exports when the price is changed. Therefore, if the value of the elasticity of substitution is greater than one (elastic), it indicates that the reviewed country has a higher degree of competitiveness in exports against its competitor in a third market. The model which has been used to measure the elasticity of substitution between goods or markets is a demand model (Tinbergen, 1956; Harberger, 1957). It is taken from the classical school of economics which states that only the demand side plays a role in the economy and that the supply side plays no role. The goods used in their model are homogeneous. This indicates that there is no difference between the goods which are produced in the different countries (Leontief, 1936; Brakman and Jepma, 1990). The above model has been modified by taking into account the concept of consumers` recognition of the difference between domestic goods and imported goods (Armington, 1969). The framework of the elasticity of substitution has been employed in researching export competition in various studies. Kang (2008) estimated the elasticity of substitution between exports and prices in order to measure the export competition between Korea and China in the U.S. market during 1998-2008. A study on export competition between Latin American countries and China in the U.S. market was also conducted by López-Córdova et al. (2008). The same concept has been refined substantially by Benkovskis and Wörz (2013) to investigate the non-price competitiveness in the exports of nine emerging economies.
Second, apart from the studies which were based on regression estimation, the studies which focused at the disaggregate level of industry have been generally conducted by calculating certain trade indices. Normally, trade competitiveness is examined through the Kreinin and Finger`s export similarity index or K-F index (Kreinin and Finger, 1979). However, it measures the similarity between the composition of exports of two countries rather than the degree of competition between them. Fung and Iizaka (1998) took the difference in size of exports from two
countries into account in their rivalry index (R index). However, this formula only provides a single value of the degree of rivalry between a pair of exporting competitors. Accordingly, Andreosso-O`Callaghan and Uprasen (2012) developed the rivalry threat index (RTI index) in order to measure the degree of export competition between two exporting countries in a third market. The index provides different values for each exporter depending on the size of exports. Hence, the RTI index will be employed in this study.
Third, in previous studies on export competitiveness of ASEAN countries, the statistics on exports to the world market showed that Singapore had the strongest presence in global markets at around 2 per cent, follows by Malaysia (1.4 per cent), Thailand (1 per cent), Indonesia (0.8 per cent) and the Philippines (0.6 per cent). However, Cambodia, Laos, Myanmar, Vietnam and Brunei had the weakest positions of the ASEAN countries in global export markets, with approximately around 0. 05 to 0. 2 per cent (Wong et al., 2011). At the industry level, Singapore remained competitive in the export of high-end intermediate electronics components, which are characterized by automation-intensive processes (Wu and Loy, 2003). Beņkovskis and Wörz (2015) constructed an export price index to measure price and non-price competitiveness during 2000-2011. The results indicated that Vietnam significantly maintained international competitive-ness in respect of the non-price factors, while these factors decreased in competivecompetitive-ness for Singapore.
Since China has increased its export role to become the largest exporter in the world, the export competition between ASEAN countries and China has been scrutinized. Shafaeddin (2004) found that the export competition between China and Thailand was very significant in clothing (SITC843), miscellaneous household equipment (SITC775), and electric machinery (SITC778), while it was significant in furniture (SITC821) in respect of China and Indonesia. Moreover, ASEAN countries (especially Malaysia, Singapore, and Thailand) faced a major challenge with their exports of computer components vis-à-vis China since China has significantly increased its share of global computer components production (Fry, 2010).
The export competition between ASEAN members in the East Asian market has been researched by He (2012). The study showed that in terms of market share, Indonesia and Malaysia hold the biggest portions in East Asia. However, the dynamic shift-share analysis suggested that the Philippines, Thailand and Malaysia improved their positive competitiveness effects during 1998-2007.
Apart from the East Asian market, considering the export competition between ASEAN nations, Singapore possessed the highest degree of export competitiveness in office and data machines in the U. S. and Japanese market during 1986-1995, while Indonesia had the highest degree of competitiveness in the lower value-added category of apparel and clothing (Wilson and Mei, 1999). Nonetheless, when the export competition between China and the ASEAN countries in the U.S.
market was explored, Singapore faced the highest degree of export competition with China mostly in manufacturing sectors while it was also in competition in primary goods with Indonesia, Malaysia, the Philippines and Thailand (Liu and Ng, 2010).
In the case of the EU market, the export competitiveness of Singapore, Thailand and Malaysia in the EU market as well as in the U.S. and Japan between 1983 and 1995 has been analyzed by Wilson (2000). The study showed that both of Singapore and Malaysia retained a very strong export competitiveness in office and data processing machines (SITC75) in the EU market. In addition, Malaysia had an export competitiveness in apparel and clothing (SITC84) and in electrical machinery (SITC77) in the USA and the EU. In the EU market, Thailand also displayed competitiveness in apparel and clothing (SITC84), telecommunications and sound equipment (SITC76) and in miscellaneous manufactures (SITC89).
In summary, the study of export competition at industry level between ASEAN and other competitors, especially vis-à-vis the U.S., in the EU market is scarce. Only one such study has been conducted and that was for the period 1983-1995. Therefore, this study investigates the export competition between ASEAN and the U.S in the EU market by using the up-to-date data for the period 2000-2015.
Ⅳ.Methodology
To examine the export competition between ASEAN and the U. S., the study employs two approaches. First, the elasticity of substitution between exporting products from ASEAN and the U.S. into the EU market is estimated. Second, the threat to ASEAN exports is calculated based on the RTI index.
1. Estimation of elasticity of substitution: A demand model
In this study, the demand model is employed to estimate the elasticity of substitution. The model was developed by Tinbergen (1956) and Harberger (1957). The elasticity of substitution can be presented as the following:
X=F(Y) where X=
Q
and Y=
where, Qand Q are the amounts of each good, and Pand Pare the respective prices. The
elasticity of substitution (e) can be derived as:
e=
However, in order to estimate the elasticity of substitution by running the regression, the elasticity should be specified in the logarithmic (or log) form. Thus, the log form of the elasticity ( ) is specified as:
=d
ln
ln
Based on the log form of the elasticity of substitution, the value of can be estimated by using the following equation:
ln
= +
ln
+ (1)where is the constant term and is the error term.
In general, the level of income and the exchange rate as well as the price level of imported goods can be considered as the main factors to determine a country`s demand for imported goods from foreign countries. Therefore, equation (1) is modified by introducing the income level of the importing country and the exchange rate. It turns into equation (2):
ln
AQUQ
= +
ln
AEVUEV
+ ln(Y) +
ln
EXAEXU
+ (2)where,
AQ = quantity of ASEAN`s goods exports into the EU market UQ = quantity of the U.S.`s goods exports into the EU market AEV = price of ASEAN`s goods exports into the EU market UEV = price of the U.S.`s goods exports into the EU market
Y = income (proxied by the industrial production index) of the EU countries EXA = exchange rate between ASEAN and the EU countries
EXU = exchange rate between the U.S. and the EU countries
= elasticity of substitution between both countries` exports to the EU market = error term
Equation (2) is used to estimate the elasticity of substitution between exports from ASEAN and the U.S. into the EU market at SITC 2-digit industry level. The expected sign of is negative. This is because if the price of export products from ASEAN increases, the demand for imports to the EU market from ASEAN should reduce. However, the size of the estimated elasticity through equation (2) shows the intensity of the competitive relationship between ASEAN`s and the U.S.`s exports into the EU market. If the value of in equation (2) is greater than one (elastic), this means that a small reduction in the price of the ASEAN product encourages a significant increase in exports from ASEAN, relative to the exports from the U.S. Hence, the high value of implies that the ASEAN commodity has a higher competitiveness in comparison to the one from the U.S. in the EU market. For , it is expected to have a positive value as depreciation of currency promotes
exports. However, the sign of is unpredictable. Increases in the income of the importing country
should create higher demand for imports. The value of the sign of depends on the magnitude of
2. Degree of export threat
In order to investigate the patterns of export competition at the disaggregated level, this study analyses the degree of export threat at the SITC 3-digit industry level. The rivalry threat index (RTI) is designed to measure the degree of the export competitive threat at the level of each single industry. Let countries A and B export product i to the same destination country C. The RTI from the point of view of country A is calculated as follows:
RTIAB⊥C=
1-
XAC-XBC
XAC+XBC
*XAC
XAZ (3)
where,
RTIAB⊥C= rivalry threat index between A and B in destination C, from the point of view of
exporting country A
XAC = exports of product i from exporting country A to destination country C
XBC = exports of product i from exporting country B to destination country C
XAZ = exports of product i from exporting country A to any destination z; therefore XAZ
represents the exports of product i from country A to the world and XAC
XAZ is the share of exports
of product i from country A to destination country C relative to total exports of product i by country A. The latter ratio represents the relative size of the export market of product i from the point of view of country A. The value of RTI rests between zero and one. The higher the value of RTI, the greater the degree of export rivalry threat (from the point of view of a particular exporting country), and the value is equal to zero otherwise.
3. Data
The following are data descriptions. The data are used in two sections: the estimation of the elasticity of substitution and the calculation of the RTI index. First, data for the estimation of the elasticity of substitution are monthly time series data. The sample period of the study covers the year 2000:1 to 2015:12 for the estimations of equation (2). The dataset covers 17 major export industries from ASEAN and from the U.S. to the EU market, based on the Standard International Trade Classification (SITC Rev.3). The estimation is conducted at the SITC 2-digit industry level for SITC7 (machinery and transport equipment) and SITC8 (miscellaneous manufactured articles). They are: SITC71 (power-generating machinery), SITC72 (machinery for particular industries), SITC73 (metalworking machinery), SITC74 (general industrial machinery), SITC75 (office machines), SITC76 (telecommunications equipment), SITC77 (electrical machinery), SITC78 (road vehicles), SITC79 (other transport equipment), SITC81 (prefabricated buildings), SITC82 (furniture, and parts thereof), SITC83 (travel goods, handbags), SITC84 (articles of apparel), SITC85 (footwear), SITC87 (scientific and controlling instruments), SITC88 (photographic apparatus) and SITC89 (miscellaneous manufactured articles). The data on the quantity of exports (tons) and value of exports from ASEAN and from the U.S to the EU market are collected from the EUROSTAT databases. Due to limited data availability, there are only 5 ASEAN exporters in the regression estimation: Indonesia, Malaysia, the Philippines, Singapore and Thailand. The
importers comprise 5 major EU countries: Germany, France, United Kingdom, Netherlands and Sweden.
The empirical estimations constitute 960 observations per single industry. Because of the unavailability of the real price of aggregated exports, the study follows the method which is suggested by Richardson (1972): that the data on the price of export commodities can be proxied by the unit value (value of exports/quantity of exports). The estimation in this study is conducted by using the monthly time series data. However, the data on the income (GDP) of the EU country are available as annual and quarterly data. Therefore, the industrial production index is used as a proxy for the EU income in this study. The industrial production index and the data on the bilateral exchange rate between ASEAN countries and the EU member states and between the U.S. and the EU countries also come from the EUROSTAT databases.
Second, in respect of the data for calculating the RTI index, the index is calculated at the SITC 3-digit industry level for 17 major export industries as mentioned above. The export data are obtained from the EUROSTAT and UN Comtrade databases.
Ⅴ.Estimation results
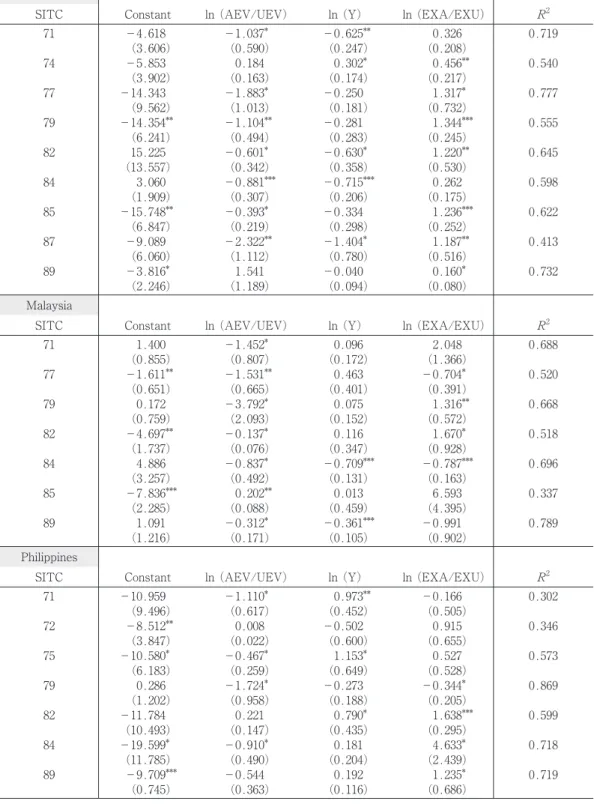
The study makes estimates for 17 major export industries from ASEAN and from the U.S. to the EU market. To avoid spurious results, the method of Levin et al. (2002) is adopted to test for stationarity of the data before running the panel model. If the data are not stationary, the panel co-integration test by following the Kao (1999) technique is performed. Only industries which pass either the stationarity test or the co-integration test are estimated under the fixed effects model (information on stationarity and co-integration tests can be obtained from the author upon request). The empirical results are presented in Table 3.
According to Table 3, in each industry, the estimated coefficients are presented together with the value of the standard errors of the coefficient. Regression results indicate that most of the values of the elasticity of substitution in the model have the expected (negative) signs, even though there are differences in the magnitude of the elasticity across industries and across ASEAN countries. When the values of the coefficients of the elasticity of substitution are scrutinized closely, all five ASEAN countries have a higher degree of export competitiveness against the U.S. (absolute value of the coefficient is greater than one) in SITC71 (power-generating machinery). In addition, except for the Philippines, the other four countries have a higher degree of export competitiveness in SITC79 (other transport equipment). Malaysia has the highest value of elasticity (-3.792) for this industry. This means that a decrease in the export price by 1 per cent gives rise to an increase of 3.972 per cent in the export quantity of other transport equipment products. In the other words, a small reduction in the price of the Malaysian product encourages a significant increase in exports from Malaysia relative to the exports from the U. S. It indicates that Malaysia has a higher
Table 3. Empirical results, 2001:1-2015:12
Indonesia
SITC Constant ln (AEV/UEV) ln (Y) ln (EXA/EXU) R2
71 -4.618 -1.037* -0.625** 0.326 0.719 (3.606) (0.590) (0.247) (0.208) 74 -5.853 0.184 0.302* 0.456** 0.540 (3.902) (0.163) (0.174) (0.217) 77 -14.343 -1.883* -0.250 1.317* 0.777 (9.562) (1.013) (0.181) (0.732) 79 -14.354** -1.104** -0.281 1.344*** 0.555 (6.241) (0.494) (0.283) (0.245) 82 15.225 -0.601* -0.630* 1.220** 0.645 (13.557) (0.342) (0.358) (0.530) 84 3.060 -0.881*** -0.715*** 0.262 0.598 (1.909) (0.307) (0.206) (0.175) 85 -15.748** -0.393* -0.334 1.236*** 0.622 (6.847) (0.219) (0.298) (0.252) 87 -9.089 -2.322** -1.404* 1.187** 0.413 (6.060) (1.112) (0.780) (0.516) 89 -3.816* 1.541 -0.040 0.160* 0.732 (2.246) (1.189) (0.094) (0.080) Malaysia
SITC Constant ln (AEV/UEV) ln (Y) ln (EXA/EXU) R2
71 1.400 -1.452* 0.096 2.048 0.688 (0.855) (0.807) (0.172) (1.366) 77 -1.611** -1.531** 0.463 -0.704* 0.520 (0.651) (0.665) (0.401) (0.391) 79 0.172 -3.792* 0.075 1.316** 0.668 (0.759) (2.093) (0.152) (0.572) 82 -4.697** -0.137* 0.116 1.670* 0.518 (1.737) (0.076) (0.347) (0.928) 84 4.886 -0.837* -0.709*** -0.787*** 0.696 (3.257) (0.492) (0.131) (0.163) 85 -7.836*** 0.202** 0.013 6.593 0.337 (2.285) (0.088) (0.459) (4.395) 89 1.091 -0.312* -0.361*** -0.991 0.789 (1.216) (0.171) (0.105) (0.902) Philippines
SITC Constant ln (AEV/UEV) ln (Y) ln (EXA/EXU) R2
71 -10.959 -1.110* 0.973** -0.166 0.302 (9.496) (0.617) (0.452) (0.505) 72 -8.512** 0.008 -0.502 0.915 0.346 (3.847) (0.022) (0.600) (0.655) 75 -10.580* -0.467* 1.153* 0.527 0.573 (6.183) (0.259) (0.649) (0.528) 79 0.286 -1.724* -0.273 -0.344* 0.869 (1.202) (0.958) (0.188) (0.205) 82 -11.784 0.221 0.790* 1.638*** 0.599 (10.493) (0.147) (0.435) (0.295) 84 -19.599* -0.910* 0.181 4.633* 0.718 (11.785) (0.490) (0.204) (2.439) 89 -9.709*** -0.544 0.192 1.235* 0.719 (0.745) (0.363) (0.116) (0.686)
competitiveness against exports from the U. S. to the EU market in this industry. Indonesia, Singapore and Thailand also show a higher degree of competitiveness in SITC87 (scientific and controlling instruments), while both Malaysia and Indonesia exhibit a higher degree of competitiveness in SITC77 (electrical machinery).
The empirical findings show that the values of elasticity are less than one (inelastic) in six industries. This means that the U.S. possesses a higher degree of export competitiveness against the ASEAN countries. Apart from Singapore, the U. S. has a higher degree of export competitiveness against the other four ASEAN countries in SITC84 (articles of apparel). The U.S. has a higher degree of export competitiveness against Indonesia and Thailand in SITC85 (footwear) and against Indonesia and Malaysia in SITC82 (furniture, and parts thereof). Moreover, the values of the elasticity are less than one in SITC75 (office machines) for the Philippines, SITC78 (road vehicles) for Singapore and SITC89 (miscellaneous manufactured articles) for Malaysia. The coefficients of income show mixed results. The empirical results show that the exchange rate determines exports of ASEAN countries in a few industries. However, the role of the exchange rate in determining exports is relatively obvious in the case of Indonesia.
Singapore
SITC Constant ln (AEV/UEV) ln (Y) ln (EXA/EXU) R2
71 -0.908 -1.728*** -0.125 0.184 0.744 (0.732) (0.494) (0.157) (0.128) 76 -5.846*** -0.618 0.459* 3.338* 0.540 (1.124) (0.425) (0.242) (1.854) 78 -5.846 -0.618* 0.459* 3.338* 0.742 (6.502) (0.343) (0.242) (1.854) 85 1.204 0.169** -1.259** 4.506 0.242 (2.215) (0.073) (0.476) (3.004) 87 -3.276*** -1.559* 0.079 0.163 0.765 (0.565) (0.866) (0.122) (0.104) Thailand
SITC Constant ln (AEV/UEV) ln (Y) ln (EXA/EXU) R2
71 1.592 -1.903* 1.176** -2.364 0.706 (1.005) (1.057) (0.511) (2.668) 77 0.280 -0.743 0.558** -1.195 0.378 (1.351) (0.744) (0.213) (0.796) 79 -0.071 -2.649** -0.201 0.235* 0.710 (0.815) (1.120) (0.136) (0.121) 84 -0.444 -0.958* -0.314** 0.455 0.815 (0.902) (0.536) (0.157) (0.303) 85 -1.880** -0.725** -0.433 1.401* 0.616 (0.813) (0.302) (0.289) (0.779) 87 -3.924 -0.445** 0.190** 0.377* 0.717 (2.616) (0.204) (0.073) (0.199) Note 1: The dependent variable is ln (AQ/UQ)
Note 2: Statistical significance is denoted as (***) 1%, (**) 5%, (*) 10%.
Table 4. Rivalry threat index (RTI*) SITC Industry 2005 2007 2009 2011 2013 2015 Indonesia 712 Steam turbines 0.1 0.1 0.1 0.3 0.1 0.1 761 Television receivers 0.3 0.3 0.2 0.4 762 Radio-broadcast receivers, 0.1 0.2 0.2 0.1 0.2 0.2 763 Sound recorders 0.1 0.1 0.1 0.1 0.1 0.1 771 Electric power machinery 0.1 0.1 0.1 0.1 821 Furniture and parts thereof 0.3 0.4 0.4 0.3 0.3 0.3 831 Trunks, suitcases, vanity cases 0.5 0.4 0.2 0.3 0.5 0.5 841 Men`s or boys` coats, jackets 0.1 0.1 0.1 0.1 0.0 0.1 842 Women`s or girls` coats, jackets 0.1 0.1 0.1 0.1 0.2 0.1 844 Women`s or girls` coats, jackets 0.1 0.1 0.1 0.1 0.1 0.1 845 Articles of apparel, of fabrics 0.2 0.2 0.2 0.1 0.1 0.1 846 Clothing accessories, of fabrics 0.5 0.5 0.4 0.4 0.3 0.3 848 Articles of apparel 0.3 0.3 0.3 0.2 0.3 0.3 894 Baby carriages, toys, games 0.1 0.1 0.1 0.1 0.1 898 Musical instruments and parts 0.1 0.1 0.2 0.2 0.1 0.1
Malaysia
746 Ball- or roller bearings 0.1 0.1 0.1 0.1
751 Office machines 0.3 0.2 0.8 0.8 0.5 0.8 759 Parts and accessories 0.2 0.3 0.2 0.3 0.3 763 Sound recorders 0.1 0.1 0.1 0.1 0.1 0.1 764 Telecommunications equipment 0.1 0.2 0.2 0.5 0.3 0.3 771 Electric power machinery 0.1 0.1 0.1 0.1 0.0 0.1 775 Household-type electrical equip 0.1 0.1 0.2 0.2 0.2 0.2 776 Thermionic, cold cathode 0.2 0.1 0.2 0.2 0.1 0.1
778 Electrical machinery 0.1 0.1 0.1 0.1
785 Motor cycles and cycles 0.1 0.1 0.1 0.1 0.1 0.1 812 Sanitary, plumbing, heating fix 0.1 0.1 0.1 0.1
821 Furniture and parts thereof 0.2 0.2 0.2 0.2 0.1 0.1 841 Men`s or boys` coats, jackets 0.1 0.1 0.1 0.1 0.1 0.1 843 Men`s or boys` coats, jackets 0.1 0.1 0.1 0.1 0.2 0.2 844 Women`s or girls` coats, jackets 0.2 0.2 0.2 0.2 0.2 0.1 845 Articles of apparel, of fabrics 0.4 0.4 0.1 0.1 0.1
846 Clothing accessories, of fabrics 0.4 0.3 0.3 0.3 0.2 0.2
851 Footwear 0.4 0.3 0.3 0.1
873 Meters and counters 0.2 0.1 0.1 0.2
893 Articles, n.e.s., of plastics 0.1 0.1 0.1 0.1 0.1
895 Office and stationery supplies 0.1 0.1 0.5 0.5 0.5 0.2 Philippines
714 Engines & motors, non-electric 0.1 0.1 0.4 0.3 718 Power-generating machinery 0.1 0.9 0.5 0.5 747 Taps, cocks, valves 0.1 0.2 0.1 0.1
751 Office machines 0.1 0.1 0.2 0.2 0.6 0.1 761 Television receivers 0.1 0.1 0.1 0.6 0.5 771 Electric power machinery 0.8 0.1 0.1 0.1 0.1 0.2 776 Thermionic, cold cathode 0.2 0.1 0.1 0.2 0.1 0.1 813 Lighting fixtures 0.2 0.2 0.2 0.1 0.1
841 Men`s or boys` coats, jackets 0.1 0.1 0.1 0.3 0.2 0.2 843 Men`s or boys` coats, jackets 0.1 0.1 0.1 0.1 0.1 0.1 845 Articles of apparel, of fabrics 0.3 0.2 0.1 0.2 0.1 0.1 846 Clothing accessories, of fabrics 0.1 0.1 0.1 0.1
848 Articles of apparel 0.2 0.3 0.7 0.2 0.6 0.4 874 Measuring, checking instrument 0.2 0.2 0.1 0.1 0.1
884 Optical goods 0.1 0.1 0.1 0.1
It is worth comparing the results of this study with a previous study. While Wilson (2000) found that both Malaysia and Thailand had an export competitiveness in apparel and clothing (SITC84) during 1983-1995, the empirical results of this study show that it is the U.S. which possesses the highest degree of export competitiveness in the same product during 2000-2015. Nonetheless, Malaysia has maintained the highest export competitiveness in electrical machinery (SITC77) from 1983 to-date.
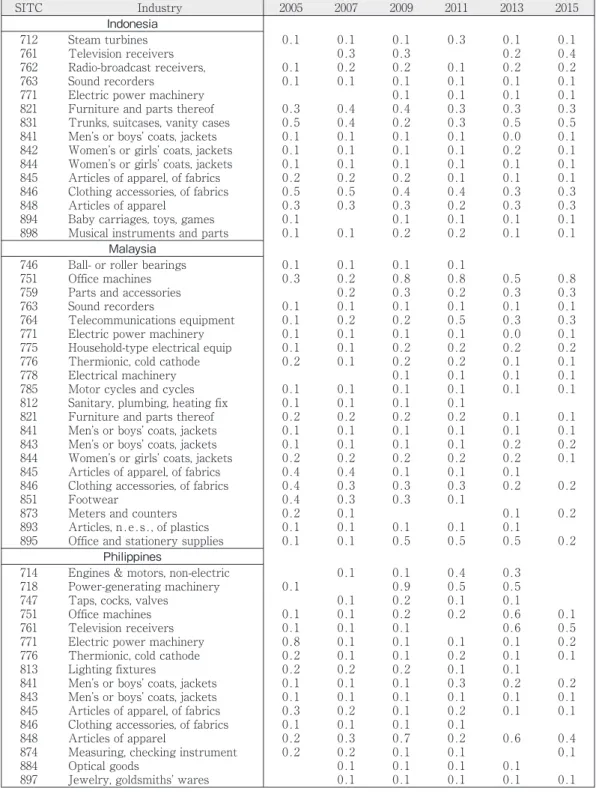
According to Table 4, the patterns of export threat between ASEAN and the U.S. are observed at the disaggregated level of industry. To obtain a clearer picture, the researchers choose to consider only the industries for which the value of RTI is greater than 0.1, for at least four out of the six studied years. The findings indicate that ASEAN countries, especially Thailand, encounter a high degree of export threat mostly in miscellaneous manufactured articles (SITC8).
Nonetheless, the overall image indicates that even though the FTA agreement between the U.S. and the EU creates a rivalry threat on exports from ASEAN to the EU market, the degree of rivalry threat on exports from ASEAN is not extremely high in general. The RTI indices in Table
SITC Industry 2005 2007 2009 2011 2013 2015
Singapore
714 Engines & motors, non-electric 0.1 0.1 0.1 0.1
751 Office machines 0.5 0.6 0.3 0.2
752 Automatic data-processing mach. 0.1 0.1 0.1 0.1 0.1 0.1
793 Ships, boats 0.8 0.1 0.1 0.2 0.3
891 Arms and ammunition 0.2 0.1 0.6 0.7
895 Office and stationery supplies 0.1 0.3 0.4 0.4 Thailand
741 Heating-cooling equip 0.4 0.1 0.2 0.2 0.1 0.1 751 Office machines 0.6 0.5 0.6 0.2 0.2 0.3 752 Automatic data-processing mach. 0.1 0.1 0.1 0.1 0.1 0.1 762 Radio-broadcast receivers, 0.1 0.1 0.1 0.1 0.1
764 Telecommunications equipment 0.1 0.1 0.2 0.1 0.1 0.1 771 Electric power machinery 0.1 0.1 0.1 0.1 0.1 0.1 785 Motor cycles and cycles 0.1 0.1 0.2 0.2 0.1 0.2 812 Sanitary, plumbing, heating fix 0.2 0.1 0.1 0.1 0.1 0.1 821 Furniture and parts thereof 0.2 0.2 0.2 0.2 0.1 0.1 831 Trunks, suitcases, vanity cases 0.2 0.3 0.4 0.3 0.3 0.3 841 Men`s or boys` coats, jackets 0.1 0.1 0.1 0.2 0.2 0.2 842 Women`s or girls` coats, jackets 0.2 0.1 0.2 0.3 0.2 0.1 844 Women`s or girls` coats, jackets 0.1 0.1 0.2 0.1 0.2 0.1 845 Articles of apparel, of fabrics 0.2 0.2 0.2 0.2 0.2 0.2 846 Clothing accessories, of fabrics 0.2 0.3 0.3 0.1 0.1 0.1 848 Articles of apparel 0.2 0.2 0.1 0.1 0.1 0.1
851 Footwear 0.2 0.1 0.1 0.1 0.1 0.2
873 Meters and counters 0.5 0.3 0.2 0.1 0.1
884 Optical goods 0.1 0.1 0.2 0.2 0.1 0.2
894 Baby carriages, toys, games 0.1 0.1 0.1 0.1 0.1 0.1 897 Jewelry, goldsmiths` wares 0.5 0.5 0.3 0.3 0.2 0.2 Source: Author`s calculations based on the data from EUROSTAT and UN Comtrade.
*Only the products with an absolute value of RTI greater than 0.1 for at least 4 out of 6 studied years are reported
4 show that the degree of export competition ranges from 0.1 to 0.3 (10-30 per cent) in general. Only in some selected industries may ASEAN countries encounter fierce competition with the exports from the U. S.: for Indonesia, they are SITC831 (trunks, suitcases, vanity cases) and SITC846 (clothing accessories, textile fabrics); for Malaysia, they are SITC751 (office machines) and SITC895 (office and stationery supplies); for the Philippines, they are SITC718 (power-generating machinery) and SITC848 (articles of apparel); for Singapore, they are SITC891 (arms and ammunition); for Thailand, they are SITC751 (office machines) and SITC897 (jewelry, goldsmiths` wares).
It is worth noting that, according to Liu and Ng (2010), while some ASEAN countries such as Indonesia, Malaysia, the Philippines and Thailand compete fiercely vis-à-vis China on exports of primary goods into the U.S. market, those same ASEAN countries, including Singapore, encounter severe competition on exports of manufactured articles (SITC8) against the exports from the U.S. to the EU market.
Ⅵ.Conclusion
The EU and the U.S. are each other`s major trade partner. An EU-U.S. FTA is under negotiation and it is expected to be in force by 2018. Given that ASEAN and the U.S. have similar export structures vis-à-vis the EU, it is highly possible that the ASEAN countries will encounter threats to their exports to the EU market, emanating from an increase in exports from the U.S. This study attempts to identify the potentially-affected exporting industries from ASEAN`s point of view by employing two approaches. First, the degree of export competition is measured through the value of the elasticity of substitution between the export quantity and the price variable. Second, the rivalry threat index (RTI index) is calculated. The research findings show that ASEAN countries have a higher degree of competitiveness in exports against those of the U.S. in various industries, especially in SITC71 (power-generating machinery), followed by SITC79 (other transport equipment) and SITC87 (scientific and controlling instruments), respectively. Nonetheless, the ASEAN countries may not be able to compete with exports from the U.S. in SITC84 (articles of apparel), SITC82 (furniture, and parts thereof), SITC85 (footwear), SITC75 (office machines), SITC78 (road vehicles) and SITC79 (other transport equipment).
The findings from the calculation of the degree of export threat from the RTI index support the results of the regression estimation, but at the 3-digit industry level: a high degree of export threat occurs in SITC751 (office machines), SITC846 (clothing accessories, textile fabrics), SITC848 (articles of apparel), SITC891 (arms and ammunition), SITC895 (office and stationery supplies) and SITC897 (jewelry, goldsmiths` wares). Furthermore, the degree of export threat is also high in SITC718 (power-generating machinery) and SITC831 (trunks, suitcases, vanity cases).
free trade in the near future. The findings have policy implications: ASEAN countries should support the exports of industries which show high values of elasticity of substitution between the export quantity and the price variable and the industries which show low values on the RTI index in order to be able to compete with exports from U.S. in the EU market after the application of the U.S.-EU FTA agreement. In addition, ASEAN should be prepared to confront fiercer export competition in certain industries where ASEAN does not hold a significant level of export competitiveness and in the industries which display a high degree of export vulnerability.
Bibliography
Andreosso-O`Callaghan, B. and U. Uprasen (2012), lA qualitative analysis of the impact of the fifth EU enlargement on ASEANz, ASEAN Economic Bulletin, 29(1), pp.46-64.
Armington, P. S. (1969), lA Theory of Demand for Products Distinguished by Place of Productionz, International Monetary Fund Staff Papers, 16(1), pp.159-178.
Benkovskis, K. and J. Wörz (2013), lNon-price Competitiveness of Exports from Emerging Countriesz, Working Paper Series no.1612/November 2013, European Central Bank, Germany.
Beņkovskis, K. and J. Wörz. (2015), lSummary Measure for Price and Non-price Competitiveness for ASEAN+3z, Asian Economic Journal, Special Issue: New Industry-Level Analysis in Asia and Europe: Integration, Value Chains and Competitiveness, 29(2), pp.165-180.
Brakman, S. and C. J. Jepma (1990), lOn the Elasticity of Substitution in International Tradez, De Economist, 138, pp.63-72.
Fry, J. (2010), lASEAN: Regional Trends in Economic Integration, Export Competitiveness, and Inbound Investment for Selected Industriesz, Investigation No. 332-511, USITC Publication 4176, U. S. International Trade Commission, Washington DC.
Fung, K. C. and H. Iizaka (1998), lJapanese and US Trade with China: A Comparative Analysisz, Review of Development Economics, 2(2), pp.181-190.
Harberger, A. C. (1957), lSome Evidence on the International Price Mechanismz, The Journal of Political Economy, 65(6), pp.506-521.
He, S. (2012), lCompetition among ASEAN members in the East Asia marketz, Journal of Economic Studies, 39(5), pp.576-589.
Kang, S. J. (2008), lKorea`s Export Performancez Three Empirical Essays, ProQuest publisher.
Kao, C. (1999), lSpurious Regression and Residual-Based Tests for Cointegration in Panel Data,z Journal of Econometrics, 90, pp.1-44.
Kreinin, M. and J. M. Finger (1979), lMeasure of Export Similarity and its possible usesz, Economic Journal, 89, pp. 905-912.
Leontief, W. (1936), lComposite commodities and the problem of index numbersz, Econometrica, 4(1), pp.39-59. Levin, A., C. F. Lin and C. Chu. (2002), lUnit Root Tests in Panel Data: Asymptotic and Finite-Sample Propertiesz,
Journal of Econometrics, 108, pp.1-24.
Liu, Y. and B. K. Ng. (2010), lFacing the Challenge of the Rising Chinese Economy: ASEAN`s Responsesz, Review of Development Economics, 14(3), pp.666-682.
López-Córdova, J. E., A. Micco and D. Molina (2008), lHow Sensitive Are Latin American Exports to Chinese Competition in the U.S. Market?z, Policy Research Working Paper No.4497, The World Bank.
Journal of Economic, 5(3), pp.349-357.
Shafaeddin, S. M. (2004), lIs China`s accession to WTO threatening exports of developing countries?z, China Economic Review, 15, pp.109-144.
Tinbergen, J. (1956), lSome Measurements of Elasticities of Substitutionz, The Review of Economics and Statistics, XXVIII (Aug.), pp.109-116.
Wilson, P. (2000), lThe export competitiveness of dynamic Asian economies 1983-1995z, Journal of Economic Studies, 27(6), pp.541-565.
Wilson, P. and W. Y. Mei. (1999), lThe Export Competitiveness of ASEAN Economies, 1986-95z, ASEAN Economic Bulletin, 16(2), pp.208-229.
Wong, M-H., R. Shankar and R. Toh. (2011), ASEAN Competitiveness Report 2010, Singapore: Asia Competitiveness Institute, Singapore.
Wu, F. and C. B. Loy. (2003), lDeclining Global Market Share of Singapore`s Electronics Exports: Is It a Concern?: Commentaryz, Thunderbird International Business Review, 45(1), pp.1-13.