九州大学学術情報リポジトリ
Kyushu University Institutional Repository
粒子内部に空隙を有する不飽和土の水理特性とその 評価
劉, 士雨
https://doi.org/10.15017/1398339
出版情報:Kyushu University, 2013, 博士(工学), 課程博士 バージョン:
権利関係:Fulltext available.
EVALUATION OF HYDRAULIC PROPERTIES OF UNSATURATED STRUCTURAL SOILS WITH INNER
POROSITY
Shiyu Liu
EVALUATION OF HYDRAULIC PROPERTIES OF UNSATURATED STRUCTURAL SOILS WITH INNER
POROSITY
A Thesis Submitted
In Partial Fulfillment of the Requirements For the Degree of
Doctor of Engineering
By Shiyu Liu
to the
DEPARTMENT OF CIVIL AND STRUCTURAL ENGINEERING GRADUATE SCHOOL OF ENGINEERING
KYUSHU UNIVERSITY Fukuoka, Japan
August, 2013
DEPARTMENT OF CIVIL AND STRUCTURAL ENGINEERING GRADUATE SCHOOL OF ENGINEERING
KYUSHU UNIVERSITY Fukuoka, Japan
CERTIFICATE
The undersigned hereby certify that they have read and recommended to the Graduate School of Engineering for the acceptance of this thesis entitled,
‘‘Evaluation of hydraulic properties of unsaturated structural soils with inner porosity” by Shiyu Liu in partial fulfillment of the requirements for the degree of Doctor of Engineering.
Dated: August, 2013
Thesis Supervisor:
_______________________________
Prof. Noriyuki Yasufuku, Dr. Eng.
Examining Committee:
______________________________
Prof. Guangqi Chen, Dr. Eng.
_______________________________
Prof. Noriaki Hashimoto, Dr. Eng.
_______________________________
Prof. Noriyuki Yasufuku, Dr. Eng.
i
ACKNOWLEDGEMENT
First and foremost, I would like to express my sincere appreciation to my supervisor, Prof. Noriyuki Yasufuku for his constructive guidance and supervision throughout the whole period of my Ph.D. study.
Secondly, special thanks go to Prof. Guangqi Chen, Prof. Noriaki Hashimoto, Prof.
Hamenda Hazarika, Assistant Prof. Ryohei Ishikura, and Associate Prof. Kiyonobu Kasama in Kyushu University, Prof. Kiyoshi Omine in Nagasaki University, Associate Prof. Taizo Kobayashi in Fukushima University, Prof. Xinrong Liu, Prof.
Yongxing Zhang, Associate Prof. Zhongping Yang, Associate Prof. Zuliang Zhong and Associate Prof. Peng Li in Chongqing University, Prof. Xinhong Diao in East China Jiaotong University, Associate Prof. Ming Huang in Fuzhou University, Associate Prof. Jin Yu in Huaqiao University. It must not be forgotten that all the tests conducted in this study would not be possible without the technical support of Mr.
Michio Nakashima in the Geotechnical Engineering Research Laboratory of Kyushu University. Administrative assistance from Ms. Aki Ito during my research is also greatly appreciated.
I would like to extend my sincere gratitude to my research colleague Dr. Qiang Liu, Dr. Jun Tong, Dr. Kohei Araki, Dr. Manandhar Suman, Mr. Jidong Teng, Ms. Jiali Miao, Mr. Handoko Luky, Mr. Zentaro Furukawa, Mr. Zhenbo Jiang, Mr. Yi He, Mr.
Mahmoud Fawzy, Mr. Mohd Khaidir Abu Talib, Mr. Vilayvong, Mr. Shintaro Miyamoto, Mr. Kazuo Kishimoto, Mr. Masafumi Yoshida, Ms. Haruka Kiyotomo, Mr.
Atsushi Shinkai, Mr. Keita Murayama, Mr. Fumio Niiya, Mr. Masataka Iwasaki, Mr.
Keisuke Aotani, Mr. Hiroyuki Okada, Mr. Kenichirou Okumura, Mr. Satoshi Suenaga,
Mr. Guojun Liu as well as many other students in our research group for their kind
help both in the research and life. Life would be half as nice without the support and
understanding from them over the 3 years.
ii
I would like to extend my grateful acknowledgement to China Scholarship Council (CSC) for providing me the opportunity and scholarship to pursue my Ph.D. at Kyushu University.
Finally, I would like to thank my wife and parents for their continuous encouragement
and support in the past years. I appreciate all the things they have done for me.
iii
ABSTRACT
Drylands cover about 41% of Earth’s land surface and are home to more than 38% of the total global population of 6.5 billion. Some form of severe land degradation is present on 10 to 20% of these lands, the consequences of which are estimated to affect directly some 250 million people in the developing world, an estimate likely to expand substantially in the face of climate change and population growth. The United Nations has periodically focused on desertification and drylands, notably adopting the Convention to Combat Desertification in 1992 and designating 2006 as the International Year of the Desert and Desertification.
Because of the serious situation of desertification, prevention of the degradation of
land becomes key issue. Among existed countermeasures, greening is considered to
be one of the most effective methodologies which can protect the biodiversity threaten
by desertification. The conventional revegetation practice has had little or no success
primarily due to the limited soil moisture. Low and sporadic precipitation that occurs
in the arid regions is either not sufficient to support seed germination and plant
development or it comes too late for plants or seeds to survive. In the arid regions
where the groundwater table is relatively shallow, the groundwater can be used as a
main water resource for the plants surviving. However, the water holding capacity and
capillary rise of original soils (single-porosity soils) are limited, which leads to water
stresses in the root zone. It’s one of problems for vegetation restoration to overcome
or mitigate desertification. Diatomite and zeolite can be used as soil amendment to
retain water and plant nutrients in root zone. The high porosity associated with the
inner structure of these materials allows them to retain much water, which can be
released slowly during dry periods. A promising method to reestablish plants could be
effective to use these materials, which have inner porosity, as a material to wick
shallow groundwater to the root zone of the plants. This method could allow for the
reestablishment and sustainability of vegetation in arid areas where the groundwater
table is shallow but not easily accessible by young plants. In order to evaluate
amended effect, the knowledge of hydraulic behavior of original soils and inner
iv
porosity soils is the foundation of seepage analysis in the vadose zone. Although hydraulic properties may be obtained by direct measurements, it is time-consuming, labour intensive and expensive. In this study, alternative theoretical approaches are used to estimate hydraulic properties through the use of more easily measured data.
The dissertation made some original contributions as mainly described in Chapeter 3, Chapeter 5 and Chapeter 6.
In Chapter 1, the research background, sets the research objectives and defines the research scope are introduced. The layout of the thesis is also comprehensively presented.
In Chapter 2, the existing studies are reviewed, including the experimental techniques on hydraulic properties and the pore geometry, and the analytical models for hydraulic properties.
In Chapter 3, the physically based scaling technique was extended to the Arya and
Paris model (AP model) to predict soil water characteristic curves for single-porosity
soils. AP model used to estimate the soil water characteristic curve from particle-size
distribution curve. The basis for this approach is mainly on the shape similarity of the
two curves. An empirical parameter α was introduced in AP model which used to
scale pore attributes from hypothetical formations to natural structures. The parameter
α sensitively affect the predicted results. However, original method to calculate α was
quite complicated. The scaling technique is used to characterize hydraulic properties
of field scale, using measurement scales that are typically much smaller. Kosugi and
Hopmans presented an elegant physically based scaling technique which provides
convenient way to coalesce multiple soil water characteristic curves into a single
reference soil water characteristic curve. In this chapter, the physically based scaling
technique was extended to the AP model to calculate parameter α. Comparing with
original method, this approach simplifies the calculation process. Experimental soil
data which selected from the Unsaturated Soil hydraulic Database are used to verify
proposed approach. Results showed that the physically based scaling technique
improved the AP model accuracy.
v
In Chapter 4, the basic properties of the dual-porosity soils used in the laboratory experiments are presented. Four commercial materials are used in this study, two diatomaceous earth pellets and two zeolites. Particle-size distribution, chemical compositions, inner structure and soil water characteristic of materials were investigated and the results were compared with a single-porosity sandy soil. Results show that the shapes of soil water characteristic curves for dual-porosity soils are bimodal. And the water holding capacity of raw diatomaceous earth and zeolites are higher than sandy soil, even though the particle size of these materials is coarser. The results suggest that raw diatomaceous earth and zeolite could be as sand amendments for revegetation in drylands.
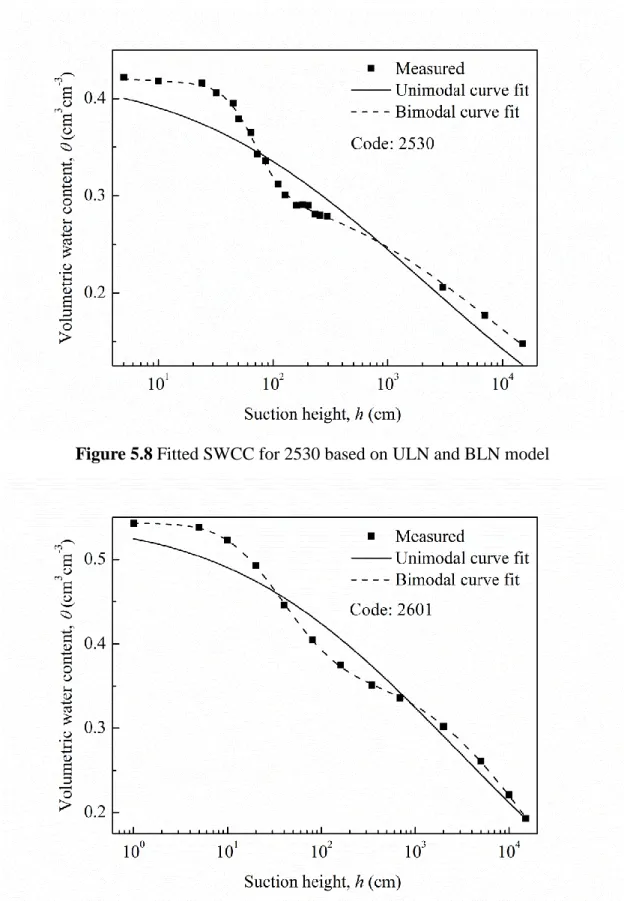
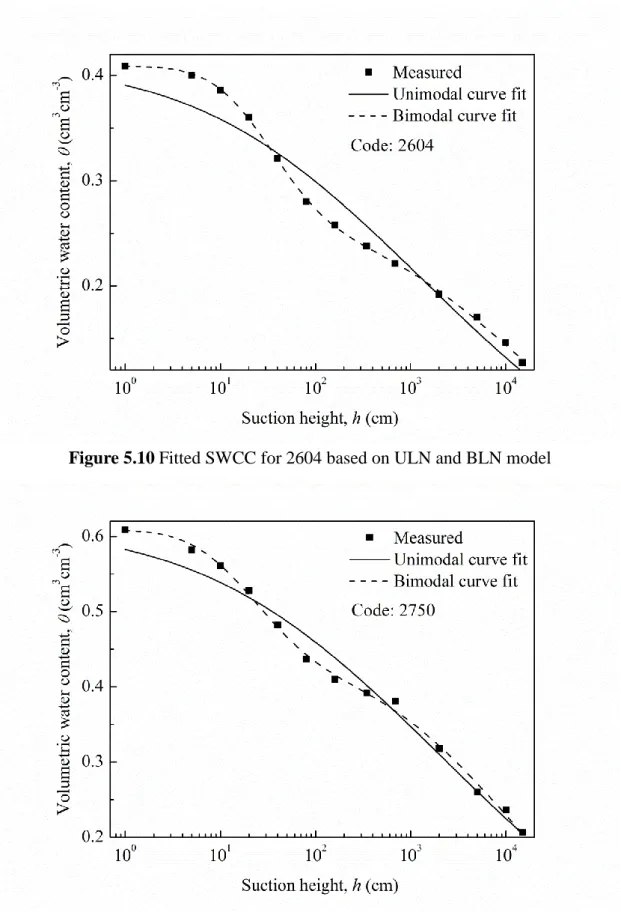
In Chapter 5, a bimodal soil water characteristic curve model is proposed for dual-porosity structural soils. In the last decades, several models have been proposed to describe bimodal soil water characteristic curve. Although these approaches were successfully applied to dual-porosity structural soils, they are lack of a physical basis for their parameters due to the fact that the unimodal SWCC functions which they extended were known as empirical equations. To encounter this problem, a bimodal lognormal soil water characteristic curve model has been proposed in this chapter. It was derived by assuming a lognormal pore size distribution for each pore domains and using weighting factors combined individual functions. The proposed model is defined by parameters that have physical significances which can be related to the distribution of pore morphology of the soil. Experimental data fitting and parametric analyses were used to illustrate the fitting capability of the proposed modle. The proposed approach resulted in good agreement between measurement and simulation.
In Chapter 6, a new function is proposed for predicting unsaturated hydraulic
conductivity of dual-porosity structural soils. Simulation of flow and contaminant
transport through the vadose zone requires knowledge of the soil hydraulic
conductivity. Although hydraulic conductivity may be obtained by direct
measurements, it is time-consuming, labour intensive and expensive. In this chapter, a
new function was proposed for predicting unsaturated hydraulic conductivity of
vi
dual-porosity structural soils based on the bimodal soil water characteristic curve model proposed in Chapter 5. Experimental data verification and parametric analysis are undertaken to demonstrate the fitting and predicting capability of the proposed equations. Results demonstrate that the proposed model improved capability of representations of the hydraulic curves to simulate water flow in structural soils.
These functions can potentially be used as an effective tool for identifying hydraulic properties in structural soils.
Finally, a summary of conclusions and recommendations for further research are
given in Chapter 7.
vii
TABLE OF CONTENTS
CHAPTER 1 INTRODUCTION ... 1
1.1 Research background... 1
1.2 Scope and objectives ... 3
1.3 Layout of thesis ... 3
REFERENCES ... 6
CHAPTER 2 LITERATUREREVIEW ... 7
2.1 Soil water characteristic curve ... 7
2.1.1 Introduction ... 7
2.1.2 Hydraulic hysteresis ... 9
2.1.3 SWCC models ... 11
2.1.4 SWCC measurement techniques ... 13
2.1.5 SWCC prediction based on basic soil properties ... 14
2.2 Unsaturated permeability function ... 15
2.2.1 Introduction ... 15
2.2.2 Measurements of unsaturated coefficient of permeability ... 16
2.2.3 Unsaturated hydraulic conductivity models... 19
2.2.4 Pedo-transfer functions of unsaturated permeability ... 222
2.3 Pore geometry ... 233
2.3.1 Introduction to pore geometry ... 233
2.3.2 Experimental techniques for studying pore geometry ... 24
2.3.3 SWCC prediction from PSD ... 27
2.4 Unsaturated hydraulic properties of structural soils ... 29
2.4.1 Soil water characteristic curve of dual-porosity structure soils ... 29
2.4.2 Unsaturated hydraulic conductivity of structural soils ... 300
2.5 Summary ... 31
REFERENCES ... 333
CHAPTER 3 PREDICTION OF SOIL WATER CHARACTERISTIC CURVE FOR
SINGLE-POROSITY SOILS USING PHYSICALLY BESED SCALING
viii
TECHNIQUE ... 45
3.1 INTRODUCTION ... 45
3.2 MATERIALS AND METHODS ... 46
3.2.1 Experimental data ... 46
3.2.2 Arya and Paris Model... 47
3.2.3 Physically based scaling technique ... 49
3.2.4 Derive α using physically based scaling technique ... 50
3.2.5 Verification ... 52
3.3 RESULES AND DISCUSSION ... 53
3.3.1 Scaling of measured soil water characteristic curves ... 53
3.3.2 Optimal α values (α
opt) ... 60
3.3.3 Verification results ... 64
3.4 SUMMARY ... 72
REFERENCES ... 74
CHAPTER 4 CHARACTERIZATION OF DUAL-POROSITY SOILS ... 77
4.1 INTRODUCTION ... 77
4.2 Materials and methods ... 80
4.2.1 Materials ... 80
4.2.2 Measurement of micro-porosity structure ... 82
4.2.3 Measurement of soil water characteristic curves ... 844
4.3 RESULTS ... 85
4.3.1 Micro-porosity structure ... 85
4.3.2 Soil water characteristic curves ... 88
4.4 SUMMARY ... 911
REFERENCES ... 92
CHAPTER 5 BIMODAL DESCRIPTIONS OF SOIL WATER CHARACTERISTIC CURVES FOR DUAL-POROSITY STRUTURAL SOILS ... 95
5.1 INTRODUCTION ... 95
5.2 METHODS ... 96
ix
5.2.1 Theoretical analysis of dual-porosity structural soils ... 96
5.2.2 Bimodal SWCC function ... 98
5.2.3 Evaluation of the bimodal SWCC model... 101
5.3 RESULTS AND DISCUSSION ... 102
5.3.1 ULN and BLN models fitted results ... 102
5.3.2 BvG and BLN models fitted results ... 109
5.4 SUMMARY ... 112
REFERENCES ... 113
CHAPTER 6 PHYSICALLY BASED CLOSED-FORM EXPRESSION FOR THE BIMODAL UNSATURATED HYDRAULIC CONDUCTIVITY FUNCTION ... 115
6.1 INTRODUCTION ... 115
6.2 METHODS ... 117
6.2.1 Bimodal equations of soil hydraulic functions ... 117
6.2.2 Evaluation of the bimodal hydraulic model ... 120
6.3 RESULTS AND DISCUSSION ... 120
6.3.1 Soil water characteristic curve function ... 120
6.3.2 Unsaturated hydraulic conductivity functions ... 125
6.4 SUMMARY ... 129
REFERENCES ... 130
CHAPTER 7 CONCLUSIONS AND FUTURE WORK ... 133
7.1 Conclusions ... 133
7.2 Future work ... 134
x
xi
LIST OF FIGURES
Figure 1.1 Flowchart of the structure of the dissertation ... 5
Figure 2.1 Idealized soil water characteristic curve ... 8
Figure 2.2 Hydraulic hysteresis ... 9
Figure 2.3 Hysteresis between wetting and drying contact angle of water ... 288
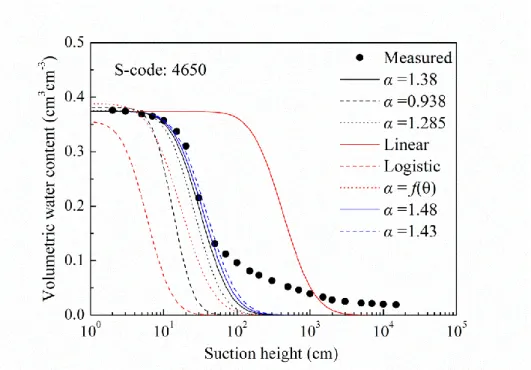
Figure 3.1 Unscaled measured SWCCs for sand ... 54
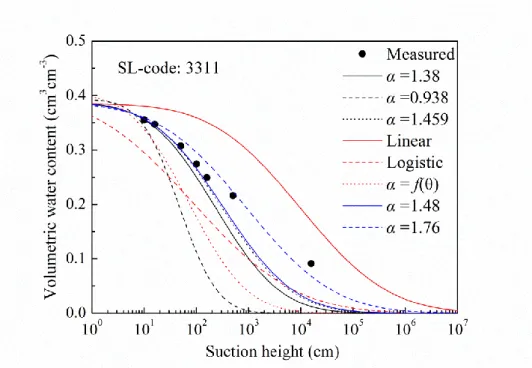
Figure 3.2 Unscaled measured SWCCs for sandy loam ... 54
Figure 3.3 Unscaled measured SWCCs for loam ... 55
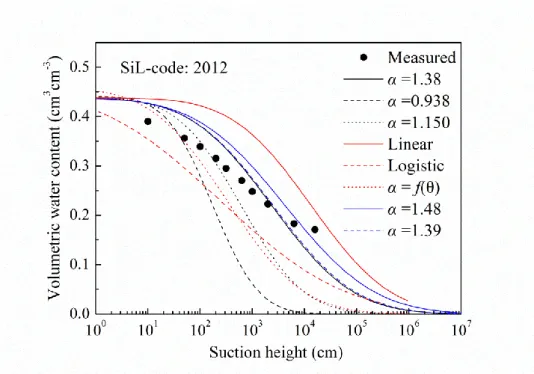
Figure 3.4 Unscaled measured SWCCs for silt loam ... 55
Figure 3.5 Unscaled measured SWCCs for clay ... 56
Figure 3.6 Unscaled measured SWCCs for all soils combined together ... 56
Figure 3.7 Scaled measured SWCCs for sand ... 57
Figure 3.8 Scaled measured SWCCs for sandy loam ... 57
Figure 3.9 Scaled measured SWCCs for loam ... 58
Figure 3.10 Scaled measured SWCCs for silt loam ... 58
Figure 3.11 Scaled measured SWCCs for clay ... 59
Figure 3.12 Scaled measured SWCCs for all soils combined together ... 59
Figure 3.13 Reference SWCC
m, possible reference SWCC
pand optimal reference SWCC
pcorrespond to α
optfor sand ... 61
Figure 3.14 Reference SWCC
m, possible reference SWCC
pand optimal reference SWCC
pcorrespond to α
optfor sandy loam ... 61
Figure 3.15 Reference SWCC
m, possible reference SWCC
pand optimal reference SWCC
pcorrespond to α
optfor loam ... 62
Figure 3.16 Reference SWCCm, possible reference SWCCp and optimal reference SWCCp correspond to α
optfor silt loam ... 62
Figure 3.17 Reference SWCC
m, possible reference SWCC
pand optimal reference
SWCC
pcorrespond to α
optfor clay ... 63
Figure 3.18 Reference SWCCm, possible reference SWCCp and optimal
xii
reference SWCCp correspond to α
optfor all the soils ... 63
Figure 3.19 Comparison of SWCC prediction methods with experimental data for
sand ... 64
Figure 3.20 Comparison of SWCC prediction methods with experimental data for
sandy loam ... 65
Figure 3.21 Comparison of SWCC prediction methods with experimental data for
loam... 65
Figure 3.22 Comparison of SWCC prediction methods with experimental data for
silt loam ... 66
Figure 3.23 Comparison of SWCC prediction methods with experimental data for
clay ... 66
Figure 3.24 Comparison measured and predicted volumetric water content, θ,
using α=1.38 for all testing soils. ... 67
Figure 3.25 Comparison measured and predicted volumetric water content, θ,
using α=0.938 for all testing soils. ... 68
Figure 3.26 Comparison measured and predicted volumetric water content, θ,
using logistic equation for all testing soils. ... 68
Figure 3.27 Comparison measured and predicted volumetric water content, θ,
using linear equation for all testing soils. ... 69
Figure 3.28 Comparison measured and predicted volumetric water content, θ,
using Vaz’s equation for all testing soils. ... 69
Figure 3.29 Comparison measured and predicted volumetric water content, θ,
using α value proposed by Arya et al. for all testing soils. ... 70
Figure 3.30 Comparison measured and predicted volumetric water content, θ,
using α=1.48 for all testing soils. ... 70
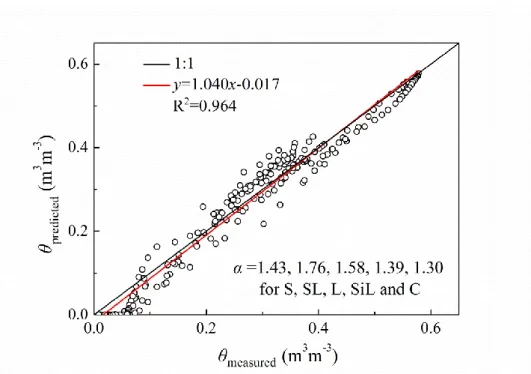
Figure 3.31 Comparison measured and predicted volumetric water content, θ,
using α value for all testing soils. ... 71
Figure 4.1 Photograph of materials ... 81
Figure 4.2 Particle size distribution for diatomaceous earth and zeolites... 81
xiii
Figure 4.3 Photography of Scanning Electron Microscope ... 83
Figure 4.4 Photography of Automated Mercury Porosimeter ... 83
Figure 4.5 Photography of SWCC measurement using Tempe cells ... 84
Figure 4.6 Photography of High Speed Refrigerated Centrifuge ... 84
Figure 4.7 Pore radius distribution by mercury intrusion of diatomaceous earth . 85 Figure 4.8 Pore radius distribution by mercury intrusion of zeolites ... 86
Figure 4.9 Scanning electron photomicrographs of materials ... 87
Figure 4.10 Measured soil water characteristic curve data for RC417 ... 89
Figure 4.11 Measured soil water characteristic curve data for #3000 ... 89
Figure 4.12 Measured soil water characteristic curve data for 2460 ... 90
Figure 4.13 Measured soil water characteristic curve data for 1424 ... 90
Figure 4.14 Measured soil water characteristic curve data for K7 sand ... 90
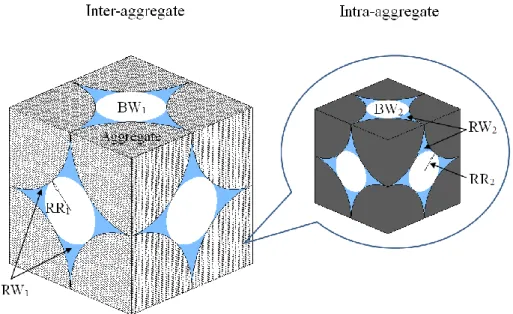
Figure 5.1 Schematic of 3D simple cubic packing of ideal dual-porosity structural soil ... 97
Figure 5.2 Theoretical bimodal SWCC for simple cubic packing geometry, and random packing geometry... 98
Figure 5.3 Construction of a bimodal SWCC function ... 100
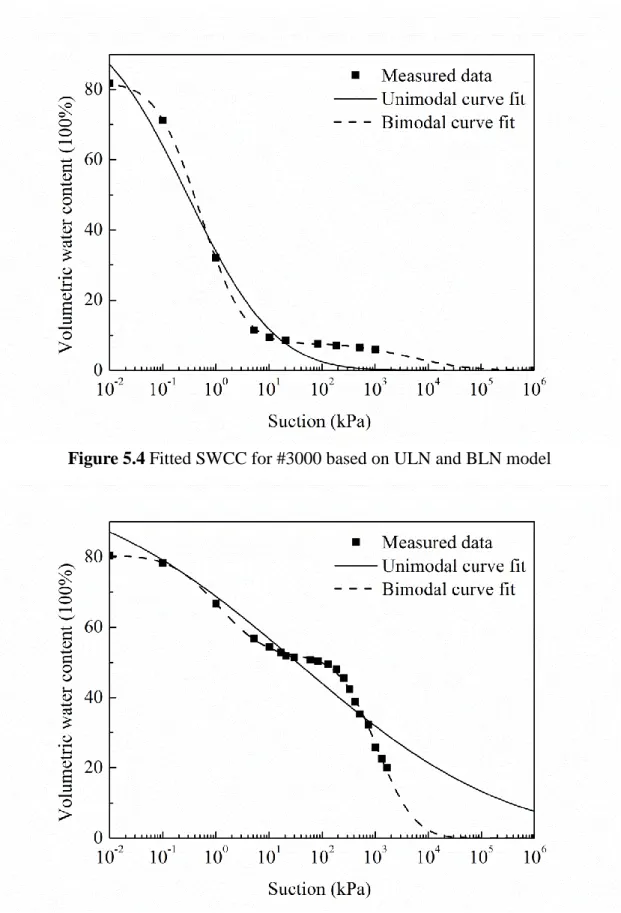
Figure 5.4 Fitted SWCC for #3000 based on ULN and BLN model ... 104
Figure 5.5 Fitted SWCC for RC417 based on ULN and BLN model ... 104
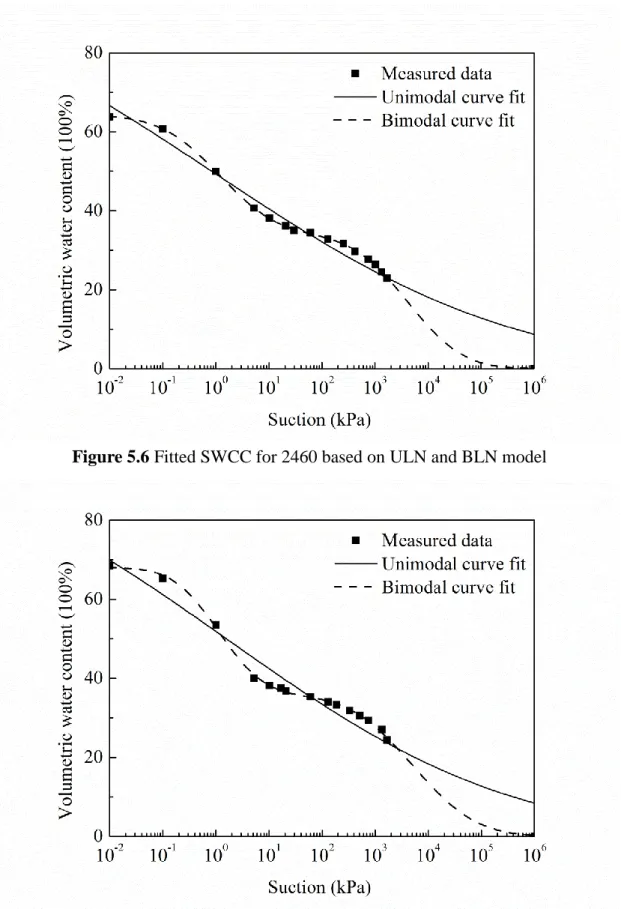
Figure 5.6 Fitted SWCC for 2460 based on ULN and BLN model ... 105
Figure 5.7 Fitted SWCC for 1424 based on ULN and BLN model ... 105
Figure 5.8 Fitted SWCC for 2530 based on ULN and BLN model ... 106
Figure 5.9 Fitted SWCC for 2601 based on ULN and BLN model ... 106
Figure 5.10 Fitted SWCC for 2604 based on ULN and BLN model ... 107
Figure 5.11 Fitted SWCC for 2750 based on ULN and BLN model ... 107
Figure 5.12 Fitted SWCC for 2751 based on ULN and BLN model ... 108
Figure 5.13 Fitted SWCC for 2753 based on ULN and BLN model ... 108
Figure 5.14 Fitted SWCC for CG1 and Sand 20-60 mixtures based on BLN fitting
function ... 110
xiv
Figure 5.15 Fitted SWCC for CG2 and Sand 10-20 mixtures based on BLN fitting function ... 110 Figure 5.16 Fitted SWCC for CG2 and Sand 20-60 mixtures based on BLN fitting function ... 111 Figure 6.1 Fitted SWCC for sample from Smettem and Kirkby (1990) based on ULN, BvG and BLN functions ... 122 Figure 6.2 Fitted SWCC for sample from Mohanty et al. (1997) based on ULN, BvG and BLN functions ... 122 Figure 6.3 Fitted SWCC for sample from Kutí lek (2004) based on ULN, BvG and BLN functions ... 123 Figure 6.4 Fitted SWCC for sample from UNSODA (2751) based on ULN, BvG and BLN functions ... 123 Figure 6.5 Fitted SWCC for sample from UNSODA (2752) based on ULN, BvG and BLN functions ... 124 Figure 6.6 Fitted SWCC for sample from UNSODA (4672) based on ULN, BvG and BLN functions ... 124 Figure 6.7 Predicted hydraulic conductivity curve for sample from Smettem and Kirkby (1990) based on ULN, BvG and BLN models ... 126 Figure 6.8 Predicted hydraulic conductivity curve for sample from Mohanty et al.
(1997) based on ULN, BvG and BLN models ... 126
Figure 6.9 Predicted hydraulic conductivity curve for sample from Kutí lek (2004)
based on ULN, BvG and BLN models ... 127
Figure 6.10 Predicted hydraulic conductivity curve for sample from UNSODA
(2751) based on ULN, BvG and BLN models ... 127
Figure 6.11 Predicted hydraulic conductivity curve for sample from UNSODA
(2752) based on ULN, BvG and BLN models ... 128
Figure 6.12 Predicted hydraulic conductivity curve for sample from UNSODA
(4672) based on ULN, BvG and BLN models ... 128
xv
LIST OF TABLES
Table 2.1 Soil water characteristic curve models ... 12
Table 2.2 Different models for characterizing permeability functions ... 20
Table 2.3 Reviews of bimodal SWCC functions ... 30
Table 3.1 Textural classes and UNSODA codes for samples ... 47
Table 3.2 Represented methods to predict SWCCs according AP model ... 53
Table 3.3 Scaling results for each texture and all soils combined together ... 60
Table 3.4 Optimal α value (α
opt) for each soil each texture and all soils combined
together ... 60
Table 3.5 Comparison of RMSE values for different SWCCs prediction results . 71
Table 4.1 Chemical compositions of materials ... 80
Table 4.2 Physical properties of materials ... 82
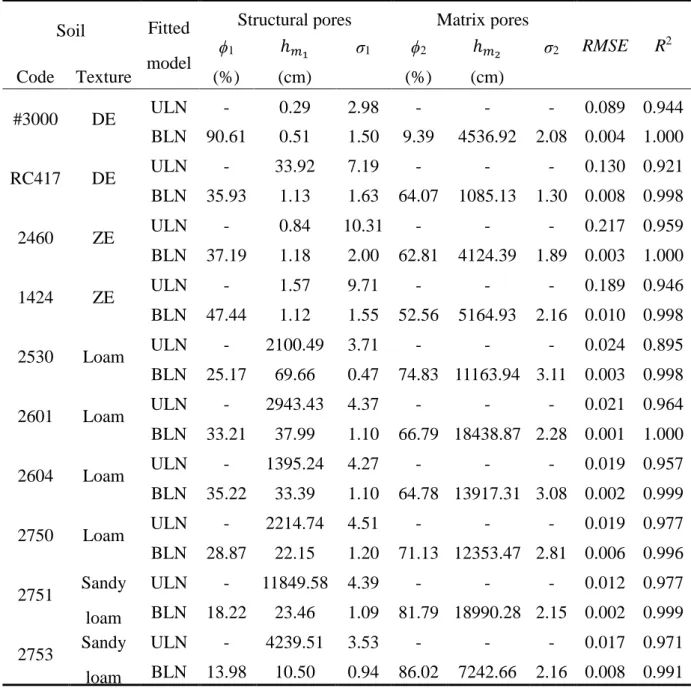
Table 5.1 ULN and BLN models curve-fit parameters for the materials ... 103
Table 5.2 BLN model curve-fit parameters for the materials ... 109
Table 6.1 Comparison of the fitted and predicted capability of ULN, BvG and
BLN models ... 121
xvi
xvii
NOTATION
w gravimetric water content h matric suction head K hydraulic conductivity θ volumetric water content S
eeffective degree of saturation u
apore-air pressure
u
wpore-water pressure
ψ soil suction
ψ
amatric suction at which air first enters the largest pores of the soil during a drying process
θ
rresidual water content ψ
rresidual soil suction
ψ
wmatric suction at which the water content of the soil starts to increase significantly during the wetting process
θ
ssaturated water content a fitting parameter n fitting parameter m fitting parameter
e void ratio
K
ssaturated permeability C(ψ) correction factor v average flow velocity
i hydraulic gradient
r pore radius
η kinematic coefficient of viscosity C shape constant of the flow system g gravitational acceleration
T
ssurface tension force
xviii
P applied pressure
G
sspecific gravity ϕ total soil porosity
S
wratio of measured saturated water content to theoretical porosity ρ
bsoil bulk density
ρ
ssoil particle density
α empirical parameter
δ
jscaling factor λ
jcharacteristic length
λ
refcharacteristic length of a reference soil r
mmedian pore radius
σ standard deviation of the pore frequency distribution h
mmedian suction head related to the median pore radius
Se,r
reference SWCC function α
potentialpotential α values
measured reference SWCC function
alculate the predicted reference SWCC function according potential α value
ρ
d,maxmaximum dry density
ρ
d,maxminimum dry density
n
maxmaximum total porosity
g(r) pore probability density function for pore radii F
n(x) complementary normal distribution function
t dummy variable
ϕ
ivolumetric percentage of the soil components with the ith pore series 𝑟
𝑚𝑖the median pore radius (cm) for the ith pore series
σ
istandard deviation of ln(r) associated with the ith pore series ℎ
𝑚𝑖median matric head components with the ith pore series
, measured
S
e R, predicted
S
e Rxix
R
2coefficients of determination K
rrelative hydraulic conductivity λ tortuosity parameter
β tortuosity parameter
γ pores connectivity parameter
1
CHAPTER 1
1. INTRODUCTION
1.1 Research background
Drylands cover about 41% of Earth’s land surface and are home to more than 38% of the total global population of 6.5 billion (MEA, 2005). Some form of severe land degradation is present on 10 to 20% of these lands, the consequences of which are estimated to affect directly some 250 million people in the developing world, an estimate likely to expand substantially in the face of climate change and population growth. The United Nations has periodically focused on desertification and drylands, notably adopting the Convention to Combat Desertification (CCD) in 1992 and designating 2006 as the International Year of the Desert and Desertification.
As defined by the CCD, desertification is land degradation in arid, semi-arid and dry
sub-humid areas resulting from various factors, including climatic variations and
human activities. Desertification endangers the livelihoods of rural people in drylands,
particularly the poor, who depend on livestock, crops and fuelwood. Conversion of
rangelands to croplands without significant new inputs brings about a significant,
persistent loss of productivity and biodiversity, accompanied by erosion, nutrient
depletion, salinity and water scarcity. In 2000, the average availability of freshwater
for each person in drylands was 1300 m
3/year, far below the estimated minimum of
2000 m
3/year needed for human well-being, and it is likely to be further reduced
(Millennium Ecosystem Assessment, 2005). Measured by indicators of human
well-being and development, dryland developing countries lag far behind the rest of
the world. For instance, the average infant mortality rate (54 per thousand) is 23
percent higher than in non-dryland developing countries and 10 times that of
2
industrialized countries.
The seriousness of the issue is recognized by the CCD, the Convention on Biological Diversity (CBD) and the United Nations Framework Convention on Climate Change (UNFCCC). The New Partnership for Africa’s Development also stresses the need to combat desertification as an essential component of poverty-reduction strategies.
However, investment and action to combat desertification have been held back by the isolation of drylands from mainstream development, and even by controversy over the use of the term. Debate about desertification has been fuelled by alarming articles in the popular media about “encroaching deserts”, reinforced by a series of droughts from the 1960s through the 1980s (Reynolds and Stafford Smith, 2002).
Because of the serious situation of desertification, prevention of the degradation of land becomes key issue. Among existed countermeasures, greening is considered to be one of the most effective methodology which can protect the biodiversity threaten by desertification, minimizing cost and providing positive multifunction. In the application of the methodology, the vegetation is the core. However, in order to fulfill the requirement of the growth of the plants, available water resource is the one of the important limitation. In the most of desertification area, there is usually not enough water resource. Limited precipitation and dew, as water resource are obviously not sufficient for the growth of the plant. Therefore, available water becomes the key limitation to the recovery of ecosystem in such areas. The groundwater can be used as a main water resource for the plants, since it has the advantage of large quantity and relative sustainability. Based on these considerations, the capillarity of water in the soils is considered as one of the possible methodologies. However, sandy soils with big particle size and only have pores between particles (single-porosity) cause low water holding capacities, which leads to water stresses in the root zone. It’s one of problem for vegetation restoration to overcome or mitigate desertification.
Dual-porosity soils such as diatomaceous earths and zeolites not only have pores
between particles also have pores inner particles. These structural soils have been
identified as soil amendment materials in high sand content root zones (Waltz et al.
3
2003). The knowledge of hydraulic behavior of such single- and dual-porosity soils is the foundation of seepage analysis in the root zone.
1.2 Scope and objectives
Simulation of flow and contaminant transport through the vadose zone requires knowledge of the soil hydraulic properties. These properties are the soil water characteristic curve (SWCC) relating the volumetric water content, θ (cm
3cm
-3), to the matric head, h (cm), and the hydraulic conductivity curve giving the hydraulic conductivity K (cm/s) as a function of θ or h (Coppola, 2000). Although hydraulic properties may be obtained by direct measurements, it is still time-consuming, labour intensive and expensive. In this study, alternative theoretical approaches used to estimate hydraulic properties through the use of more easily measured data.
The principal objects of the research are
(1) To propose a new model which used to predict the soil water characteristic curve based on the soil basic properties for single-porosity soils.
(2) To investigate the basic properties and hydraulic properties of the dual-porosity soils.
(3) To propose a bimodal soil water characteristic curve model for dual-porosity soils.
(4) To propose a closed-form function used to predict unsaturated hydraulic conductivity for dual-porosity soils.
1.3 Layout of thesis
The structure of this thesis is as follows:
(1) Chapter 1 introduces the research background, sets the research objectives and defines the research scope. The layout of the thesis is also comprehensively presented.
(2) Existing studies are reviewed in Chapter 2, the experimental techniques on hydraulic properties and the pore geometry, and the analytical models for hydraulic properties.
(3) In Chapter 3, developed a soil water characteristic curve model for single-porosity
4
soils used to predict the soil water characteristic curve based on the particle-size distribution. Experimental soil data that representing wide range of textures are used to verify the proposed model.
(4) In Chapter 4, the basic properties of the dual-porosity soils used in the laboratory experiments are presented. The pore geometry of structural soils has been studied using scanning electron microscopy and mercury intrusion porosimetry. Two methods were used to measure the soil water characteristic curve data of the materials: the Tempe cell method and the centrifuge method.
(5) In Chapter 5, derivation of a bimodal lognormal soil water characteristic curve function for dual-porosity soils based on pore size distribution; and tests of the proposed model using available datasets. Also the measured soil water characteristic curves (presented in Chapter 4) are used to verify the proposed model.
(6) In Chapter 6, a new model was proposed for predicting unsaturated hydraulic conductivity of dual-porosity structural soils based on the bimodal soil water characteristic curve model which has been proposed in Chapter 5. Experimental data verification and parametric analyses were undertaken to demonstrate the fit and predicting capability of the proposed equations.
(7) Conclusions and future work are presented bimodal soil water characteristic curves and corresponding conductivity curves in Chapter 7.
The relationship between chapters is illustrated in Figure 1.1.
5
Chapter 1 Introduction Chapter 2 Literature review
Chapter 3 Prediction of soil water characteristic curves for single-porosity soils using physically based scaling technique
Chapter 4 Characterization of dual-porosity soils
Chapter 5 Bimodal descriptions of soil water characteristic curves for dual-porosity soils
Chapter 6 Physically based closed-form expression for the bimodal unsaturated hydraulic conductivity function
Chapter 7 Conclusions and future work
Figure 1.1 Flowchart of the structure of the dissertation
6
REFERENCES
Coppola, A. 2000 Unimodal and bimodal descriptions of hydraulic properties for aggregated soils. Soil Science Society of America Journal, 64(4), 1252-1262.
MEA, Millennium Ecosystem Assessment—Ecosystems and Human Well-Being:
Desertification Synthesis (World Resources Institute, Washington, DC, 2005).
Millennium Ecosystem Assessment 2005 Ecosystems and Human Well-being:
Desertification Synthesis. Millennium Ecosystem Assessment World Resources Institute, Island Press, Washington, DC.
Waltz F.C. Jr, Quisenberry V.L. and McCarty L.B. 2003 Physical and hydraulic properties of root zone mixes amended with inorganics for golf putting green.
Agronomy Journal, 95(2), 395-404.
Reynolds, J.F. and Stafford Smith, M.D. eds. 2002 Global Desertification - Do
Humans Cause Deserts? Dahlem Workshop Report 88. Dahlem University Press,
Berlin.
7
CHAPTER 2
2. LITERATURE REVIEW
2.1 Soil water characteristic curve 2.1.1 Introduction
The water retention ability of soil is usually characterized by soil water characteristic curve (SWCC). SWCC is widely used in geotechnical, geoenvironmental and agricultural engineering. The SWCC is an important soil parameter function required when performing seepage analysis for unsaturated soil systems. The SWCC can be related to some other important soil properties such as the unsaturated permeability function (Fredlund et al., 1994) and the shear strength (Vanapali et al., 1996).
SWCC is defined as the relationship between gravimetric water content w (or
volumetric water content θ, or the effective saturation S
e) and suction for the soil
(Williams, 1982). There are also many numerous other terms, such as soil moisture
content, for characterizing this relationship. The water content defines the amount of
water contained within the pores of the soil. In soil science, the volumetric water
content, θ, is most commonly used. In geotechnical engineering practice, however, the
gravimetric water content w, which is the ratio of the mass of water to the mass of
solids, is most commonly used. The effective saturation S
eis another term commonly
used to indicate the percentage of the voids which are filled with water. Suction ψ
may be either the matric suction (also known as capillary pressure) of the soil (i.e.,
u
a- u
w, where u
ais the pore-air pressure and u
wis the pore-water pressure) or total
suction (i.e., matric plus osmotic suction). As a result of the different terminologies
used, the soil-water characteristic curves have taken on numerous forms. Soil water
characteristic curves over the entire suction range are often plotted on a logarithmic
scale.
8
Figure 2.1 Idealized soil water characteristic curve (Yang et al., 2004)
A SWCC describing the desaturation process of soil is termed as a drying curve and a SWCC describing the saturation process of soil is termed as a wetting curve (Fetter, 1993). The resulting SWCCs for the drying path and wetting path exhibit hysteresis. A typical wetting SWCC and drying SWCC is illustrated in Figure. 2.1. The air-entry value (AEV, which is also called bubbling pressure), ψ
a, is defined as the matric suction at which air first enters the largest pores of the soil during a drying process (Brooks and Corey, 1964, 1966). As matric suction is increased from zero to the AEV of the soil, the volume water content, θ, of the soil is nearly constant. As the matric suction increases beyond the AEV, the water content steadily decreases to the residual water content, θ
r. The residual water content is the water content where a large suction change is required to remove additional water from the soil. Under the capillary forces in soil pores created by the surface tension and the adsorption forces on the surfaces of clay particles and in the clay interlayer, water can be retained in soils up to a maximum suction of 1000 MPa (Fredlund and Rahardjo, 1993). It has been experimentally supported for a variety of soils (Croney and Coleman, 1961) and is supported by thermodynamic considerations (Richards, 1965).
Values of ψ
awere generally determined using the tangent method (as shown in Figure.
9
2.1, as proposed by Brooks and Corey (1964). A consistent way to define the residual water content is also shown in Figure. 2.1. A tangent line is drawn from the inflection point. The curve in the high-suction range can be approximated by another line. The residual water content, θ
r, can be approximated as the ordinate of the point at which the two lines intersect. The soil suction corresponding to the residual water content is called the residual soil suction, ψ
r. The water-entry value, ψ
w, on the wetting SWCC, is defined as the matric suction at which the water content of the soil starts to increase significantly during the wetting process (Yang et al., 2004).
The saturated water content, θ
s, and the air-entry value ψ
a, generally increase with the plasticity or clay content of the soil. Other factors such as stress history, wetting and drying cycle, confining pressure and so on also affect the shape of the soil-water characteristic curves (Fredlund and Xing, 1994).
2.1.2 Hydraulic hysteresis
Figure 2.2 Hydraulic hysteresis (Pham et al., 2005)
The drying SWCC and the wetting SWCC are generally different. At a same soil
suction, the water content on the drying SWCC is normally greater than on the
wetting SWCC. This phenomenon is called hydraulic hysteresis. The main (boundary)
wetting and drying curves (as shown in Figure. 2.2) correspond to wetting from a dry
condition and drying from a fully saturated condition, respectively. If wetting or
10
drying commences from any point and follows a previous drying or wetting stage respectively, the new wetting or drying curve lies within the region enclosed by the main (boundary) wetting and drying curves. These new wetting and drying curves are termed as scanning curves. In cycles performed over a given suction range, the form of the final stable hysteresis loop should be independent of whether the first cycle starts on a wetting curve or a drying curve.
Hysteresis has introduced great difficulties in the application of SWCC in unsaturated soil mechanics. Because the occurrence of hydraulic hysteresis means that two samples of the same soil subjected to the same value of suction can be at significantly different values of effective saturation, S
e, if one is on a drying path and another is on a wetting path (or on the scanning curves). Hillel (1998) stated that hydraulic hysteresis may be attributed to several causes:
(1) The geometric non-uniformity of the individual pores (which are generally irregularly shaped voids interconnected by smaller passages), resulting in the ‘ink bottle’ effect (Haines, 1930).
(2) The contact-angle effect, by which the contact angle and the radius of curvature are greater in the case of an advancing meniscus than in the case of a receding one.
Therefore, a given water content will tend to exhibit a larger suction in desorption than in adsorption.
(3) The encapsulation of air in ‘blind’ or ‘dead-end’ pores, which further reduces the water content of newly wetted soil. Failure to attain true equilibrium (strictly speaking, not true hysteresis) can accentuate the hysteresis effect.
(4) Swelling, shrinkage or aging phenomena, which result in differential changes of soil structure, depending on the wetting and drying history of the sample.
Pham et al. (2005) reviewed 28 hysteresis models and classified them into two
categories: physically based models (domain models) and empirical models. In the
domain models, if the behavior of the domain is not a function of the adjacent
domains, the domain is said to be “independent”. Then the behavior of the particular
pore depends only on a range of soil suctions. Therefore, the model is called an
11
independent domain model. For example, Mualem (1973) developed a fairly successful independent domain model, in which only the primary drying and wetting curves were required, to predict the hysteresis within the primary wetting and drying SWCC curves. Mualem (1974) subsequently modified the model and adopted a new physical interpretation of the independent domain theory. Dependent models, such as Poulovassilis and Childs (1971) and Mualem (1984), can be developed from an independent model and return to independent model by simplification. Pham et al.
(2005) pointed out that the Feng and Fredlund (2003) model, which is an empirical model, is the most accurate model for predicting the main (boundary) SWCC and the Mualem (1974) model is the most accurate model for predicting the scanning SWCCs.
Also, the hydraulic hysteresis is related with the soil stress-strain behavior. Wheeler et al. (2003) constructed a model to deal with the coupled hydraulic hysteresis and stress-strain behavior and indicated that the plastic volumetric strains will influence the water retention behavior and may induce the hydraulic hysteresis.
2.1.3 SWCC models
Numerous empirical equations have been proposed to describe the soil water characteristic curve (Table 2.1).
The Burdine (1953) model is a three-parameter model with the relationship fixed between two of the parameters. The parameter, a, is related to the inverse of the air entry value; parameter n is related to the pore size distribution of the soil. Parameter m is assumed to be a function of n, eliminating m as a fitting parameter. The effect of one parameter can be distinguished from the effect of the other parameter, and the model contains only two parameters. Burdine (1953) provides a reasonably accurate representation of data for a variety of soils.
Van Genuchten (1980) improved the Burdine (1953) model further. The van
Genuchten (1980) model is more flexible and has been widely used in the engineering
practice.
12
Table 2.1 Soil water characteristic curve models
Model name Expression Parameters
Gardner (1922)
e rs r
S B D
B, D = Empirical coefficient Burdine (1953) S
e 1 1 a
n
1 2/ na, n = Empirical coefficient Gardner (1956) S
e 1 1 a
n a, n = Empirical coefficient Brooks and Corey
(1964) S
e(
a/ )
λ = pore-size distribution
index
Brutsaert (1966) S
e 1 1 / a
n a, n = Empirical coefficient Campbell (1974) /
a ( /
s)
bb = Empirical coefficient Mualem (1976) S
e 1 a
n
1 1/na, n = Empirical coefficient Van Genuchten (1980) S
e 1 a
n
ma, n, m = Empirical
coefficient
Williams et al. (1983) ln a b ln a, b = Empirical coefficient Mckee and Bumb
(1987) S
e exp( / ) b b = Empirical coefficient Ross and Smettem
(1993) S
e 1+ exp - α= Empirical coefficient Fredlund and Xing
(1994) S
e ln e a
n
ma, n, m = Empirical coefficient
Kosugi (1994)
= ln( / ) /
e n m
S F h h
1
2( ) exp(- / 2)
n
2
xF x t dt
F
n(x), the complementary normal distribution function and t is a dummy variable;
h
mand σ are the mean and standard deviation of ln(h).
Se
is the effective saturation; θ is the volumetric water content; ψ (or h) is the matric suction; ψ
ais the air entry value; θ
ris the residual water content; θ
sis the saturated water content.
The van Genuchten (1980) model fits the degree of saturation versus soil suction data over the entire range of soil suction. The equation uses three fitting parameters;
namely, a, n and m. Parameter a is related to the inverse of the air entry value;
parameter n is related to the pore size distribution of the soil and parameter m is
related to the asymmetry of the model. The advantages of the van Genuchten (1980)
13
model are as follows: it provides a wide range of flexibility, allowing it to better fit data from a variety of soil types; the model parameters have physical meaning; the effect of one soil parameter can be distinguished from the effect of the others.
However, the magnitude of the best-fit values of n and m may vary somewhat depending on the convergence procedure. The van Genuchten (1980) model contains three fitting parameters and this limits the type of correction factors that may be added to the model.
Fredlund and Xing (1994) proposed another widely used SWCC model. The advantages of the Fredlund and Xing (1994) model are as follows: it is continuous over the entire soil suction range; there is great flexibility for the model to fit a wide variety of datasets; the soil parameters are meaningful; the effect of one parameter can be distinguished from the effect of the other two parameters. It has been observed that the Fredlund and Xing (1994) model requires less iteration to converge to the best-fit parameters than the van Genuchten (1980) three-parameter model. Fredlund and Xing (1994) also presented a correction factor for use with their model to ensure that the SWCC goes through 1,000,000 kPa at zero water content.
Brutsaert (1966) studied four models of pore-size distribution, among them the lognormal distribution in relation to SWCCs. A more detailed analysis was presented by Kosugi (1994), who assumed the lognormal pore probability density function for pore radii. The advantages of the Kosugi’s equations are defined by parameters that have physical significances which can be related to the properties of the materials.
2.1.4 SWCC measurement techniques
The SWCC measurement techniques can be grouped into at least two categories of methods:
(1) One method is to measure both the water content of a soil specimen and the
suction (total suction or matric suction) in the soil specimen, or the humidity around
the soil specimen. This method includes the techniques using filter papers (Marinho
and Oliveira, 2006), psychrometers (Leong et al., 2003), traditional tensiometers
(Fredlund and Rahardjo, 1993), suction probes (i.e., tensiometers for measuring high
14
soil suctions) (Ridley and Burland, 1996; Take and Bolton, 2003; Cui et al., 2008), and thermal conductivity sensors (Feng and Fredlund, 2003; Nichol et al., 2003).
(2) Another method is to control the suction and measure the water content in the soil specimen. This method includes the axis translation technique (Fredlund and Rahardjo, 1993), the osmotic technique (Delage and Cui, 2008; Monroy et al., 2007), and the humidity control technique (Likos and Lu, 2003). The axis translation technique is the most popular SWCC measurement method because of its accuracy and validity in the most concerned suction range. The traditional axis translation devices always use the air pressure to control the soil suction and show low accuracy in the low suction range. Water head control can help solve this problem in the axis translation technique.
2.1.5 SWCC prediction based on basic soil properties
The measurement of SWCC is time consuming. It would be convenient to estimate the SWCC from basic soil properties, such as the grain-size distribution and void ratio, in engineering practice.
A pedo-transfer function (PTF) (Bouma, 1989) is a function that yields a soil property function based on basic soils properties such as the grain-size distribution or porosity.
For the SWCC, indirect methods are classified into semiphysical and empirical methods (Schaap, 2005). Following an empirical approach, the SWCC is estimated from routinely available taxonomic data (e.g., sand, silt, or clay percentages, organic matter content, and porosity) using empirical pedo-transfer functions (PTFs) (Vereecken, 1988; Weynants et al., 2009).
Semiphysical or conceptual approaches for estimating the SWCC consider the close similarity between the shape of the grain-size distribution function and the SWCC.
They do offer valuable conceptual insights into the physical relations between the grain-size distribution and the pore size distribution.
The first attempt to directly translate the grain-size distribution into a SWCC was
made in the classical study by Arya and Paris (1981). In their AP model, the pore size
is associated with a pore volume and is determined by scaling the pore length. Pore
15
lengths based on spherical particles are scaled to natural pore lengths using an empirical scaling parameter, α , which should be ≥1. Arya and Paris (1981) initially determined that α ranged between 1.31 and 1.43 for dif erent soils, with an average value of 1.38, but later it was found that α varied between 1.02 and 2.97 (Arya et al., 1982; Schuh et al., 1988; Mishra et al., 1989). Many investigators have suggested that predictions of the SWCC would improve if α were formulated such that it would vary across the range of particle sizes (Basile and D’Urso, 1997; Arya et al., 1999; Vaz et al., 2005). Fractal concepts have also been used to derive α (Tyler and Wheatcraft, 1989). However, the calculation procedures of these approaches are quite complicated or without paying much attention to the physical significance of the soil properties.
2.2 Unsaturated permeability function 2.2.1 Introduction
The unsaturated soil coefficient of permeability function (commonly referred to as permeability function) is the primary soil parameter required when performing seepage analysis for unsaturated soil systems. Examples of engineering applications where a permeability function is involving include the triggering of landslides due to rainfall infiltration, and the modeling of flow and volume change in collapsing soils, compacted soils and expansive clays. The permeability functions are also required when modeling contaminant migration in vadose zones and in the design of capillary barriers and cover systems.
Usually, the coefficient of permeability of a saturated soil is looked as a function of void ratio. The coefficient of permeability of an unsaturated soil (i.e. K) is a function of both void ratio e and the effective saturation, S
e(or the volumetric water content, θ).
The unsaturated permeability can be expressed as a function of any two of the three parameters which are interrelated,
(
e, ); ( , ); (
e, )
K f S e K f e K f S (2-1)
If the soil structure is assumed to be incompressible, the saturated permeability, k
s,
will quantify the effect of void ratio, and another function will account for the effect
of volumetric water content (or the effective saturation) in the soil. The unsaturated
16
permeability function can be expressed as,
( ) or ( )
s s e
K K f K K f S (2-2) The suction and volumetric water content are related to the SWCC, so the permeability function can also be expressed as a function of suction (ψ), which is more frequently used in practices:
s