附表 経済・社会統計一覧
著者
植村 仁一
権利
Copyrights 日本貿易振興機構(ジェトロ)アジア
経済研究所 / Institute of Developing
Economies, Japan External Trade Organization
(IDE-JETRO) http://www.ide.go.jp
シリーズタイトル
アジア経済研究所統計資料シリーズ
シリーズ番号
92
雑誌名
カンボジアのマクロ計量モデルと経済・社会統計
ページ
111-194
発行年
2009
出版者
日本貿易振興機構アジア経済研究所/Institute of
Developing Economies (IDE-JETRO)
URL
http://hdl.handle.net/2344/00008930
附表
統計一覧:目次
A.国家統計局のメインページからアクセスできる統計………115
(A−1)2008年・人口センサス………115
(A−2)2005年・カンボジア人口及び健康調査(CDHS2005)………115
(A−3)生命表………119
(A−4)2004年・社会経済調査(CSES 2003-04)………121
(A−5)国民所得統計………127
(A−6)消費者物価指数………133
(A−7)センサス中間年人口推計(CIPS2004)………135
(A−8)カンボジアの公式地名………137
(A−9)行政及び保健施設一覧………138
(A−10)家内児童労働調査(CDWS2003)………139
B.
国家統計局の統計サブページからアクセスできる統計………142
(B−1)1998年人口センサス………142
(B−2)2005年カンボジア人口及び健康調査(CDHS2005)………150
(B−3)2004年・センサス中間年人口推計(CIPS2004-Depth)………150
(B−4)2004年・社会経済調査(CSES2003-04)………164
(B−5)2004年・センサス中間年人口推計(CIPS2004)………164
(B−6)家内児童労働調査(CDWS2003)………164
(B−7)2001年・労働力調査(LFS2001)………165
(B−8)2001年・児童労働調査(CCLS2001)………167
(B−9)2000年・カンボジア人口及び健康調査(CDHS2000)………169
(B−10)2000年・事業所統計調査(SIEC2000)………171
(B−11)第1回推計人口改訂(RPC-1_1998-2020)………180
(B−12)統計年報2006年(Year Book 2006)………185
C.農林水産省(MAFF)の統計………188
(C−1)農業生産統計………188
D.経済財務省(MEF)の統計………192
(D−1)カンボジア・マクロ経済概況………192
E.商業省(MOC)の統計………193
(E−1)相手国別輸入………193
(E−2)製品輸出………194
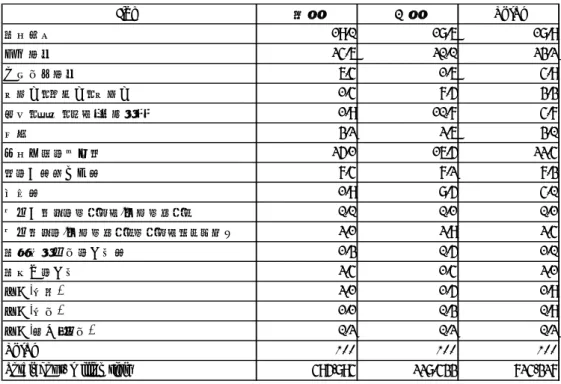
A.国家統計局のメインページからアクセスできる統計
(A−1)2008年・人口センサス(国勢調査:Population Census 2008)掲載内容
2009年1月時点では、サイト上に掲載されているのは調査票、調査員用のマニュアル類等のみ
で、具体的な統計数値は入手できない。
(A−2)2005年・カンボジア人口及び健康調査(Cambodia Demographic and
Health Survey, CDHS2005)掲載統計
Table 01: 事故の類型別死傷者数
調査前 12 ヶ月間に「事実上の家計構成員」が負傷または死亡した事故の類型別
∼(略)∼
Table 02: 治療を要する病気または負傷人口の割合
∼(略)∼
Table 03: 現在の避妊行動状況
∼(略)∼
Table 04: 現在の婚姻状況
Never Living married together 未婚 既婚 同居 離婚 別居 死別 15-19 89.2 9.8 0.3 0.4 0.2 0.2 100 3,601 20-24 40.8 54.3 0.5 2.3 1.3 0.7 100 3,045 25-29 17.7 76.1 0.4 2.5 1.4 1.9 100 2,051 30-34 8.4 82.7 0.4 3.9 2.4 2.3 100 2,082 35-39 7.2 81.6 0.4 3.6 2.0 5.3 100 2,229 40-44 6.2 77.9 0.4 4.4 1.8 9.4 100 2,112 45-49 4.1 74.9 0.2 4.3 2.3 14.4 100 1,703 Total 15-49 31.8 59.6 0.4 2.7 1.5 4.0 100 16,823 15-19 97.9 1.6 0.0 0.0 0.4 0.0 100 1,662 20-24 60.5 36.2 0.5 1.1 1.6 0.0 100 1,222 25-29 22.4 72.8 0.2 1.0 2.7 0.9 100 830 30-34 3.1 93.2 0.0 1.4 1.1 1.1 100 811 35-39 2.5 95.4 0.4 1.0 0.1 0.7 100 858 40-44 0.7 97.5 0.1 0.4 0.1 1.2 100 793 45-49 0.0 97.3 0.1 1.2 0.3 1.1 100 555 Total 15-49 38.7 58.8 0.2 0.8 0.9 0.6 100 6,731Age Total Number of
respondents Separated
Women
Men Marital status
Table 05: 初性交時の年齢、現年齢階層別
∼(略)∼
Table 06: 最近の性的活動:女性
∼(略)∼
Table 07: 最近の性的活動:男性
∼(略)∼
Table 08: 出産を制限する願望
現在以上の子供を望まない既婚女性の割合(子供の人数別)
(%)
∼(略)∼
Table 09: 出産計画状況
∼(略)∼
Table 10: 高リスク出産行動
Percentage of births Risk ratio
Not in any high-risk category 29.0 1.0 19.8a
First-order births between ages 18 and 34
Mother's age<18 母体年齢が18歳未満 2.7 1.6 0.3 Mother's age>34 母体年齢が34歳を超える 3.0 2.2 6.7 Birth interval<24 months 直前の出産から24か月未満 7.2 1.8 9.4 Birth order > 3 3人を超える出産 15.0 1.3 10.5
Subtotal 27.9 1.6 26.9
Age<18 and birth interval<24 months2
Age<34 and birth interval<24 months Age<34 and birth order<3 Age<18 and birth interval<24 months and birth order >3 Birth interval<24 months and birth order >3
Subtotal 18.7 2.2 47.4
In any avoidable high-risk
category 回避可能なリ スク 46.6 1.8 74.3 Total 100 na 100 母体年齢が34歳を超え、出産間隔 が24か月未満 母体年齢が34歳未満で3人目より 少ない出産 母体年齢が18歳未満で出産間隔 が24か月未満、かつ3人を超える 出産 出産間隔が24か月未満で3人を超 える出産 2.0 3.8 3.6 3.4 3.2 5.2 0.4 -3.7 0.4 12.8 1.6 38.2
Multiple high-risk category ( 複合的ハイリスク)
0.2 * 0.1
母体年齢が18歳未満で出産間隔 が24か月未満2
24.3 1.1 5.8
Single high-risk category ( 単純ハイリスク)
母体年齢が18歳から34歳の初産 Risk category
Births in the 5 years Preceding the survey Percentage of currently married women assigned to the risk
category1
Table 11: 医療業務従事者によって診断された乳幼児死亡
Table 12: 分娩の場所
∼(略)∼
Table 13: 子供の栄養状態
∼(略)∼
Table 14: 年代別母乳栄養状況
Yes No know/missingDon't
Premature 未熟児 30.2 64.1 5.7 100 20
Fever 高熱 18.0 79.3 2.7 100 17
Dengue hemorrhagic fever デング出血熱 76.1 23.9 0.0 100 13 Tetanus 破傷風 49.0 46.0 5.0 100 8 Tetanus type of convulsion 全身(けいれん)
性破傷風 22.5 77.5 0.0 100 9
Convulsion けいれん 38.6 61.4 0.0 100 3 Disease of respiratory system 呼吸器系の病気 72.3 27.7 0.0 100 17 Diarrhea 下痢 25.8 74.2 0.0 100 6 Birth defect 奇形 35.3 64.7 0.0 100 3 Refused breast milk 母乳拒否 0.0 65.6 34.4 100 6 Typhoid fever 腸チフス 89.9 10.1 0.0 100 3 Malaria マラリア 0.0 100.0 0.0 100 2 Meningitis 髄膜炎 100.0 0.0 0.0 100 5 Heart disease 心臓病 56.1 43.9 0.0 100 3 Abdominal distension 腹筋膨張 0.0 100.0 0.0 100 3 Swelling 臓器浮腫 62.9 0.0 37.1 100 1 Pale Pale 0.0 100.0 0.0 100 1 Constipation 便秘 0.0 100.0 0.0 100 1 Fever/convulsion 熱/けいれん 0.0 79.5 20.5 100 1 Fever/diarrhea 熱/下痢 23.9 76.1 0.0 100 3 Pulmonary TB/meningitis 肺結核/髄膜炎 100.0 0.0 0.0 100 1 Fever/diarrhea/vomiting 熱/下痢/嘔吐 0.0 100.0 0.0 100 2 liver disease 肝疾患 100.0 0.0 0.0 100 1 Cold illness 風邪 0.0 100.0 0.0 100 1 Problem of delivery 出産時の問題 60.6 39.4 0.0 100 8 Syncope 失神 0.0 100.0 0.0 100 1 Cholera コレラ 0.0 100.0 0.0 100 1 Diphtheria ジフテリア 100.0 0.0 0.0 100 1 Baby's hand with pustules like burn,
erupted and die 膿疱性の病気 0.0 100.0 0.0 100 1 Vomiting 嘔吐 76.8 23.2 0.0 100 4 Throat infection 喉の感染症 31.0 69.0 0.0 100 4 Crying too long 長泣き 49.7 43.3 7.1 100 5 Died immediately after birth 出生直後に死亡 44.1 24.9 31.0 100 1 Poeus Poeus 63.3 36.7 0.0 100 4 Cursed by spirits 精神異常 0.0 100.0 0.0 100 1 Don't know わからない 0.0 44.0 56.0 100 19
Total 38.1 53.1 8.9 100 180
1 Excludes deaths due to accident.
Diagnosis by a health worker
Total Number of death1 among infant and young children born since January 2002 Cause of death reported by mother
Table 15: 女性の栄養状態
∼(略)∼
Table 16: 都市農村別HIV検査状況:男女別
∼(略)∼
Table 17: 性行動によるHIV感染率
∼(略)∼
Table 18: 子の年齢別両親の有無状況
Table 19: 性別による行動の差異
∼(略)∼
Table 20: 市民社会への関与度合
∼(略)∼
Table 21: 結婚後(家庭内)暴力
∼(略)∼
Father alive Father dead Mother alive Mother dead Both liveonly father alive only mother alive Both dead 0-4 87.2 6.0 1.8 0.5 0.3 3.3 0.2 0.2 0.1 0.2 100 2.7 7,793 <2 89.1 6.3 1.3 0.4 0.4 2.1 0.1 0.1 0.1 0.1 100 2.0 3,204 2-4 85.9 5.8 2.1 0.5 0.3 4.2 0.2 0.4 0.2 0.3 100 3.2 4,590 5-9 82.0 5.8 4.1 0.5 0.7 5.0 0.5 0.7 0.5 0.2 100 6.5 8,463 10-14 75.6 5.8 7.1 0.8 1.4 5.9 0.9 1.2 1.1 0.3 100 11.7 10,349 15-17 70.0 4.9 9.8 1.0 2.0 7.1 1.1 1.6 1.4 1.2 100 15.9 5,227 Male 79.6 5.2 5.6 0.8 1.2 5.0 0.6 0.9 0.7 0.4 100 9.0 16,018 Female 78.8 6.2 5.4 0.6 0.9 5.4 0.7 0.9 0.8 0.4 100 8.6 15,814 Urban 75.7 6.2 5.9 0.7 1.0 7.0 0.9 0.8 1.2 0.6 100 9.7 4,374 Rural 79.8 5.6 5.4 0.7 1.1 4.9 0.6 0.9 0.7 0.4 100 8.6 27,458 Total<15 81.1 5.9 4.6 0.6 0.9 4.8 0.5 0.7 0.6 0.2 100 7.4 26,606 Total<18 79.2 5.7 5.5 0.7 1.1 5.2 0.6 0.9 0.7 0.4 100 8.8 31,832
Note : Table is based on de jure household members, i.e., usual household members.
Wealth quintile Province Age Sex Residence ~~地域別(略)~~ ~~資産別(略)~~ Number of children Background characteristic Living with both parents
Living with mother but not father
Living with father not
mother Living with either parent Missing information on father/mother Total Percentage with one or both parents dead
(A−3)生命表(Life Table of Cambodia)掲載統計
Table 01: 2000 CDHS と 2004 CIPS における合計特殊出生率比較
Table 02: 生誕時平均余命推計(左)
Table 03: ロジスティック曲線による合計特殊出生率推計(右)
Year 男性 女性 Year TFR 1998 51.82 55.79 Lower asymptote 2.10 1999 53.28 57.33 1998 3.99 2000 54.74 58.87 1999 3.85 2001 56.19 60.4 2000 3.72 2002 57.65 61.94 2001 3.58 2003 59.11 63.48 2002 3.46 2004 60.11 64.48 2003 3.34 2005 61.01 65.38 2004 3.23 2006 61.81 66.18 2005 3.12 2007 62.51 66.88 2006 3.03 2008 63.11 67.48 2007 2.94 2009 63.61 67.98 2008 2.85 2010 64.11 68.48 2009 2.78 2011 64.51 68.88 2010 2.71 2011 2.64 2020 2.29 Upper asymptote 6.85 TFR : 合計特殊出生率Direct
estimate
(直接推計法)
Own children
(同居児法)
2000 CDHS
2004 CIPS
2000-2004
3.37
1996-2000
3.99
4.29
1991-1995
5.64
5.51
1986-1990
5.36
1981-1985
6.41
1998
3.99
4.12
Quinquenium
Table 04: 第1次および第2次推計人口比較
Table 05: CSES 2003-04 に基づく乳幼児死亡率
Data
乳児死亡率
幼児死亡率
August 2002
0.066
0.016
May 2001
0.072
0.019
July 1999
0.075
0.020
August 2002
0.062
0.015
May 2001
0.070
0.018
July 1999
0.071
0.019
Male
Fe male
Year 総人口 0-4歳児 総人口 0-4歳児 総人口 0-4歳児 1993 10,659,466 1,878,484 10,659,466 1,878,484 0 0 1994 10,989,922 1,915,426 10,989,922 1,915,426 0 0 1995 11,331,451 1,968,106 11,331,451 1,968,106 0 0 1996 11,668,629 2,018,636 11,668,629 2,018,636 0 0 1997 11,970,358 2,029,385 11,970,358 2,029,385 0 0 1998 12,169,491 1,926,399 12,169,491 1,926,399 0 0 1999 12,389,375 1,829,782 12,373,157 1,827,054 16,218 2,728 2000 12,612,257 1,724,964 12,576,892 1,712,722 35,365 12,242 2001 12,842,365 1,629,001 12,783,805 1,599,263 58,560 29,738 2002 13,080,783 1,572,540 12,994,456 1,516,656 86,327 55,884 2003 13,327,926 1,620,073 13,213,947 1,530,977 113,979 89,096 2004 13,584,069 1,657,804 13,439,134 1,531,412 144,935 126,392 2005 13,806,923 1,694,990 13,661,375 1,534,137 145,548 160,853 2006 14,080,653 1,739,585 13,996,216 1,648,645 84,437 90,940 2007 14,363,519 1,785,178 14,331,268 1,762,621 32,251 22,557 2008 14,655,950 1,831,733 14,560,930 1,770,298 95,020 61,435 2009 14,957,752 1,878,780 14,796,293 1,783,276 161,459 95,504 2010 15,268,588 1,925,775 15,034,354 1,798,846 234,234 126,929 2011 15,587,830 1,972,021 15,273,697 1,707,695 314,133 264,326 第一次推計 (FSP) 第二次推計 (SSP) 差 (FSP-SSP)(A−4)2004年・社会経済調査(Cambodia Socio-Economics Survey 2003-04,
CSES 2003-04)掲載統計
Table 01: 性別年齢別推計人口、1994 年および 2004 年(人)
Table 02: 経済活動人口、就業・失業率(10 歳以上人口、%)
Cambodia Phnom Penh Other Urban Rural 合計 74.6 60.8 69.5 77.0 男性 78.9 65.1 73.1 81.4 女性 70.7 56.7 66.0 73.0 合計 99.2 96.7 98.7 99.5 男性 99.2 97.3 98.8 99.4 女性 99.1 96.2 98.6 99.5 合計 0.8 3.3 1.3 0.5 男性 0.8 2.7 1.2 0.6 女性 0.9 3.8 1.4 0.5 労働力参加比率 就業率 失業率1 9 9 4 年
総人口
総人口
男性
女性
0-4
1,915,000
1,531,000
777,000
754,000
5-9
1,762,000
1,779,000
902,000
877,000
10-14
1,500,000
1,818,000
925,000
893,000
15-19
855,000
1,705,000
876,000
830,000
20-24
899,000
1,443,000
717,000
726,000
25-29
851,000
815,000
388,000
427,000
30-34
759,000
852,000
407,000
445,000
35-39
560,000
802,000
379,000
423,000
40-44
458,000
710,000
334,000
376,000
45-49
354,000
520,000
214,000
306,000
50-54
290,000
417,000
171,000
245,000
55-59
238,000
313,000
131,000
182,000
60-64
202,000
245,000
103,000
141,000
65-69
153,000
186,000
77,000
108,000
70-74
92,000
138,000
57,000
81,000
75+
98,000
165,000
66,000
99,000
総人口
10,990,000
13,439,000
6,526,000
6,914,000
年齢階層
2 0 0 4 年
Table 03: 教育水準別・年齢別経済活動人口(%)
Table 04: 就業ステイタス別・性別就業人口(10 歳以上、%)
∼(略)∼
Table 05: 就業ステイタス別・都市農村別就業人口(10 歳以上、%)
∼(略)∼
Table 06: 永住者と地域間移動者の教育水準の差異(%)
∼(略)∼
Table 07: 転居の理由(%)
∼(略)∼
Table 08: 生産農産物別家計数(%)
Main group of crop production
雨期
乾期
Total
穀物
71.3
37.7
61.6
塊茎・豆類
3.4
6.0
4.1
産業用作物(一時的)
4.7
6.9
5.3
野菜
5.7
12.3
7.6
果実・ナッツ類
10.5
27.5
15.4
産業用作物(永続的)
3.6
8.1
4.9
その他分類
0.8
1.4
0.9
未修了 修了 低学年 高学年 10-14 11.3 78.1 10.4 0.2 - - 100 15-19 13.4 42.2 34.5 8.9 1.0 0.1 100 20-24 18.9 36.3 25.4 11.6 5.7 2.0 100 25-29 23.7 37.0 22.4 9.1 5.3 2.6 100 30-34 21.9 34.0 26.6 8.7 6.0 2.8 100 35-39 26.6 37.5 22.0 7.9 3.9 2.0 100 40-44 32.3 43.0 15.8 6.2 1.3 1.3 100 45-49 31.9 40.7 14.3 9.2 2.6 1.3 100 50-54 32.9 39.1 16.6 8.4 1.8 1.1 100 55-59 37.2 34.1 16.7 9.0 2.3 0.7 100 60-64 49.8 26.2 15.5 6.6 1.8 0.1 100 65+ 64.0 22.8 8.2 4.3 0.4 0.2 100 Total 23.7 42.4 21.8 7.8 3.0 1.3 100 Total population 1,773,000 3,177,000 1,635,000 586,000 226,000 99,000 7,496,000 中等学校以上 合計 全く/ほとん ど 受けて いない 初等学校 Age group 中等学校Table 09: 季節別農業生産コスト(%)
Table 10: 季節別農産物生産(百万リエル/平米)
Gross output
Net output
Gross output
Net output
穀物
1,313
1,286
1,282
1,242
塊茎・豆類
158
152
305
300
産業用作物(一時的)
589
577
689
677
野菜
906
873
296
288
果実・ナッツ類
1,833
1,689
449
441
産業用作物(永続的)
168
165
130
127
その他分類
310
288
212
211
Total
1,242
1,210
787
765
Main group of crop
production
雨 期
乾 期
Item 雨期 乾期 Total 農業資材 19.0 18.6 18.9 化学肥料 24.6 20.0 23.2 動植物性肥料 6.4 1.6 4.9 殺虫剤、除草剤、殺菌剤 1.4 7.5 3.3 電気、石油、ガス(農耕用) 1.9 10.7 4.7 格納 3.2 2.6 3.0 従業員への支払い 25.1 16.5 22.4 その他賃貸労務費 7.4 7.2 7.3 灌漑費 1.9 8.5 4.0 政府他からのサービス/技術サポート 0.0 0.1 0.1 政府からの/技術サポートサービスおよび製品 2.1 2.9 2.4 農畜産用建物の修理費 1.3 0.5 1.0 農機具の修理 2.4 1.4 2.1 地代(現金) 2.1 1.5 1.9 地代(現物) 1.1 0.3 0.9 地代(設備・建物) 0.2 0.2 0.2 Total 100 100 100Table 11: 性別年齢別識字率(%)(左)
Table 12: 成人識字率(%)(右)
Table 13: 教育水準(25 歳以上人口、%)
Table 14: 病気や怪我の状況(%)
調査前 4 週間内に病気や怪我をした人の割合
∼(略)∼
Table 15: 常習的喫煙者(15 歳以上人口、%)
∼(略)∼
Table 16: 都市農村別住宅の空き状況(%)
∼(略)∼
Phnom
Penh
Other
Urban
Rural
全く/ほとんど 受けていない(1年未満)
11.4
25.6
36.1
初等学校未修了(1∼5年生)
25.9
31.8
37.6
初等学校修了( 6∼8年生)
23.3
22.4
16.9
中等学校低学年(9∼11年生)
16.2
11.1
6.0
中等学校高学年(12学年修了)
13.9
7.0
1.9
中等学校以上
8.0
1.0
0.2
Other
1.3
1.1
1.4
Total
100
100
100
Educational attainment
Stratum
Survey 成人識字率 男性 女性 合計 CSES 1993/94 67.1 15-24 84.3 76.6 80.5 CSES 1996 66.4 25-34 79.2 63.8 71.1 Demographic Survey 1996 68.7 35-44 77.1 55.8 65.8 CSES 1997 67.2 45-54 80.1 53.4 64.4 Population Census 1998 67.3 55-64 80.6 34.4 53.9 CSES 1999 71.5 65+ 62.8 12.4 33.3 Inter-censal survey 2004 73.6 15+ 80.2 60.1 69.6 CSES 2004 69.6 Age Group 性別Table 18: 季節、都市農村別、飲料水の主たる確保手段(%)
∼(略)∼
Table 19: 都市農村別、下水の状況(%)
∼(略)∼
Table 20: 耐久消費財保有状況(%)
Cambodia
Phnom Penh
Other Urban
areas
Rural areas
ラジオ/ステレオ
51.8
73.9
56.7
49.0
テレビ
46.1
87.3
56.8
40.7
携帯電話/電話
12.9
65.3
28.1
5.8
ビデオ
6.1
26.0
13.1
3.3
カメラ
2.2
12.4
4.1
1.0
パソコン
1.4
13.4
1.8
0.2
プリンター
0.4
3.5
0.1
0.1
楽器
0.6
1.0
0.4
0.5
スポーツ器具
0.3
1.1
0.6
0.2
衛星放送受信アンテナ
0.5
0.7
0.6
0.4
自転車
64.1
48.0
56.9
66.6
オートバイ
28.6
72.6
42.1
22.5
車/ジープ/バン
3.0
17.3
6.8
1.1
手漕ぎ/モーターボート
9.7
0.1
9.9
10.6
ミシン
6.0
22.0
8.6
4.1
冷蔵庫
1.9
17.8
3.4
0.1
台所設備
2.9
26.0
5.9
0.3
電気アイロン
8.2
58.6
22.3
1.4
電気扇風機
12.4
78.6
32.7
3.3
エアコン
0.9
8.0
1.5
0.2
スーツケース
21.0
21.4
32.1
19.5
発電機
2.0
2.6
2.7
1.9
蓄電池
57.3
5.8
31.6
65.7
ソファーセット
3.2
20.3
6.9
1.0
ダイニングセット
6.9
34.2
15.9
3.0
賭けセット
30.4
78.6
51.3
23.0
タンス/キャビネット
18.2
68.0
32.9
11.5
馬鍬/レーキ(熊手型農機具)
83.1
33.7
80.1
88.3
鋤
35.9
1.3
18.1
41.6
カート
25.4
1.3
14.4
29.2
ウォータポンプ
8.3
0.9
5.7
9.3
トラクタ
2.6
0.0
2.5
2.8
精米機
2.0
0.1
1.3
2.3
脱穀機
1.5
0.3
1.4
1.6
ブルドーザー
0.3
0.0
0.4
0.4
Table 21: 時間使用(一日当たり・時間)
∼(略)∼
Table 22: 生産年齢世代の時間使用、教育水準別(一日当たり・時間)
Table 23: 生産年齢世代の時間使用(一日当たり・時間)
∼(略)∼
Table 24: 学校や宿題で過ごす時間
∼(略)∼
Table 25: 児童労働(一日当たり・時間)
Table 26: 非就学児童の時間使用(一日当たり・時間)
Population
Market
work
Agriculture
work
Total
Boys
2,324,000
0.5
1.4
1.9
Girls
2,210,000
0.7
0.9
1.6
Mon-Sat
0.6
1.1
1.7
Sunday
0.6
1.3
1.9
5-7
992,000
0.1
0.2
0.3
8-9
747,000
0.1
0.7
0.8
10-14
1,791,000
0.6
1.4
2.0
15-17
1,004,000
1.5
1.9
3.4
Total
4,534,000
0.6
1.1
1.7
Population Market Work
Agriculture
Work
Total
Not Compl.Primary
2,355,000
3.0
2.1
5.1
Primary
1,384,000
3.6
1.8
5.4
Lower secondary
783,000
3.8
1.3
5.1
Upper secondary
121,000
3.9
0.4
4.3
Vocational
59,000
4.1
0.5
4.6
Beyond secondary
68,000
5.3
0.3
5.6
No education, Other
1,590,000
2.5
2.1
4.6
Table 28: 高齢者の時間使用(一日当たり・時間)
∼(略)∼
(A−5)国民所得統計(National Account, NA)掲載統計
Table 01: 国内総生産 (GDP) と一人当たり GDP
1993r/ 1994r/ 1995r/ 1996r/ 1997r/ 1998r/ 1999r/
GDP in billion Riels 6,793 7,092 8,438 9,191 10,129 11,719 13,408
Growth Rate in Percent (%) 4.4 19.0 8.9 10.2 15.7 14.4
Per Capita GDP in '000 Riels 628 635 734 778 839 955 1,075
Growth Rate in Percent (%) 1.3 15.5 6.0 7.9 13.8 12.5
GDP in million US $ 2,473 2,760 3,420 3,481 3,387 3,105 3,515
Growth Rate in Percent (%) 11.6 23.9 1.8 -2.7 -8.3 13.2
Per Capita GDP in US $ 228 247 297 295 281 253 282
Growth Rate in Percent (%) 8.2 20.3 -1.0 -4.7 -9.8 11.4
Household Final Consumption
Expenditure (HFCE) 6,713 6,571 7,812 8,749 8,932 10,887 11,732
Per Capita HFCE in '000 Riels 620 589 679 740 740 887 940
Monthly Per Capita HFCE in Riels 51,681 49,063 56,608 61,688 61,670 73,929 78,370
GDP in billion Riels 8,496 9,277 9,883 10,411 10,999 11,545 12,994
Growth Rate in Percent (%) 9.2 6.5 5.3 5.7 5.0 12.6
Per Capita GDP in '000 Riels 785 831 859 881 911 941 10,421
Growth Rate in Percent (%) 5.9 3.4 2.5 3.5 3.2 10.7
GDP in million US $ 3,093 3,610 4,006 3,944 3,677 3,059 3,407
Growth Rate in Percent (%) 16.7 11.0 -1.6 -6.7 -16.8 11.4
Per Capita GDP in US $ 286 323 348 334 305 249 273
Growth Rate in Percent (%) 13.2 7.7 -4.2 -8.7 -18.2 9.6
Household Final Consumption
Expenditure (HFCE) 8,087 8,476 9,206 10,020 9,906 10,908 11,639
Per Capita HFCE in '000 Riels 747 759 801 848 821 889 933
Monthly Per Capita HFCE in Riels 62,255 63,284 66,710 70,648 68,390 74,075 77,750
10.825 11.161 11.500 11.819 12.070 12.271 12.475 2747 2570 2467 2640 2991 3774 3814 r/- revised estimated p/- preliminary estimates 当該年価格(名目) 2000年固定価格(実質)
Population estimate (As of July, in million) (Estimated based on NIS )
Table 01: 国内総生産 (GDP) と一人当たり GDP(続き)
2000r/ 2001r/ 2002r/ 2003r/ 2004r/ 2005p/
GDP in billion Riels 14,089 15,579 16,768 18,250 21,141 25,350
Growth Rate in Percent (%) 5.1 10.6 7.6 8.8 15.8 19.9
Per Capita GDP in '000 Riels 1,111 1,209 1,280 1,369 1,560 1,833
Growth Rate in Percent (%) 3.4 8.8 5.9 7.0 13.9 17.5
GDP in million US $ 3,651 3,970 4,276 4,591 5,265 6,195
Growth Rate in Percent (%) 3.9 8.7 7.7 7.4 14.7 17.7
Per Capita GDP in US $ 288 308 326 345 389 448
Growth Rate in Percent (%) 2.2 7.0 5.9 5.6 12.8 15.3
Household Final Consumption
Expenditure (HFCE) 12,211 12,949 13,715 14,880 17,513 20,872
Per Capita HFCE in '000 Riels 963 1,005 1,047 1,117 1,292 1,509
Monthly Per Capita HFCE in Riels 80,250 83,720 87,219 93,049 107,705 125,783
GDP in billion Riels 14,089 15,169 16,108 17,493 19,234 21,812
Growth Rate in Percent (%) 8.4 7.7 6.2 8.6 10.0 13.4
Per Capita GDP in '000 Riels 1,111 1,177 1,229 1,313 1,420 1,577
Growth Rate in Percent (%) 6.7 5.9 4.5 6.8 8.1 11.1
GDP in million US $ 3,651 3,866 4,108 4,401 4,790 5,330
Growth Rate in Percent (%) 7.2 5.9 6.3 7.1 8.8 11.3
Per Capita GDP in US $ 288 300 314 330 354 385
Growth Rate in Percent (%) 5.4 4.2 4.5 5.3 7.1 9.0
Household Final Consumption
Expenditure (HFCE) 12,211 12,498 13,194 14,234 16,024 17,988
Per Capita HFCE in '000 Riels 963 970 1,007 1,068 1,183 1,301
Monthly Per Capita HFCE in Riels 80,250 80,804 83,908 89,013 98,547 108,400
12.680 12.889 13.104 13.326 13.550 13.828
3859 3924 3921 3975 4015.5 4092.25
r/- revised estimated p/- preliminary estimates
Population estimate (As of July, in million) (Estimated based on NIS )
Official Exchange rate (Riels/US$) (Average mid-point buying and selling rate)
(cont'd) 当該年価格(名目)
Table 02: 経済活動別国内総生産(当該年価格)
Bil. Riels 1993r/ 1994r/ 1995r/ 1996r/ 1997r/ 1998r/ 1999r/ 農林水産業 3,066.30 3,224.10 4,028.90 4,080.30 4,493.50 5,211.70 5,502.80 穀物 1,168.80 1,313.00 1,994.40 1,941.30 2,056.20 2,423.40 2,541.30 家畜・家禽 479.2 436.2 500.4 563.6 575.4 694.3 844.2 漁業 1,133.20 953.2 1,034.40 1,175.60 1,229.10 1,470.60 1,575.70 林学・伐採 285 521.8 499.7 399.8 632.7 623.4 541.6 鉱工業 861.6 975 1,202.80 1,379.20 1,662.40 1,958.40 2,413.00 鉱業 13.1 15.9 19.4 19.5 20.4 19.2 26.4 製造業 587.1 629.1 771.3 929 1,180.90 1,483.90 1,765.20 食物、飲料、タバコ 281.7 267.4 345.8 357.5 377.4 443.8 481.5 織物、衣服、履き物 70.9 79.6 123.2 197.8 379.3 584.1 790.3 木製品、紙、および出版 82.8 118.2 108.7 142.2 166.6 170.9 151.4 ゴム製造 23.5 22.3 31.4 42.4 48.8 46.4 55.7 その他製造業 128.1 141.6 162.3 189.1 208.9 238.8 286.3 非金属 25.3 30 35.7 35.8 39 40.2 51.4 金属製品 8.7 10.2 12.5 12.4 13.3 12.9 18.6 その他製造業 94.1 101.5 114 140.9 156.6 185.6 216.3 電気、ガス、水道 24.1 30.8 36 44 49.2 59.2 56.8 建設 237.3 299.2 376.2 386.8 411.9 396 564.5 サービス業 2,686.00 2,576.00 2,883.60 3,310.90 3,559.80 4,079.10 4,740.70 交易 993 923.2 1,002.30 1,141.70 1,230.60 1,361.30 1,476.10 宿泊、飲食 154.6 195.4 233.7 250.4 291.4 323.9 419.2 輸送、通信 373.2 394.8 441.2 522 562.5 635.3 810.7 金融 23.8 27.4 76.5 86.5 97.8 100.3 129.5 公務 142.2 228.5 233.7 296.2 305 333.2 388.6 不動産 622.2 451.5 483.4 537 601.1 733.9 764.7 その他サービス 377.1 355.2 412.8 477.1 471.3 591.2 751.9 税および補助金 194.5 334.4 395.3 483.5 536.9 594.1 865.3 控除: 補助金 2.3 4.5 11.9 15 6.3 14.2 11.9 控除: FISIM 15 17 73 63 123 124 114GROSS DOMESTIC PRODUCT (GDP) 6,793.50 7,092.30 8,437.70 9,190.70 10,129.50 11,718.80 13,407.50
r / - revised estimates p/ - preliminary estimates
Table 02: 経済活動別国内総生産(当該年価格)(続き)
Bil. Riels 2000r/ 2001r/ 2002r/ 2003r/ 2004r/ 2005p/ 農林水産業 5,065.00 5,423.20 5,402.10 5,949.80 6,538.40 8,207.80 穀物 2,327.80 2,364.00 2,276.80 2,879.40 3,356.00 4,537.30 家畜・家禽 757 822.5 858.4 880.1 940.3 1,192.10 漁業 1,515.90 1,746.90 1,781.90 1,722.30 1,753.70 1,892.00 林学・伐採 464.3 489.9 485 468.1 488.4 586.4 鉱工業 3,078.00 3,497.40 4,096.10 4,664.60 5,536.10 6,412.20 鉱業 33.5 39.8 47.7 57.9 73.8 95.3 製造業 2,254.80 2,637.70 2,977.50 3,397.20 4,054.30 4,583.10 食物、飲料、タバコ 449.4 476.4 475.2 507.2 550.1 657.2 織物、衣服、履き物 1,297.10 1,680.90 1,973.10 2,293.70 2,847.50 3,158.30 木製品、紙、および出版 132.4 103 111.8 104.9 119.4 144.2 ゴム製造 69.2 61.7 73.6 110.7 119.3 125.5 その他製造業 306.7 315.7 343.7 380.8 418 498 非金属 62.2 63 72.8 77.5 84.8 104.5 金属製品 24.3 24.9 32.8 37 43.9 54.1 その他製造業 220.2 227.8 238.1 266.2 289.4 339.5 電気、ガス、水道 58.1 69.6 85.5 103.6 120.4 128.8 建設 731.6 750.3 985.4 1,106.30 1,287.60 1,604.90 サービス 業 5,230.90 5,876.40 6,380.60 6,737.40 7,920.40 9,385.40 交易 1,512.00 1,590.20 1,617.60 1,684.80 1,920.10 2,259.20 宿泊、飲食 520.9 686.4 857 720 893.2 1,071.90 輸送、通信 930.1 998.6 1,085.80 1,142.90 1,364.10 1,689.90 金融 175.1 152.5 169.7 184.1 232.3 294.1 公務 376.6 359.2 390.5 405.7 419.1 463.9 不動産 855 967.1 998.6 1,190.90 1,327.00 1,459.30 その他サービス 861.2 1,122.40 1,261.40 1,409.10 1,764.50 2,147.00 税および補助金 870.2 920.7 1,040.40 1,065.20 1,351.90 1,597.50 控除: 補助金 31.2 31.7 51 60.1 63.8 63.8 控除: FISIM 155 139 151 167 206 253GROSS DOMESTIC PRODUCT (GDP) 14,089.30 15,578.70 16,768.20 18,250.10 21,140.60 25,350.10
r / - revised estimates p/ - preliminary estimates
Table 03:経済活動別国内総生産(2000年固定価格)
Bil. Riels
1993r/ 1994r/ 1995r/ 1996r/ 1997r/ 1998r/ 1999r/
AGRICULTURE, FISHERIES & FORESTRY 3,873.90 4,259.30 4,408.10 4,459.00 4,703.70 4,942.00 5,124.00
Crops 1,594.40 1,637.50 1,820.50 1,878.50 1,853.00 2,003.20 2,313.00
Livestock & Poultry 759.1 737.3 784.1 794 792.5 842.8 833.1
Fisheries 1,158.20 1,205.30 1,304.70 1,364.90 1,441.70 1,476.60 1,443.20
Forestry & Logging 362.2 679.1 498.8 421.5 616.5 619.4 534.6
INDUSTRY 1,100.90 1,257.30 1,495.00 1,560.60 1,822.90 1,936.10 2,346.20
Mining 17.8 23 27.5 23.8 23.3 20.1 26.6
Manufacturing 683.1 744.5 874.8 984.5 1,255.30 1,445.50 1,730.60
Food, Beverages & Tobacco 358.6 341 409.1 410.3 420.9 446.4 467.6
Textile, Wearing Apparel & Footwear 63.1 78.9 130.2 204.8 399.2 547.5 771.2
Wood, Paper & Publishing 67.7 124.8 112.7 122.6 177 153.6 146.5
Rubber Manufacturing 23 21.5 24.7 29.9 31.1 54.8 62.9
Other Manufacturing 170.6 178.3 198.2 216.9 227.1 243.2 282.4
Non-Metallic Manufacturing 34.8 40.6 48.8 44.4 45 42.3 51.9
Basic Metal and Metal Products 13.9 15.7 19 17.7 17.7 15.7 18.1
Other manufacturing 121.9 122.1 130.5 154.7 164.4 185.2 212.4
Electricity, gas & water 25.6 27.8 34.7 41.7 46.6 50.8 54.4
Construction 374 462 558 511 498 420 535
SERVICES 3,261.90 3,282.20 3,553.90 3,880.40 3,994.70 4,192.90 4,804.40
Trade 1,232.80 1,166.60 1,231.70 1,294.00 1,365.60 1,376.90 1,446.90
Hotel & Restaurants 202.3 241.8 332.9 343 363.6 352.2 437.8
Transport & Communications 537.5 595.7 635.8 707.4 665.8 681.7 876.7
Finance 28 34.4 88 97.3 107.3 100.1 128.4
Public Administration 167.6 287.1 268.7 333 346.9 384.2 379.8
Real Estate & Business 717 551.7 574.3 616.9 663.1 734.9 796.7
Other services 376.7 404.9 422.5 488.8 482.2 562.8 738.2
Taxes on Products less Subsidies 276.6 500.2 509.4 582.2 613.1 598.1 832.6
Less: Subsidies 85.4 2.3 4.7 10.7 20.5 7.9 15.2
Less: FISIM 17.6 21.6 83.9 71.1 135 124.2 113.4
GROSS DOMESTIC PRODUCT (GDP) 8,495.60 9,277.30 9,882.50 10,411.10 10,999.40 11,544.90 12,993.80
r / - revised estimates p/ - preliminary estimates
Table 03:経済活動別国内総生産(2000年固定価格)(続き)
Table 04:経済活動別国内総生産(当該年価格)・成長率
∼(略)∼
Table 05:経済活動別国内総生産(2000年固定価格)・成長率
∼(略)∼
Bil. Riels 2000r/ 2001r/ 2002p/ 2003r/ 2004p/ 2005p/AGRICULTURE, FISHERIES & FORESTRY 5,065.00 5,294.00 5,180.10 5,809.30 5879.7 6854.5
Crops 2,327.80 2,378.90 2,275.00 2,830.20 2,878.00 3,683.60
Livestock & Poultry 757 847.4 843 898.4 938.9 993
Fisheries 1,515.90 1,605.20 1,615.00 1,641.90 1,614.40 1,705.30
Forestry & Logging 464.3 462.5 447.2 438.9 448.4 472.6
INDUSTRY 3,078.00 3,430.10 4,024.90 4,511.50 5,252.40 5,888.20
Mining 33.5 37.4 47 55.5 68.9 85.8
Manufacturing 2,254.80 2,613.40 2,994.00 3,359.10 3,949.20 4,333.10
Food, Beverages & Tobacco 449.4 469.7 466.3 488.4 483.8 522.4
Textile, Wearing Apparel & Footwear 1,297.10 1,665.70 2,021.40 2,360.30 2,946.80 3,249.70
Wood, Paper & Publishing 132.4 93 93.7 80.4 84 89.5
Rubber Manufacturing 69.2 69.7 69.2 62.4 55.3 50.4
Other Manufacturing 306.7 315.2 343.3 367.5 379.4 421.1
Non-Metallic Manufacturing 62.2 63.1 73.3 76.9 79.1 91.8
Basic Metal and Metal Products 24.3 25.2 33.3 38 40.1 40.9
Other manufacturing 220.2 226.9 236.7 252.6 260.2 288.3
Electricity, gas & water 58.1 61.1 71.2 82.6 86.4 90.2
Construction 732 718 913 1,014 1,148 1,379
SERVICES 5,230.90 5,687.50 6,045.10 6,309.70 7,050.30 7,905.60
Trade 1,512.00 1,543.90 1,564.90 1,596.20 1,684.50 1,826.00
Hotel & Restaurants 520.9 638.9 758.6 631.5 779.5 914.5
Transport & Communications 930.1 995.8 1078.2 1091.7 1174.1 1328.3
Finance 175.1 147.8 163.8 176.7 213.3 254.5
Public Administration 376.6 353.5 357.2 343.1 321.2 340.1
Real Estate & Business 855 960.5 975.4 1192.3 1342.7 1435.9
Other services 861.2 1047.3 1147 1278.2 1535 1806.3
Taxes on Products less Subsidies 870.2 892 1004.2 1022.4 1241.3 1382.9
Less: Subsidies 11.5 31.2 30.8 49.2 57.7 57.7
Less: FISIM 154.8 134.7 145.8 160.5 189.3 218.8
GROSS DOMESTIC PRODUCT (GDP) 14,089.30 15,168.90 16,108.50 17,492.50 19,234.40 21,812.40
r / - revised estimates p/ - preliminary estimates
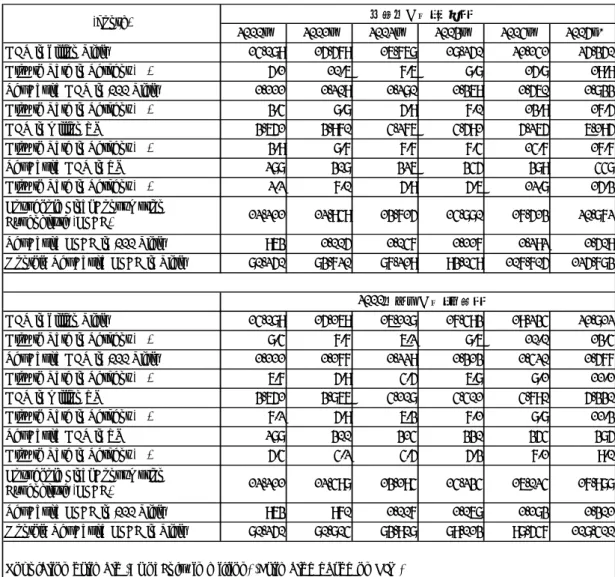
(A−6)消費者物価指数(Consumer Price Index, CPI)掲載統計
Table 01: 消費者物価、2007年(プノンペン)
(a.原指数)
∼(略)∼
(b.前年同期変化率)
Table 02: 2006 ∼ Table 07:2001
∼(略)∼
Table 08: 消費者物価、都市部
Urban Cambodia Major Groups March Qtr06 Index June Qtr 06Index Sept. Qtr 06 Index Dec. Qtr 06Index March Qtr07 Index June Qtr 07Index
% Change Jun.Qtr 07 to Mar Qtr 07 % Change Jun. Qtr 07 to Jun Qtr 06 食物、飲料、タバコ 126.71 127.41 133.31 133.44 132.96 137.76 4.23 8.12 衣服、履き物 99.17 100.03 101.04 102.08 102.44 103.32 0.86 3.29 住居・設備 119.41 120.39 122.44 122.83 122.95 123.78 0.67 2.82 家具 99.40 99.68 100.40 100.72 101.16 103.36 2.17 3.69 医療 103.61 104.45 105.44 105.61 105.73 107.21 1.40 2.65 輸送、通信 133.51 136.51 141.89 142.12 140.23 141.77 1.10 3.86 娯楽、教育 114.66 115.40 115.34 115.68 115.49 115.60 0.10 0.18 パーソナルケア 110.43 110.86 110.95 111.43 112.09 113.39 1.16 2.28 All groups 122.59 123.50 127.41 127.89 127.21 130.56 2.63 5.72 食物、飲 料、タバ コ 衣服、履 き物 住居・設 備 家具 医療 輸送、通 信 娯楽、教 育 パーソナ ルケア 総指数 All items Housing & Utilities 2007 January -0.07 0.12 0.15 0.20 0.05 -1.91 0.03 0.23 -0.16 -0.30 -0.21 February 0.23 1.49 0.09 0.13 0.01 1.00 0.00 0.05 0.26 0.52 0.40 March 1.05 0.25 0.02 0.34 0.01 0.50 0.13 0.28 0.53 0.54 0.09 1st Quarter -1.18 0.05 0.18 0.46 0.19 -1.13 -0.34 0.53 -0.57 -0.78 -0.02 April 1.42 0.29 0.19 0.57 0.11 1.02 0.00 0.21 0.80 1.08 0.85 May 1.26 -0.87 0.00 0.14 0.10 1.85 0.00 0.08 0.72 0.97 0.01 June 4.60 0.41 0.48 0.11 -1.07 -0.95 -0.67 0.26 2.04 2.73 2.13 2nd Quarter 4.65 0.51 0.40 0.98 -0.17 2.62 -0.14 0.55 2.42 3.21 1.78 July 3.31 0.57 -0.43 1.80 1.01 2.83 9.87 -0.58 2.41 2.96 -1.86 August 0.77 0.75 -0.06 0.39 4.67 -0.48 -7.51 0.66 0.02 0.03 -0.27 September 3.59 1.08 0.18 0.26 -0.36 -0.13 0.44 0.24 1.75 2.30 0.80 3rd Quarter 8.70 1.41 -0.09 2.28 3.32 2.44 4.05 0.13 4.47 5.98 -0.39 October 3.16 0.89 0.22 0.96 0.65 2.03 1.15 -1.65 1.82 2.39 1.00 November -1.37 -0.02 0.24 1.09 0.19 4.90 -1.28 0.38 -0.17 -0.23 1.06 December 0.40 -0.43 0.53 -0.67 0.13 1.84 -0.53 0.23 0.50 0.66 2.32 4th Quarter 5.04 1.71 0.66 1.77 2.10 5.76 -2.23 -0.95 3.06 4.03 2.96 Ann.Ave.07 10.00 3.21 1.83 3.58 3.24 5.80 1.56 1.18 5.85 7.63 5.57 Month Quarter and Year
Table 09: 都市別消費者物価
Table 10: 消費者物価、都市部(総指数)
Table 11: 消費者物価、都市部(食料、飲料及びたばこ)∼
Table 18: 消費者物価、都市部(身の回り品)
∼(略)∼
Battambang KampongCham Kandal Siem Reap SihanoukVille UrbanOther PhnomPenh Urban
January 137.27 137.63 135.92 135.49 136.24 135.44 121.26 126.85 -0.12 3.19 February 137.65 137.85 136.18 135.78 136.59 136.76 121.71 127.25 0.32 3.87 March 137.63 137.54 136.07 135.28 136.75 136.65 122.22 127.54 0.22 4.27 Quarter 1 137.52 137.67 136.06 135.52 136.53 136.62 121.73 127.21 -0.53 3.77 April 138.82 138.22 136.93 136.40 137.89 137.73 123.20 128.55 0.80 4.67 May 139.55 138.91 138.26 137.13 138.49 138.49 124.09 129.39 0.65 4.70 June 148.43 146.38 148.00 145.11 144.76 146.35 126.40 133.74 3.36 7.77 Quarter 2 142.27 141.17 141.06 139.55 140.38 140.86 124.56 130.56 2.63 5.72 Annual % change 2007
Provincial City Capital City
Period % change 2004年~2006年 ( 略) Month Quarter and Year
Phnom Penh and Provincial Cities (Including Rent) Mar.Qtr 06 Index Jun.Qtr 06 Index Sep.Qtr 06 Index Dec.Qtr 06 Index Mar.Qtr 07 Index Jun.Qtr 07 Index % Change Jun.Qtr 07 to Mar.Qtr 07 % Change Jun.Qtr 07 to Jun.Qtr 06 Battambang 129.22 129,87 136.16 138.56 137.52 142.27 3.45 9.55 Kampong Cham 131.07 131.2 134.72 137.32 137.67 141.17 2.54 7.6 Kandal 131.71 132.09 134.92 137.15 136.06 141.06 3.68 6.79 Siem Reap 127.64 129.54 134.55 136.3 135.52 139.55 2.97 7.73 Sihanouk Ville 132.02 132.66 135.39 137.13 136.53 140.38 2.82 5.82 Other Urban 130.14 131 135.3 137.36 136.62 140.86 3.1 7.53 Phnom Penh 118.18 119.13 122.8 122.38 121.73 124.56 2.33 4.56 Total Urban 122.59 123.5 127.41 127.89 127.21 130.56 2.63 5.72
(A−7)センサス中間年人口推計(Cambodia Inter-censal Population Survey
2004, CIPS2004)掲載統計
Table 01: 人口増加率
∼(略)∼
Table 02: 家計数及び家計構成人数推計
Table 03: 婚姻状況(15歳以上人口)
∼(略)∼
Table 04: 識字率
∼(略)∼
Table 05: 経済活動参加率
合計 男性 女性 合計 男性 女性 合計 男性 女性 Total 7+ 65.5 66.4 64.6 56.5 60.3 52.9 67.1 67.5 66.8 7 - 9 4.8 5.1 4.4 1.0 0.9 1.1 5.3 5.7 4.9 10 - 14 22.4 22.8 22.0 9.4 8.3 10.6 24.5 25.2 23.8 15 - 24 75.7 73.7 77.6 58.4 57.3 59.4 79.2 76.9 81.4 25 - 34 94.2 98.5 90.3 85.3 96.1 75.3 96.0 99.0 93.2 35 - 44 95.0 99.3 91.4 87.5 98.6 77.6 96.5 99.5 94.0 45 - 54 93.6 98.3 90.5 84.9 96.2 76.3 95.4 98.7 93.1 55 - 64 83.9 93.7 76.7 69.6 82.3 60.7 86.2 95.5 79.4 65+ 43.4 60.6 31.8 30.9 50.2 18.0 45.3 62.1 33.9Total Urban Rural
Age group
Persons Males Females
Total 2,530 12,824 6,197 6,627 5.1 (5.2)
Urban 358 1,921 932 989 5.4 (5.5)
Rural 2,172 10,903 5,265 5,638 5.0 (5.1)
* Refers to regular households only
** Figure within brackets is the corresponding household size in 1998
Average household size Total/ Urban/ Rural No. of Households* (In thousands)
Table 06: 人口移動率
Table 07: 雇用形態別構成
Table 08: 就業率
合 計 男 性 女 性 合 計 男 性 女 性 合 計 男 性 女 性 Total 7+ 60.8 61.3 60.3 52.8 56.9 49.1 62.2 62.1 62.4 7 - 9 2.1 2.5 1.7 0.4 0.4 0.5 2.4 2.8 1.9 10 - 14 13.8 13.7 13.8 6.3 5.6 7.1 15.0 15.0 14.9 15 - 24 68.1 65.0 71.2 51.6 50.0 53.0 71.5 67.9 75.0 25 - 34 92.0 96.4 88.1 82.3 93.5 71.7 94.0 96.9 91.2 35 - 44 93.3 98.2 89.2 85.4 97.5 74.6 94.8 98.4 91.9 45 - 54 91.9 96.9 88.5 82.8 94.6 73.7 93.7 97.4 91.2 55 - 64 81.8 92.7 73.9 67.6 81.0 58.3 84.2 94.5 76.5 65+ 41.1 58.2 29.5 28.7 47.6 16.0 42.9 59.8 31.5Total Urban Rural
Age group
Total
雇用主
有給従業
員
自営
無給の家
族労働者
その他
合計
100
0.2
12.9
41.0
45.7
0.2
男性
100
0.3
16.8
53.1
29.6
0.2
女性
100
0.2 9.3
29.7
60.7
0.1
Both Sexes
100
0.5
30.8
40.7
27.6
0.4
Males
100
0.6
39.2
43.1
16.6
0.5
Females
100
0.4
21.9
38.2
39.2
0.3
Both Sexes
100
0.2
10.2
41.0
48.5
0.1
Males
100
0.2 13.1
54.9
31.7
0.1
Females
100
0.2 7.5
28.5
63.7
0.1
Rural
性別
雇用形態
Total/
Urban/
Rural
Total
Urban
Males
Females
Total
100.0
100.0
100.0
Rural to Rural
68.9
69.6
68.4
Rural to Urban
13.9
13.4
14.3
Urban to Rural
7.0
7.2
6.7
Urban to Urban
10.2
9.8
10.6
Percentage of
Migrants
Both Sexes
(A−8)カンボジアの公式地名(Agreed Cambodia Area Name (Province, District,
Commune, Village) in English and Khmer)
Pro_Code Province Name Province Name in Khmer
1
Banteay Meanchey
បនាទយមានជ័យ
2Battambang
បាត់ដំបង
3Kampong Cham
កំពង់ចាម
4Kampong Chhnang
កំពង់ឆានំង
5Kampong Speu
កំពង់សពឺ
6Kampong Thom
កំពង់ធំ
7Kampot
កំពត
8Kandal
កណាតល
9Koh Kong
េកាះកុង
10Kratie
រកេចះ
11Mondul Kiri
មណឌលគិរី
12Phnom Penh
ភនំេពញ
13Preah Vihear
រពះវិហារ
14Prey Veng
ៃរពែវង
15Pursat
េពាធិ៍សាត់
16Ratanak Kiri
រតនគិរី
17Siemreap
េសៀមរាប
18Sihanoukville
រកុងរពះសីហនុ
19Stung Treng
សទឹងែរតង
20Svay Rieng
សាវយេរៀង
21Takeo
តាែកវ
22Oddar Meanchey
ឧតតរមានជ័យ
23Kep
រកុងែកប
24Pailin
រកុងៃប៉លិន
(A−9)行政及び保健施設一覧(Administrative and Health Facility Mapping)
地域別病院・診療所数
Provinces
Referral
Hospital
Operational
District
Health
Center
Health
Post
Banteay Meanchey
4
4
52
-Battambang
4
5
74
1
Kampong Cham
10
10
128
1
Kampong Chhnang
2
2
34
1
Kampong Speu
3
3
50
2
Kampong Thom
3
3
50
-Kampot
4
4
47
-Kandal
5
8
88
-Koh Kong
2
2
12
3
Kratie
2
2
22
4
Mondul Kiri
1
1
6
10
Phnom Penh
1
4
21
4
Preah Vihear
1
1
12
4
Prey Veng
7
7
90
1
Pursat
2
2
31
4
Ratanak Kiri
1
1
10
9
Siemreap
3
3
53
3
Sihanoukville
1
1
9
-Stung Treng
1
1
8
-Svay Rieng
3
3
37
-Takeo
5
5
70
-Oddar Meanchey
1
1
11
1
Kep
1
1
4
-Pailin
1
1
3
1
地域別病院・診療所の配置
(A−10)家内児童労働調査(Child Domestic Worker Survey 2003, CDWS2003)
掲載統計
Table 01: 一日あたり家内児童労働時間(性別・地域別)
人数 (%) 人数 (%) 人数 (%) 全体 27,950 19,772 70.7 5,341 19.1 2837.0 10.2 非スラム地域 15,277 9,391 61.5 3,731 24.4 2155.0 14.1 スラム地域 12,673 10,381 81.9 1,610 12.7 682.0 5.4 全体 11,570 10,342 89.4 853 7.4 374 3.2 非スラム地域 4,757 4,212 88.5 172 3.6 374 7.9 スラム地域 6,812 6,131 90.0 682 10.0 0 0.0 全体 16,380 9,430 57.6 4,488 27.4 2,463 15.0 非スラム地域 10,520 5,179 49.2 3,559 33.8 1,781 16.9 Both Male Female 家内児童 労働者数 1 ~5 時間 6 ~8 時間 9 ~1 3 時間 Sex/ district/ domainTable 02: 児童労働に対する認識
Table 03: 雇い主が児童労働者を学校等に通わせるための援助
∼(略)∼
Table 04: 教育水準(地域別)
Table 04: 教育水準(性別)
∼(略)∼
人数 (%) 人数 (%) 人数 (%) 人数 (%) 人数 (%) All Districts 27,950 100 1,382 4.9 16,455 58.9 9,900 35.4 213 0.8 Chamkarmon 2,820 100 269 9.5 1,552 55.0 998 35.4 0 0.0 Daun Penh 3,894 100 0 0.0 3,196 82.1 639 16.4 59 1.5 7 Makara 2,400 100 150 6.3 1,561 65.0 630 26.2 59 2.5 Tuol Kork 3,904 100 448 11.5 2,673 68.5 689 17.6 95 2.4 Dangkor 2,912 100 83 2.8 2,451 84.2 378 13.0 0 0.0 Meanchey 1,860 100 84 4.5 1,198 64.4 578 31.1 0 0.0 Russey Keo 10,161 100 348 3.4 3,825 37.6 5,988 58.9 0 0.0 All Districts 15,277 100 959 6.3 10,694 70.0 3,412 22.3 213 1.4 Chamkarmon 1,690 100 150 8.9 977 57.8 563 33.3 0 0.0 Daun Penh 3,231 100 0 0.0 2,590 80.2 582 18.0 59 1.8 7 Makara 1,937 100 150 7.8 1,175 60.7 553 28.5 59 3.0 Tuol Kork 3,160 100 289 9.2 2,087 66.0 689 21.8 95 3.0 Dangkor 2,635 100 83 3.1 2,174 82.5 378 14.3 0 0.0 Meanchey 731 100 84 11.5 386 52.8 261 35.7 0 0.0 Russey Keo 1,893 100 202 10.7 1,304 68.9 387 20.4 0 0.0 All Districts 12,673 100 423 3.3 5,762 45.5 6,488 51.2 0 0.0 Chamkarmon 1,130 100 120 10.6 575 50.9 435 38.5 0 0.0 Daun Penh 663 100 0 0.0 606 91.4 57 8.6 0 0.0 7 Makara 462 100 0 0.0 385 83.3 77 16.7 0 0.0 Tuol Kork 744 100 158 21.3 586 78.7 0 0.0 0 0.0 Dangkor 277 100 0 0.0 277 100.0 0 0.0 0 0.0 Meanchey 1,128 100 0 0.0 812 71.9 317 28.1 0 0.0 Russey Keo 8,269 100 146 1.8 2,521 30.5 5,602 67.7 0 0.0 初等教育 (1~6学年) Slum areas 中等教育 (7~12学年) その他 All areas Non-slum areas 地域 合計 未修了Number Percent Number Percent Number Percent
Total 205,042 100.0 121,578 100.0 83,464 100.0
As part of the family 178,397 87.0 104,166 85.7 74,231 88.9
As chipper labour (than adult) 3,579 1.7 1,770 1.5 1,808 2.2
As servant working for money 22,744 11.1 15,319 12.6 7,425 8.9
Others 43 0.0 43 0.0 0 0.0
Perception of CDW
Non-slum areas Slum areas
Total
ス ラム地域 非ス ラム地域
Table 05: 親もしくは保護者が児童に求める教育/職業教育(業種別・地域別)
Table 06: 雇い主が児童労働者を求めるチャネル
∼(略)∼
Table 07: 地区別情報(プノンペン)
Table 7-1: 家内児童労働者数(CDWs)
Table 7-2: CDWs の識字率
Table 7-3: 7 歳から 17 歳の人口分布
∼(略)∼
Table 7-4: 医療行為を受ける際の付添い人
∼(略)∼
Number
Percent
Number
Percent
Number
Percent
Male
11,183
97.0
386
3.0
11,570
100
Female
12,794
78.0
3,587
22.0
16,380
100
Non-Slum areas
12,378
81.0
2,899
19.0
15,277
100
Slum areas
11,599
91.5
1,074
8.5
12,673
100
Literacy
Illiterate
Total
Male
Female
Male
Female
Male
Female
Number
11,570
16,380
4,757
10,520
6,812
5,860
Percent
41.4
58.6
31.1
68.9
53.8
46.2
Total
Non-Slum areas
Slum areas
Number Percent Number Percent Number Percent
Total 3,119 100 1,718 100 1,401 100
Bicycle repairing 38 1.2 38 2.2 0 0.0
Machine repairing (engine, TV, radio, etc.) 995 31.9 403 23.5 592 42.3
Sewing 746 23.9 367 21.4 379 27.0
Combination 414 13.3 310 18.0 104 7.4
Others 926 29.7 600 35.0 326 23.3
B.国家統計局の統計サブページからアクセスできる統計
(B−1)1998年・人口センサス
Table 01: 家計数・人口、および家計のサイズ
Table 02: 地域別人口密度
Both Sexes
Males
Females
Cambodia
11,437,656
5,511,408
5,926,248 181,035(*)
64
1
Banteay Mean Chey
577,772
283,358
294,414
6,679
87
2
Bat Dambang
793,129
388,599
404,530
11,702
68
3
Kampong Cham
1,608,914
775,796
833,118
9,799
164
12
Phnom Penh
999,804
481,911
517,893
290
3,448
(*) Includes area of Tonle Sap lak e (3,000k m
2). Area figures from Ministry of Interior.
4~11 (略)
12~24 (略)
Population
Density
Code
Province
Population
Area (Km
2)
BothSexes Males Females
Cambodia 2,188,663 11,437,656 5,511,408 5,926,248 93.0 5.2
1 Banteay Mean Chey 111,856 577,772 283,358 294,414 96.2 5.1
2 Bat Dambang 148,356 793,129 388,599 404,530 96.1 5.3 3 Kampong Cham 312,841 1,608,914 775,796 833,118 93.1 5.1 12 Phnom Penh 173,678 999,804 481,911 517,893 93.1 5.7 4~11 (略) 12~24 (略) Sex Ratio Average Household Size Code Province Population Total Number of Households
Table 03: 年齢構成
Both
Sexes Males Females
Total 100 100 100 0 - 4 12.8 13.6 12.1 5 - 9 15.5 16.4 14.7 10 - 14 14.5 15.4 13.6 15 - 19 11.8 12.1 11.5 20 - 24 6.5 6.4 6.6 25 - 29 7.8 7.7 7.8 30 - 34 6.8 6.7 7.0 35 - 39 6.1 5.9 6.3 40 - 44 4.3 3.6 5.0 45 - 49 3.6 3.2 4.1 50 - 54 2.7 2.4 3.0 55 - 59 2.2 2.0 2.5 60 - 64 1.8 1.6 2.0 65 - 69 1.5 1.3 1.6 70 - 74 1.0 0.8 1.1 75 - 79 0.6 0.5 0.7 80+ 0.4 0.3 0.4 Both
Sexes Males Females
Both
Sexes Males Females
Total 100 100 100 100 100 100 0 - 4 10.8 11.3 10.3 13.2 14.1 12.5 5 - 9 13.4 14.0 12.8 15.9 16.9 15.0 10 - 14 13.8 14.4 13.2 14.6 15.6 13.7 15 - 19 13.0 12.9 13.1 11.5 11.9 11.2 20 - 24 7.2 7.2 7.1 6.4 6.3 6.5 25 - 29 8.8 9.0 8.6 7.6 7.5 7.6 30 - 34 7.6 7.9 7.4 6.7 6.5 6.9 35 - 39 6.9 7.0 6.8 5.9 5.7 6.2 40 - 44 5.1 4.6 5.7 4.2 3.4 4.9 45 - 49 4.0 3.7 4.3 3.6 3.1 4.0 50 - 54 2.8 2.5 3.1 2.7 2.4 3.0 55 - 59 2.1 1.9 2.3 2.3 2.0 2.5 60 - 64 1.6 1.3 1.8 1.8 1.6 2.0 65 - 69 1.2 1.0 1.4 1.5 1.3 1.7 70 - 74 0.8 0.6 1.0 1.0 0.9 1.1 75 - 79 0.5 0.4 0.6 0.6 0.5 0.7 80+ 0.3 0.4 0.4 0.4 0.3 0.4 Age Group 全国 Urban Rural Age Group
Table 04: 人口性比
Both
Sexes Males Females
Both
Sexes Males Females
Total 11,437,656 5,511,408 5,926,248 93 41 93,918 39,250 54,668 72 0 231,609 118,075 113,534 104 42 101,686 40,667 61,019 67 1 275,013 140,755 134,258 105 43 91,276 36,028 55,248 65 2 282,356 142,859 139,497 102 44 82,200 32,205 49,995 64 3 333,838 170,705 163,133 105 45 106,378 43,618 62,760 69 4 343,976 174,898 169,078 103 46 75,842 31,420 44,422 71 5 381,823 193,695 188,128 103 47 80,479 34,244 46,235 74 6 363,420 185,852 177,568 105 48 87,913 37,432 50,481 74 7 365,599 186,880 178,719 105 49 65,319 28,338 36,981 77 8 365,431 185,871 179,560 104 50 84,104 33,947 50,157 68 9 296,547 151,678 144,869 105 51 59,128 25,566 33,562 76 10 391,664 203,020 188,644 108 52 64,792 27,908 36,884 76 11 291,829 151,615 140,214 108 53 56,860 24,709 32,151 77 12 349,525 181,060 168,465 107 54 47,579 20,283 27,296 74 13 324,980 167,892 157,088 107 55 65,914 28,081 37,833 74 14 300,198 147,552 152,646 97 56 48,627 20,756 27,871 74 15 297,695 155,548 142,147 109 57 49,265 21,224 28,041 76 16 292,501 143,715 148,786 97 58 53,714 23,077 30,637 75 17 281,607 137,694 143,913 96 59 39,410 17,051 22,359 76 18 284,638 135,331 149,307 91 60 56,377 23,284 33,093 70 19 187,817 91,896 95,921 96 61 36,793 15,946 20,847 76 20 172,309 80,173 92,136 87 62 38,406 16,170 22,236 73 21 130,693 63,594 67,099 95 63 39,341 16,752 22,589 74 22 142,154 67,712 74,442 91 64 34,077 14,450 19,627 74 23 150,074 71,578 78,496 91 65 46,117 19,219 26,898 71 24 150,457 71,043 79,414 89 66 30,732 13,012 17,720 73 25 207,102 98,372 108,730 90 67 34,515 14,753 19,762 75 26 164,067 78,147 85,920 91 68 32,423 13,888 18,535 75 27 179,370 87,462 91,908 95 69 23,141 9,788 13,353 73 28 185,611 88,880 96,731 92 70 34,746 14,187 20,559 69 29 152,390 74,107 78,283 95 71 19,801 8,441 11,360 74 30 189,467 87,699 101,768 86 72 21,056 8,795 12,261 72 31 150,400 72,760 77,640 94 73 19,543 8,084 11,459 71 32 158,267 75,300 82,967 91 74 17,067 7,262 9,805 74 33 149,853 71,436 78,417 91 75 22,324 9,338 12,986 72 34 134,695 62,895 71,800 88 76 13,862 5,829 8,033 73 35 173,763 83,935 89,828 93 77 11,892 4,807 7,085 68 36 136,999 64,180 72,819 88 78 12,254 4,952 7,302 68 37 135,658 63,629 72,029 88 79 7,196 2,912 4,284 68 38 142,408 65,675 76,733 86 80 10,051 3,910 6,141 64 39 107,040 47,912 59,128 81 81 5,680 2,396 3,284 73 40 127,987 51,572 76,415 67 82 5,739 2,254 3,485 65 83 4,937 1,937 3,000 65 84 4,245 1,662 2,583 64 85 + 18,107 6,924 11,183 62 Population Sex Ratio Population Age in Single Years Sex Ratio (cont'd) Age in Single Years