Disaster Analysis using User-Generated Weather Report
Yasunobu Asakura
Tokyo Metropolitan University
[email protected]Masatsugu Hangyo
Weathernews Inc.
Mamoru Komachi
Tokyo Metropolitan University
Abstract
Information extraction from user-generated text has gained much attention with the growth of the Web. Disaster analysis using information from social media provides valuable, real-time, geolocated informa-tion for helping people caught up these in disasters. However, it is challenging to analyze texts posted on social media because disaster keywords match any texts that contain words. For collecting posts about a disaster from social media, we need to develop a classifier to filter posts irrelevant to disasters. Moreover, because of the nature of social media, we can take advantage of posts that come with GPS information. However, a post does not always refer to an event occurring at the place where it has been posted.
Therefore, we propose a new task of classifying whether a flood disaster occurred, in addition to predicting the geolocation of events from user-generated text. We report the annotation of the flood disaster corpus and develop a classifier to demonstrate the use of this corpus for disaster analysis.
1
Introduction
With the recent spread of the Web, disaster information is now being posted to the social media in real time. In the case of the 2011 Great East Japan Earthquake, Twitter was used to share information regarding damage states, tsunami warnings, and safety confirmations. As increasing amounts of information have been produced by users, information extraction from social media has attracted attention in the field of natural language processing. Flood disaster analysis using information from social media is heavily awaited because precise information such as time and location of a flood is crucial for supporting (potential) victims of the disaster. However, information extraction from social media faces several problems. Here, we address two important problems.
First, collecting posts including keywords about a disaster is not sufficient to judge whether the disaster actually occurred. The following posts concerning disasters illustrate this problem.
(1) The street in front of my house is flooded.
(2) There are several flood disasters around here.
(3) Last year’s flood was terrible.
(4) Please be aware of flood hazards.
We desire to extract posts such as post (1) refer to a disaster but there are posts that do not refer to any specific disaster, (2) refer to a generic event rather than a specific event, (3) refer to a past accident instead of a current situation, and (4) does not refer to any disaster but alerts a reader regarding the possibility of future catastrophe.
Second, another important problem in disaster analysis is temporal and/or geographical uncertainty. Although 0.77% posts on Twitter1contain GPS information (Hecht et al., 2011), not all posts include exact geolocation. In addition, a post that contains GPS information need not refer to the location of a disaster event described in the post. The following post concerning a disaster illustrates this problem.
(5) I heard that it was flooded in Okinawa.
In the case of (5), the disaster occurs not in the place that GPS information indicates but in Okinawa prefecture. Therefore, we propose new tasks (1) that classify whether a disaster occurred and (2) that predict the geolocation of events from social media. The task of geolocation prediction from Twitter has also been recently addressed (Han
This work is licenced under a Creative Commons Attribution 4.0 International Licence. Licence details: http:// creativecommons.org/licenses/by/4.0/
1https://twitter.com/
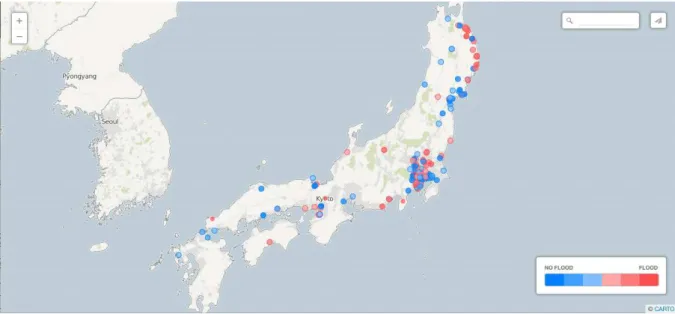
Figure 1: Visualization system of flood disaster for the Typhoon Lionrock crossed northern Japan on August 29, 2016. It caused heavy flood in Iwate prefecture, and its damage is clearly found in this visualization (red circles in the upper right coastline). The flood did not cause severe damage in other parts of northern Japan (shown in blue circles).
et al., 2014). However, in the present study, we attempt to predict the location of an event that a post refers to rather than the location of the post.
Figure 1 is a demonstration of our visualization system2 of flood disaster. This visualization system uses the
disaster classifier we built in this study. We aim to make a visualization system that can capture the exact location of the disaster in real time.
The main contributions of this study are as follows:
• We proposed a new task of flood disaster analysis and created a flood event dataset.
• We developed a supervised classifier to classify whether a disaster occurs to predict time when a disaster
occurs and to predict distance between a reporter and disaster.
2
Related Work
With the development of the information society, studies of disaster information analysis from social media have attracted attention in the NLP literature.
In the case of the Great East Japan Earthquake, Neubig et al. (2011) constructed an information extraction system that visualized the security of the people in the disaster-stricken area using Twitter. They made a corpus by annotating safety information to tweets and trained a classifier to categorize the security of the population. We also perform disaster information analysis; however, we focus on event classification rather than classification of personal information. In addition, Varga et al. (2013) extracted distress and support information concerning disaster from tweets. Their distress recognizer used geographical information as a feature; however, they did not estimate the location of the disaster event. Our work differs in that we try to estimate how far the disaster event is from the person posting in terms of time and location.
Similar to our study, Sakaki et al. (2010) constructed a reporting system that classifies whether an earthquake or typhoon occurs when the text was posted. They predicted the location of disaster events using GPS data from the tweets; however, they did not address the problem of tempo-spatial distance between the person posting and the event. They were not able to tackle this problem because there were very few tweets posted with GPS data (Hecht et al., 2011). In this study, we created a flood event corpus from a blog in which almost all users posted their reports with the geolocation. Moreover, we separated the task of location prediction of posts and location prediction of events.
Regarding information extraction concerning a flood, Herfort et al. (2014) used specific geographical features like hydrological data and digital elevation models to prioritize crisis-relevant Twitter messages. In this study,
label value description
disaster positive From the post, we can judge that a flood disaster is occurring when the text is posted. negative From the post, we can judge that a flood disaster is not occurring when the text is
posted.
high probability From the post, we can judge that a reporter alerts a future flood in advance. future low probability From the post, we can judge that a reporter is anxious about a future flood.
unmentioned From the post, we can judge that a reporter does not mention about a future flood. occurring From the post, we can judge that the flood is occurring.
time present probably occurring From the post, we can presume that the flood is occurring. not occurring From the post, we can judge that a flood is not occurring. occurred From the post, we can judge that a flood occurred recently. past occurred long before From the post, we can judge that a flood occurred long before.
unmentioned From the post, we can judge that a reporter does not mention a post flood in the past. close We can judge from the post that a reporter reports flood in front of him/her.
distance far We can judge from the post that a reporter reports flood but he/she is not at the place where he/she experienced flood.
misc Except close and far.
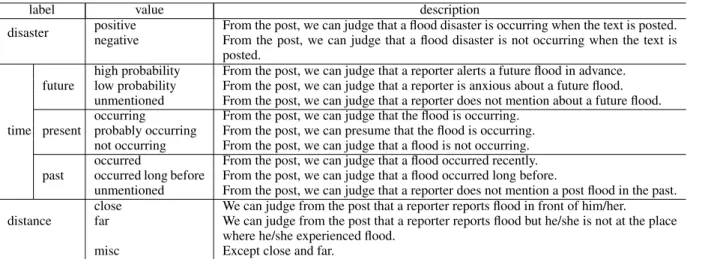
Table 1: Labels for the flood disaster events.
we focus on the prediction of an event using linguistic features to discuss potential issues in text-based event classification. Vieweg et al. (2010) analyzed tweets generated during a flood event. They found that 6% of the tweets contained location information. In this study, we focus on annotating the locational relation of a reporter and disaster. Bruns et al. (2012) compiled a dataset of tweets that relates to the crisis event by using hashtags. We made a flood disaster dataset by collecting report containing keywords related to floods because the social media used in this paper does not support hashtags. However, almost all of our data already has the exact GPS information.
3
Annotation of Flood Event
3.1 Data
We collected 567 posts including Japanese keywords for a flood event such as “inundation” and “flood” from a weather report sharing site known as “weathernews3.” Approximately, 500,000 reports on weather are posted on this site every month by users, and these reports contain posting time and GPS information. Each reports comprises picture and text about weather, and some exclusive label of weather (e.g., onomatopoeia such asポツポツ,ザー
ザーetc.) and temperature (e.g., hot or cold) by users’ subjective judgment. In this study, we used only the text of weather reports.
We used posts of 17 days that included July, which is during the typhoon season, and February, which is the snowy season in Japan, and 4 days during the 2011 Great East Japan Earthquake. The average number of sentences in one post is 5, while the average number of phrases and words in one sentence are 5 and 17, respectively.
We labeled the posts according to whether a disaster occurred when the text was posted. We call this binary labeldisaster label. In addition, we annotated the time and distance of the disaster event from the post because flood disaster analysis should predict the time and place where a disaster occurred or is still occurring from a post. We call these labelstime labelanddisaster label. In disaster labels, we annotated only one label for each post including at least one keyword. If there were more than one disaster event, we annotated the event that was closer to the keyword. In time and distance labels, we annotated each keyword in a post.
3.2 Labels
Table 1 summarizes the labels of this task. With regard to the time label, it is necessary to recognize not only whether a flood occurs but also whether a disaster persists. Therefore we divided the time label into following labels: future, present, and past instead of using generic time specification such as TimeML (Pustejovsky et al., 2003). Unlike TimeML, we assigned the time label to only the disaster keyword based on a relationship between the posting time and time of the reported disaster by considering the tense expression in the report. In addition, we assigned values of all three tenses (future, present, past) to the disaster keyword because we supposed to construct applications that estimate the ordering of flood disaster at the posting time, future and past. We prepared three values for each time label. We will describe details of the labels below.
Disaster label. We preparedpositiveandnegativeto estimate the presence of flood disaster at the time of posting.
Future label. We preparedhigh probability,low probabilityandunmentionedbecause there are three patterns of reports that mentioned alerts, anxiety, and nothing about a flood event. We labeled the report such as an alert future catastrophe like “It seems to be flood!,” tohigh probabilityand labeled the report that mentioned only an anxiety about the occurrence of a flood, e.g., “I am anxious about a disaster,” tolow probability.
Present label. We preparedoccurring,probably occurringandnot occurring. The value of probably occurring is created to reflect the temporal uncertainty of a flood. There is ambiguity in terms of tense in the representation such as “浸水していました(had flooded),” which refers to a disaster that occurred or is occurring. For such a representation, we labeled the posts as “probably occurring.” We did not prepareunmentionedbecause we label the post asnot occurringif a disaster is not mentioned in the case of present.
Past label. We preparedoccurred,occurred long beforeandunmentioned. The value of occurred long before is necessary to distinguish a report that refers to a recent accident and an accident that occurred long time before.
Distance label. We just annotated whether a reporter is in front of the place (close) or has already left the place (far) because we use the flood event corpus constructed from a social media where almost all users post their reports with location information. We assigned amisclabel in case where it is difficult to estimate the distance only from the post. For example, we labeled the report that did not mention about disaster that reporter experienced but disaster that reporter heard in the news tomisc.
Examples of annotated posts are as follows.
(6) Tokyo Station was flooded, but this street is safe.
[disaster]: positive
[time]: future = unmentioned, present = probably occurring, past = occurred
[distance]: far
(7) My balcony is flooded.
[disaster]: negative
[time]: future = unmentioned, present = occurring, past = unmentioned
[distance]: close
(8) Although there are several past flood hazards around here, at present, there has not been any such hazard.
[disaster]: negative
[time]: future = unmentioned, present = not occurring, past = occurred long before
[distance]: misc
In the case of (6), a flood has not occurred near the reporter; however, the flood likely occurred somewhere nearby. In the case of (7), a flood occurs in the balcony of the poster; however, it is not considered to be a disaster. In the case of (8), a flood does not occur when the text is posted.
3.3 Analysis
The annotation was conducted using two annotators. Theκcoefficient is 0.870 for the disaster label, 0.796 for the
future label, 0.691 for the present label, 0.672 for the past label and 0.637 for the distance label.
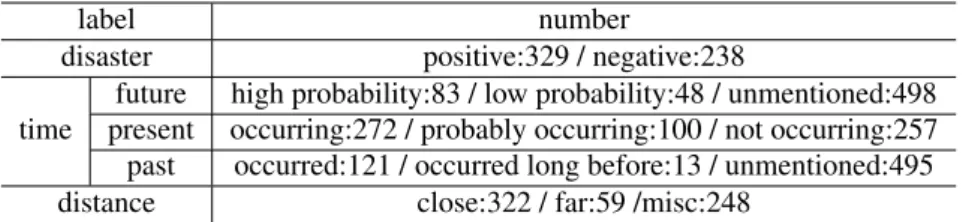
Table 2 shows the number of labels. There are some labels in which the number is small likeoccurred long before. However, for disaster reports, it is necessary to distinguish between a past report that mentions an ancient disaster and an up-to-date report that mentions a recent disaster. Moreover, we would like to distinguish between reports that alert future catastrophe and reports that mention only anxiety to help evacuation. Therefore, we define and annotate those labels although their numbers are small. If we focus on developing a practical system, infrequent labels can be merged to alleviate data sparseness. In addition, these fine labels can be used not only in this task that estimates the presence of flood disaster at the time of posting but also in other tasks (e.g., the task of predicting that a disaster occurs in the future).
4
Classification of Flood Event
label number
disaster positive:329 / negative:238
future high probability:83 / low probability:48 / unmentioned:498 time present occurring:272 / probably occurring:100 / not occurring:257 past occurred:121 / occurred long before:13 / unmentioned:495 distance close:322 / far:59 /misc:248
Table 2: Number of labels.
example 今日は大雨が降るので 浸水 する予定。(Today there is going to be flooding because of heavy rain.)
BoN Bag ofn-grams of word from the sentences including the keywords of flooding. (n= 1, 2, 3, 4) We use either the entire sentence or a window around the keywords (window size = 5). example:今日[uni]は[uni]大雨 [uni]が [uni]降る [uni]ので[uni]浸水 [uni]する [uni]
予定[uni]。 [uni](n= 1)
Dep Bag ofn-grams of words from the chunks of words including a keyword and chunks that depend on or are dependent on chunks that include a keyword.
example:大雨 [dep]が [dep]降る[dep]ので [dep]浸水[dep]する[dep]予定 [dep]。 [dep]大雨 が[dep]が 降る[dep]降る ので[dep]ので 浸水[dep]浸水 する[dep]す
る 予定[dep]予定 。[dep](n=1,2)
Table 3: Features used for the experiments.
First, we built a supervised classifier to estimate the presence of a flood disaster at the time of posting using disaster labels of disaster corpus (single model). We used the BoN (bag-of-ngram) and Dep (dependency) features extracted from the sentence including in the keywords.
Second, we built a time analyzer that predicts the occurrence time of a disaster using time labels of disaster corpus and a distance analyzer that predicts the positional relationship between a reporter and the disaster that has occurred using distance labels from the disaster corpus. In the time analyzer and distance analyzer, we used the BoN around keywords and the Dep features.
Finally, we proposed an improved disaster analysis model based on time analysis. In time analysis, the present labels are almost equivalent to the disaster label. A big difference between the present label and the disaster labels is that the present labels are labeled for each disaster keyword whereas the disaster labels are labeled for each report. Therefore, we compared two classifiers. Baseline classifier is a single model. The other classifier aggregates time labels for all the keywords in the report to judge whether a disaster occurred or not (aggregate model). In order to identify a disaster label from present labels, we considered that the disaster label of a report is positive if at least oneoccurringlabel or oneprobably occurringlabel is included in the report.
5
Experiment
5.1 Setting
In this task, we used MeCab4(ver.0.996) with IPADic (ver.2.7.0) for word segmentation and CaboCha5(ver.0.68) for dependency parsing.
We conducted a 5-fold cross-validation and evaluated the performance of the analysis by its accuracy, precision, recall and F1 score.
In this study, we used linear and polynomial kernels for the SVM as the linear and non-linear classifiers in the disaster label classification and linear kernel SVM in the time and distance label classification, respectively. We used libSVM (ver.1.04) to train the model. We tuned the cost parameter C and coefficient of the kernel function during preliminary experiments. We set the degree of the polynomial kernel to 3. When comparing the single model and the aggregate model, both models are trained on linear kernel SVM, while the single model uses the Dep feature and the aggregated model uses the BoN feature.
5.2 Result
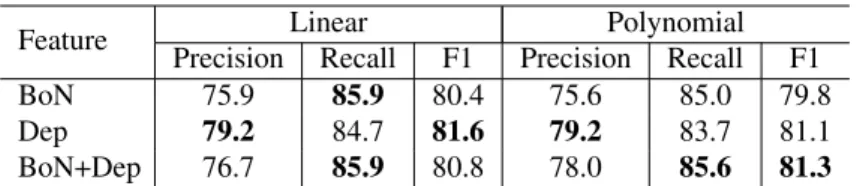
Table 4 shows the results of the flood disaster classification using the linear and polynomial kernel SVMs. In this experiment, there are no notable differences between the linear and polynomial kernel SVMs. Therefore, I will discuss only the result of linear SVM in the next section.
Feature Linear Polynomial Precision Recall F1 Precision Recall F1 BoN 75.9 85.9 80.4 75.6 85.0 79.8 Dep 79.2 84.7 81.6 79.2 83.7 81.1 BoN+Dep 76.7 85.9 80.8 78.0 85.6 81.3
Table 4: Accuracy of the disaster label classification of SVMs.
Feature Accuracy
Past Present Future Distance BoN 85.9 74.7 85.1 71.4
Dep 87.9 73.3 84.6 70.0 BoN+Dep 86.0 73.8 85.7 70.0
Table 5: Accuracy of time and distance label classification.
label value Precision Recall F1 high probability 71.4 42.2 53.0 future low probability 80.0 16.7 27.6 unmentioned 86.5 98.8 92.2 occurring 75.0 82.7 78.7 present probably occurring 66.1 41.0 50.6 not occurring 76.4 79.4 77.9 occurred 78.7 48.8 60.2 past occurred long before 100.0 13.3 23.5 unmentioned 86.8 97.2 91.7 close 70.7 83.2 76.4
distance far 77.8 11.9 20.6
misc 72.2 70.2 71.2
Table 6: Precision, Recall and F1-score of time and distance label classification.
classifier Precision Recall F1 aggregated model 84.3 88.4 86.4
single model 79.2 84.7 81.6
Table 7: Accuracy of disaster label classification.
Table 5 shows the accuracy of the time and distance label classification and Table 6 shows the precision, recall and F1-score of time and distance label classification using linear kernel SVM with the BoN feature.
Table 7 shows the result of model comparison of the classifier using the document level disaster label (single model) and the classifier using the keyword level time labels (aggregated model). Aggregated model achieved better performance over single model in all the evaluation measures.
6
Discussion
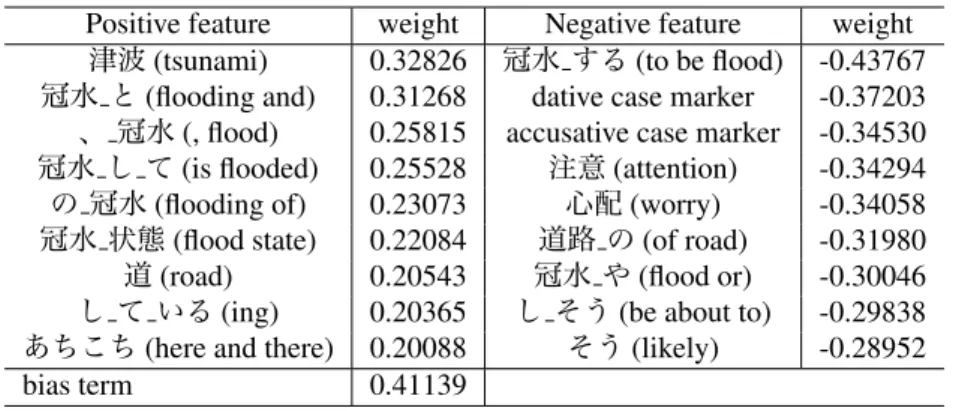
Positive feature weight Negative feature weight
津波(tsunami) 0.32826 冠水 する(to be flood) -0.43767
冠水 と(flooding and) 0.31268 dative case marker -0.37203
、 冠水(, flood) 0.25815 accusative case marker -0.34530
冠水 し て(is flooded) 0.25528 注意(attention) -0.34294
の 冠水(flooding of) 0.23073 心配(worry) -0.34058
冠水 状態(flood state) 0.22084 道路 の(of road) -0.31980
道(road) 0.20543 冠水 や(flood or) -0.30046
し て いる(ing) 0.20365 し そう(be about to) -0.29838
あちこち(here and there) 0.20088 そう(likely) -0.28952 bias term 0.41139
Table 8: Feature and weight of the linear classifier using Dep features.
Error example 1 浸水しているそうなので注意です。 False negative (Please be attention because it seems to be flooded.)
Error example 2 昔ね。我が家も床下浸水した。 False positive (It is all history. My house was flooded.)
Table 9: Examples of classification errors.
Figure 2: The learning curve of the flood disaster classification.
the classifier cannot classify a post that requires the consideration of inter-sentential context. Features used in this study considered only the words in a sentence, including the flood keyword. We need to employ discourse-level information to appropriately classify these examples.
Figure 2 shows the learning curve for disaster label classification. The classifier converges after the amount of data exceeds 350. It was thought that most surface keywords in posts concerning flood disasters could be learned with a small amount of data because we used only two keywords that directly indicated a flood disaster. However, it will be necessary to learn generic words that do not necessarily refer to flood disasters to boost the recall in flood disaster analysis.
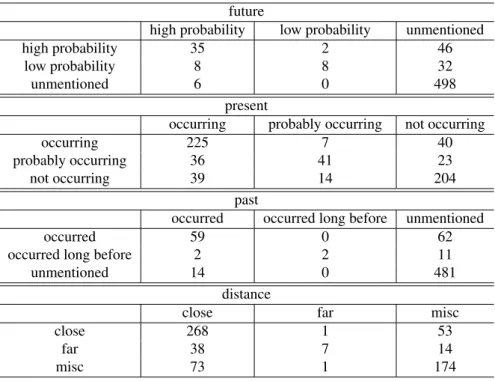
Regarding time and distance classification, Table 6 shows that recall oflow probability,occurred long before
future
high probability low probability unmentioned
high probability 35 2 46
low probability 8 8 32
unmentioned 6 0 498
present
occurring probably occurring not occurring
occurring 225 7 40
probably occurring 36 41 23
not occurring 39 14 204
past
occurred occurred long before unmentioned
occurred 59 0 62
occurred long before 2 2 11
unmentioned 14 0 481
distance
close far misc
close 268 1 53
far 38 7 14
misc 73 1 174
Table 10: The confusion matrice of time and distance label classification error. Row shows gold label and column shows predicted label.
that contribute to disaster analysis.
Table 7 shows that the classifier using the time label (aggregated model) has better precision, recall, and F1-score than the classifier using the disaster label (single model). It is inferred that fine-grained annotation for each disaster keyword is more effective than coarse-grained annotation for each report in the disaster classification, because there are reports that mention two events in one report such as “It is flooded in Tokyo, but this place is not flooded.” The single model did not perform well in complex tasks such as disaster analysis. Moreover, the aggregated model successfully decomposed a disaster analysis into simpler problems and achieved better performance. Modality analysis is shown to improve the accuracy of factuality analysis (Saur´ı and Pustejovsky, 2012), and can be applied to this task as well.
7
Conclusion
In this study, we collected posts concerning flood disasters from social media about weather and created a flood disaster corpus. We annotated whether a flood disaster occurred. Furthermore, we annotated the time of disaster and distance between the poster and disaster. In addition, we developed a classifier using linear and polynomial kernel SVMs. In the classification of disaster label, the experimental results show that the use of bag ofn-grams
from the subtree of a dependency parse is effective for classification of disaster label in terms of F1-score. In addi-tion, we proposed an aggregated model using predicted time labels for disaster label classification. Experimental result showed that the aggregated model is better than the single model. Moreover, it is suggested that modality analysis is necessary for enhancing the performance of a disaster analysis.
In this study, we focus on flood disaster, but this data label creation and the classification can be extended to other natural disasters if the keyword of the disaster is found and has a similar nature to the flood disaster, such as landslides and heavy snowfalls.
In the future, we plan to expand our flood disaster corpus by adding new keywords. It is not straightforward to find appropriate keywords that increase recall without losing too much precision. In addition, we would like to improve the visualization system of flood disaster information using user-generated text to assist relief efforts in future large-scale disasters.
Acknowledgments
References
Axel Bruns, Jean E Burgess, Kate Crawford, and Frances Shaw. 2012. #qldfloods and@qpsmedia: Crisis commu-nication on Twitter in the 2011 South East Queensland Floods. Technical report, ARC Centre of Excellence for Creative Industries and Innovation, QUT Z1-515,.
Bo Han, Paul Cook, and Timothy Baldwin. 2014. Text-based Twitter user geolocation prediction. Journal of Artificial Inteligence Research, 49(1):451–500.
Brent Hecht, Lichan Hong, Bongwon Suh, and Ed H. Chi. 2011. Tweets from Justin Bieber’s heart: The dynamics of the location field in user profiles. InProceedings of the SIGCHI conference on human factors in computing systems, pages 237–246.
Benjamin Herfort, Jo˜ao Porto de Albuquerque, Svend-Jonas Schelhorn, and Alexander Zipf. 2014. Exploring the geographical relations between social media and flood phenomena to improve situational awareness. In
Proceedings of the 17th AGILE Conference on Geographic Information Science, pages 55–71.
Graham Neubig, Yuichiroh Matsubayashi, Masato Hagiwara, and Koji Murakami. 2011. Safety information mining―What can NLP do in a disaster―. InProceedings of 5th International Joint Conference on Natural
Language Processing, pages 965–973.
James Pustejovsky, Jose M. Castano, Robert Ingria, Roser Sauri, Robert J. Gaizauskas, Andrea Setzer, Graham Katz, and Dragomir R. Radev. 2003. TimeML: Robust specification of event and temporal expressions in text. InNew Directions in Question Answering, pages 28–34.
Takeshi Sakaki, Makoto Okazaki, and Yutaka Matsuo. 2010. Earthquake shakes Twitter users: Real-time event detection by social sensors. InProceedings of the 19th International Conference on World Wide Web, WWW ’10, pages 851–860.
Roser Saur´ı and James Pustejovsky. 2012. Are you sure that this happened? Assessing the factuality degree of events in text.Computational Linguistics, 38(2):261–299.
Istv´an Varga, Motoki Sano, Kentaro Torisawa, Chikara Hashimoto, Kiyonori Ohtake, Takao Kawai, Jong-Hoon Oh, and Stijn De Saeger. 2013. Aid is out there: Looking for help from tweets during a large scale disaster. In
Proceedings of the 51st Annual Meeting of the Association for Computational Linguistics, pages 1619–1629.
Sarah Vieweg, Amanda L Hughes, Kate Starbird, and Leysia Palen. 2010. Microblogging during two natural hazards events: What Twitter may contribute to situational awareness. InProceedings of the SIGCHI conference