Volume 2012, Article ID 917678,11pages doi:10.1155/2012/917678
Research Article
Genomic Structure and Evolution of Multigene Families:
“Flowers” on the Human Genome
Hie Lim Kim,
1, 2Mineyo Iwase,
1Takeshi Igawa,
3Tasuku Nishioka,
1Satoko Kaneko,
4Yukako Katsura,
5Naoyuki Takahata,
6and Yoko Satta
51Center for the Promotion of Integrated Sciences, The Graduate University for Advanced Studies (SOKENDAI), Hayama, Kanagawa 240-0193, Japan
2Department of Biochemistry and Molecular Biology, Pennsylvania State University, 312 Wartik Laboratory, University Park, PA 16802, USA
3Institute for Amphibian Biology, Graduate School of Science, Hiroshima University, Higashihiroshima, Hiroshima 739-8526, Japan
4Laboratory of Plant Genetics, Graduate School of Agriculture, Kyoto University, Kyoto 606-8502, Japan
5Department of Evolutionary Studies of Biosystems, The Graduate University for Advanced Studies (SOKENDAI), Hayama, Kanagawa 240-0193, Japan
6The Graduate University for Advanced Studies (SOKENDAI), Hayama, Kanagawa 240-0193, Japan
Correspondence should be addressed to Yoko Satta,[email protected] Received 29 December 2011; Revised 6 April 2012; Accepted 9 April 2012 Academic Editor: Hirohisa Kishino
Copyright © 2012 Hie Lim Kim et al. This is an open access article distributed under the Creative Commons Attribution License, which permits unrestricted use, distribution, and reproduction in any medium, provided the original work is properly cited. We report the results of an extensive investigation of genomic structures in the human genome, with a particular focus on relatively large repeats (>50 kb) in adjacent chromosomal regions. We named such structures “Flowers” because the pattern observed on dot plots resembles a flower. We detected a total of 291 Flowers in the human genome. They were predominantly located in euchromatic regions. Flowers are gene-rich compared to the average gene density of the genome. Genes involved in systems receiving environmental information, such as immunity and detoxification, were overrepresented in Flowers. Within a Flower, the mean number of duplication units was approximately four. The maximum and minimum identities between homologs in a Flower showed different distributions; the maximum identity was often concentrated to 100% identity, while the minimum identity was evenly distributed in the range of 78% to 100%. Using a gene conversion detection test, we found frequent and/or recent gene conversion events within the tested Flowers. Interestingly, many of those converted regions contained protein-coding genes. Computer simulation studies suggest that one role of such frequent gene conversions is the elongation of the life span of gene families in a Flower by the resurrection of pseudogenes.
1. Introduction
A genomic structure is a region of repeats located on adjacent chromosomal regions and consists of combinations of tan- dem or/and inverted repeats and palindromes. Genomic structures are generated by genomic rearrangements such as duplications, deletions, and inversions in a genome. If the genes are located within a rearrangement such as a duplication or deletion, the number of genes would vary between individuals, and consequently, expression levels of those genes could also vary [1, 2]; this may thus affect phenotypic traits. Well-known inherited diseases, such as Prader-Willi and Williams-Beurens syndromes, are caused by
variation in the gene numbers and, in particular, by deletions in 15q11–q13 and 7q11.23, respectively [3]. On the other hand, inversions do not result in changes in the copy number of genes, but could affect recombination frequency between an intact and inverted segment (haplotype). Recombination is suppressed, and therefore, both haplotypes accumulate specific mutations. This accumulation enhances genetic dif- ferentiation between genomes within a species. If genes in the recombination-suppressed region are involved in mating or adaptation to environmental changes, the inversion might affect reproductive isolation or speciation [4].
Genomic structures can be detected by comparing nu- cleotide sequences within an individual genome. Such
structures are not distributed uniformly in a genome and sometimes are located on particular regions in a chromo- some. One well-known example is a cluster of palindromes on the Y chromosome [5]. There are eight palindromes of various sizes, and six of them carry protein-coding genes. The palindromes have been maintained via genetic exchanges between arms within a palindrome or between different palindromes [6]. These palindromes are important in keeping a large number of copies of male-specific Y chromosomal genes identical [7].
Duplication occurring in the genome is often called “seg- mental duplication,” which is distinct from whole genome duplication. There have been several studies involving screening of segmental duplications collectively for the entire human genome [8, 9]. Within human populations, copy number variations (CNVs) in segmental duplications or genomic structures have been found [8,9]. Massive struc- tural variations were reported [8, 9], but the biological significance of the frequent genomic rearrangements during evolution remains unclear. It is thus necessary to shed light on each region to understand the evolution of genomic rearrangements.
The aim of this study was to reveal how rearrangements in the genome or genomic structures have been maintained and to determine the biological significance of their reten- tion, from an evolutionary point of view. Large-scale dupli- cated sequences are amongst the most difficult sequences to assemble. For our study, the quality of assembly is most important. In this regard, the human genome sequence is the most reliable. Thus, we have studied the evolution of the genomic structures on the human genome.
2. Materials and Methods
2.1. Identification and Statistical Analyses of Flowers. Human genome sequence data (build 36; 2,858,142,293 bp) and corresponding gene information was obtained from NCBI (http://www.ncbi.nlm.nih.gov/). To detect genomic struc- tures (such as an inversions, tandem repeats, or dele- tions/insertions), dot-matrix and BLAST analyses using the software package GenomeMatcher [10] were applied to the genome sequence. GenomeMatcher was used to search for homologous sequences between two input sequences and to visualize the results as dot plots. To detect regions where at least two duplications are located in close proximity, we first divided genomic sequences into 1-Mb nonoverlapping regions. In each of these regions, we compared sequences by itself using BLAST with a command line “blastn-F T-W 40-e 0.01-D 1.”
The results of “BLAST hits” for each region are align- ments of pairs of the query and subject sequences. Our method focused on identifying genomic structures, which are duplication-concentrated regions generated by genomic rearrangements. A “Flower” is composed of an aligned se- quence of more than 1 kb, excluding the concentrated regions of repetitive elements, such as LINEs, SINEs, and micros- atellites. The size of a Flower, that is, the length of the region containing the alignments, was selected as longer than 50 kb. In the case of duplications located across neighboring
windows, we ran BLAST for extended windows in order to detect large-sized Flowers. If the location of two duplications was not within 1 Mb in length, our detection method could miss such regions, but they were not of interest to us.
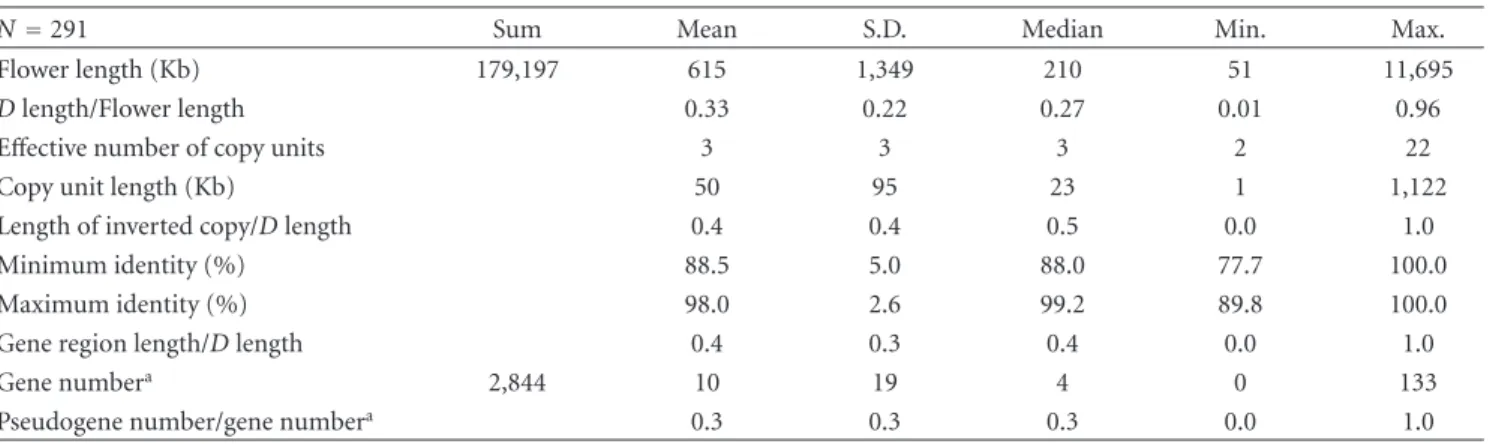
One example of a Flower is shown inFigure 1. Several measurements for each Flower were defined (Figure 1, Table 1). The start and end points of a Flower were deter- mined by BLAST analysis. In the example inFigure 1, Flower length was defined as the consecutive segment size from the start to the end point of a Flower. The D length for a Flower was defined as the sum of lengths of duplicated regions in a Flower. The effective number of copy units was calculated by the ratio of the total length of aligned sequences to the D length. Copy unit length was defined by the D length/the effective number of copy units. Length of inverted copy was defined as the total length of sequences matched to the query sequences in an opposite direction. The minimum and maximum identity were defined as the minimum and maximum values among identities of all alignments in a single Flower, respectively. The gene region length over D length stands for the proportion of gene regions in a repeated region, defined as the gene number in a Flower. When the number is more than 0.1, the gene was determined to be a
“Flower gene”.
2.2. Association of Flowers with Genes. To examine the re- lationship between Flowers and the genes in them, we compared gene density (measured by the number of genes per 1 Mb) in the duplicated regions of Flowers with the density of genes in randomly selected regions of the genome. Among 291 Flowers, there were 277 Flowers whose D lengths were unique. We sampled 277 regions of same sizes from the human genome, with the exception of Flower regions and sequencing gaps. Based on the annotation data of NCBI build 36, the number of genes in non-Flower and nongap regions was counted. Thousands of sampling repeats were performed to obtain the distribution of the gene number in such regions.
To investigate the known or reported functions of Flower genes, we extracted the Gene Ontology (GO) ID and obtained information on the GO categories from data of human genes at NCBI (http://www.ncbi.nlm.nih.gov/) and the GO database (http://www.geneontology.org/; The Gene Ontology Consortium).
2.3. Gene Conversion Detection Test. To detect gene con- version events within Flowers, we used the CHAP package [12]. To run the package, at least one orthologous sequence for each Flower must be determined as an outgroup. We performed BLAST with queries of Flower sequences and subjects of chimpanzee or gorilla genome assemblies. The identification of orthologs was difficult for large-sized Flowers or Flowers on sex chromosomes because of the quality of those assemblies. For accurate detection of gene conversion, we analyzed only Flowers for which orthologs were clearly determined. Finally, we succeeded in obtaining 189 Flowers with their orthologous sequences. We counted only conversion events occurring between human paralo- gous sequences after split with chimpanzees or gorilla.
Total copy length
=sum of alignment length
70 75 80 85 90 95 100
Flower length
Duplicated region length
Identity(%)
(D length)
Figure1: Example of a Flower. A dot plot shows an example of a Flower located on chromosome 10. Diagonal lines in the plot indicate the positions of blast hits, and the colors of the lines represent the identity of alignments as shown in the right-hand side of the plot. A blue bar indicates a detected copy unit, and the sum of alignments of blast hits equals the sum of the copy length. A pink bar indicates a Flower region, and the length of the bar represents the length of the Flower. A purple bar indicates a region called the duplicated region that contains the copy.
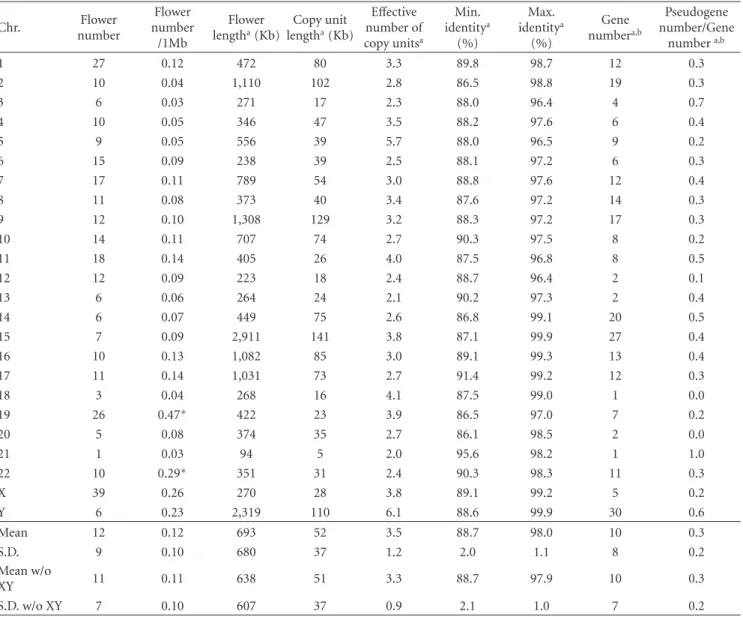
Table1: Statistical data for 291 Flowers. Definitions of each term are described inSection 2.
N=291 Sum Mean S.D. Median Min. Max.
Flower length (Kb) 179,197 615 1,349 210 51 11,695
D length/Flower length 0.33 0.22 0.27 0.01 0.96
Effective number of copy units 3 3 3 2 22
Copy unit length (Kb) 50 95 23 1 1,122
Length of inverted copy/D length 0.4 0.4 0.5 0.0 1.0
Minimum identity (%) 88.5 5.0 88.0 77.7 100.0
Maximum identity (%) 98.0 2.6 99.2 89.8 100.0
Gene region length/D length 0.4 0.3 0.4 0.0 1.0
Gene numbera 2,844 10 19 4 0 133
Pseudogene number/gene numbera 0.3 0.3 0.3 0.0 1.0
aThe number of Flower genes.
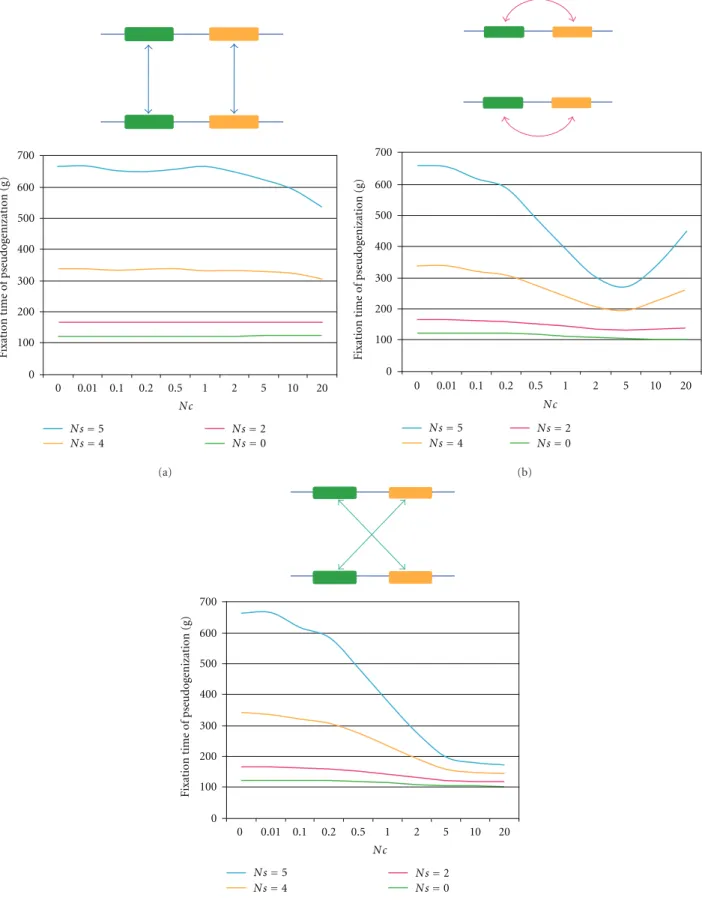
2.4. Simulation Analyses. Our simulation model assumed two loci in a diploid population with an effective size of N =50. Although N =50 could be considered as being too small given the size of the human population (N = 104), under neutrality, the simulation can be scaled while keeping the population parameters Nµ and Nc constant.
We set generation 1 as the time when a duplicated iden- tical gene is fixed in a population. Mutations occurred at a rate of Nµ = 0.5 per locus per generation, and each mutation caused pseudogenization. A backward mutation was not allowed and infinite sites model for mutations was used. Gene conversion occurred from one gene to another at a rate of Nc = 0–20 per gene per generation. Since we assume two loci with four genes in a diploid individual, the conversion can occur in any of three different schemes: allelic trans, allelic cis, and nonallelic trans (Figure 4). The number
of pseudogenes (nψ) in a diploid individual ranges from 0 to 4. When nψ was 0 to 3, no natural selection against an individual having the pseudogene(s) was considered (Ns = 0, where s is a selection coefficient), whereas when nψ in
an individual becomes 4, there is negative selection against the individual with Ns = 2–5. In one generation, simulations were performed according to the following order: mutation in a gamete → gene conversion between gametes in an individual → random sampling of gametes → selection against a progeny (zygote). A simulation counted the number of generations from generation 1 until all genes at both loci in a population became pseudogenes (fixation of pseudogenes). We carried out 10,000 repeats of this simulation and calculated the mean and standard error of this fixation time of 10,000 replications for each set of parameters (i.e., Nc and Ns).
1 2 3 4 5 6
7 10 11 12
13 14 15 16 17 18
19 20 21 22
9 8
Large flower No data Small flower
20 genes/50 kb
X Y
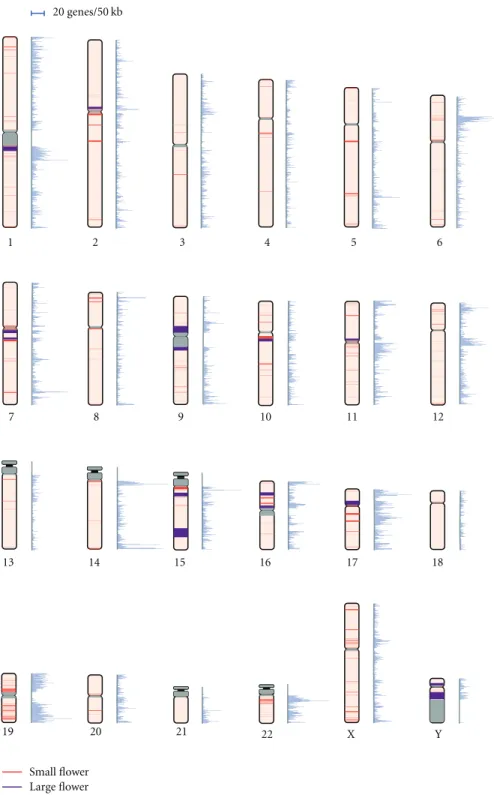
Figure2: Distribution of Flowers and gene density on chromosomes. A bar on a chromosome denotes the position of a Flower and the width of the bar represents the Flower length. The color of the bar represents the patterns of Flowers: small (red) and large (purple) Flowers. Gray bars stand for no genomic sequence data. Mapping of the bars was accomplished using ColoredChromosomes [11]. Gene density is represented alongside each chromosome. The scale for the gene density is placed at the top of the figure.
3. Results
3.1. 291 Flowers. We scanned the entire human genome and, based on our definitions, detected 291 Flowers (Figure 2). The Flowers were composed of at least two duplications
with some degree of similarity and were more than 50 kb in length (seeSection 2). Summary statistics for the 291 Flowers are shown in Table 1 (detailed information is presented in Table S1 in Supplementary Material available online at doi:10.1155/2012/917678).
The sum of the 291 Flower lengths was approximately 179 Mb, which comprised 6% of the genome. The mean length of a Flower was 615 kb and the median length was 210 kb (Table 1). The mean number of copy units in a Flower was approximately three and the mean length of a copy unit was 50 kb. Most Flowers (87%) were shorter than 1 Mb, and only 5% of Flowers exceeded 3 Mb (Figure S1). We categorized Flowers into two groups to distinguish exceptionally large Flowers and then fixed the 5% cutoff point (at 3 Mb) in the Flower length distribution (large Flowers (≥3 Mb, 15 Flowers) and small Flowers (<3 Mb, 276 Flowers). Compared with small Flowers, large Flowers were composed of more complicated structures. The mean number of copy units was 7.3, more than twice that of small Flowers (3.1). Interestingly, 10 of the 15 large Flowers were located in pericentromeric regions or near heterochromatin regions (Figure 2). This finding is consistent with the previous observation of numerous segmental duplications in pericentromeric regions [8].
The largest Flower (11.7 Mb), however, was located on a euchromatic region on chromosome 15. The structure of the Flower was extremely complicated, with many duplication units, as represented in Figure S2. A part of this region is likely responsible for a recurrent microdeletion syndrome [13]. Four unrelated patients with this syndrome shared breakpoints for de novo 1.7 to 3.9 Mb deletions in the region. The deletions could be the result of recurrent nonallelic homologous recombination between highly similar dupli- cates. Additionally, a polymorphic 1.2-Mb inversion has also been mapped to the same region [14]. Even though such dynamic rearrangements occur, this region contains 46 protein-coding genes.
Two classes of Flowers might be different types of genom- ic structures in mechanisms for generating or maintaining Flowers. Large Flowers were usually located in pericentrome- ric regions, and small Flowers were located in euchromatic regions. Since Large Flowers showed a more complicated structure than small Flowers, they have likely experienced more dynamic rearrangements compared to small Flowers.
3.2. Flower Distribution and Gene Density. Flowers were dis- tributed nonuniformly over the human genome (Figure 2 andTable 2). The pattern of distribution was different not only in the location on a chromosome, but also between the 24 chromosomes. The arithmetic mean of Flower density (i.e., the number of Flowers per 1 Mb) for a chromosome was 0.12±0.10 (Table 2). Most chromosomes showed a relatively similar density to one another (Table 2), with the exception of chromosome 19. The gene density of chromosome 19 (0.47) was the largest, and about 20% of the length of the chromosome was occupied by 26 Flowers.
Previous studies suggested that genomic structures, such as segmental duplications or CNVs, are often observed in gene-rich regions [15–18]. A possible reason for the high Flower density in chromosome 19 might be related to the fact that the density of genes in the chromosome is high. In fact, the association between Flowers and their gene content was also observed. The gene density of each chromosome seemed
to be associated with the location of Flowers (Figure 2). To evaluate this association, we compared the gene density in 277 Flowers (D length < 1 Mb) with the gene density in randomly selected regions from the genome (Table 3). The mean gene density in a Flower was 0.61 per 10 kb, more than five times the value for the randomly selected regions (i.e., 0.12; P < 10−5, Z-test). Also, the density of protein- coding genes, 0.34, was 3.4 times larger than that of the randomly selected regions (0.09; P < 10−5, Z-test). The gene density of 14 large Flowers (D length > 1 Mb) was 0.35, larger than that of the randomly selected regions (data not shown). Therefore, we concluded that Flowers are generich relative to other regions of the genome.
3.3. Flower Genes. Among all Flowers, 82% included at least one gene. We found 2,844 genes in these Flowers, and these genes comprised 8% of the human genes annotated in NCBI build 36. Among these, there were 1,417 protein-coding genes (50%), 1,085 pseudogenes (38%), and 116 RNA genes (4%) (Table S2). The remaining 226 (8%) were “unknown” or “other” categories in the NCBI annotation. To examine the functions of the genes in Flowers, we classified the genes according to the GO categories. To detect biases in the functions of these genes compared to the entire set of human genes, we compared the observed gene number of Flowers in each given category with the expected number. The expected gene numbers were calculated based on the proportion of human genes in each category (Table S3).Table 4shows GO categories that were significantly overrepresented in Flowers (P < 10−4, hypergeometric test).
The most overrepresented category was the alpha- amylase multigene family (AMY), which is located on chro- mosome 1. The family consists of AMY1 and AMY2. Am- ylases catalyze the breakdown of starch and glycogen into disaccharides or trisaccharides, and the genes are highly expressed in the salivary gland and pancreas. AMY1 showed extensive CNVs that are known to be present among several ethnic populations. The copy number, however, did not depend on the geographic distribution of populations, but instead was associated with differences in diets. Populations with high-starch diets have a larger number of AMY1 gene copies than those with low-starch diets [19,20]. The number of AMY1 gene copies correlates with the amount of AMY1 proteins in saliva [20].
The second most frequent category inTable 4 was glu- curonosyltransferase activity, which includes the UDP glu- curonosyltransferase (UGT) multigene family. Members of the UGT gene family are divided into two subfamilies, UGT1 and UGT2. They are located on 2q37 and 4q13-13.2 and in one and two Flowers, respectively. UGTs encode enzymes that catabolize small lipophilic molecules, such as steroids, bilirubins, hormones, drugs, environmental toxicants, and carcinogens, into water-soluble glucuronides [21]. A mature UGT1 mRNA is composed of five exons. However, depending on the substrate, several distinct mRNAs are observed. Interestingly, this variety in mRNAs is caused by alternative splicing. The region for the UGT1 subfamily on chromosome 2 encodes 13 sets of exon 1 and a single set of exon 2 to exon 5. Splicing of each variable exon (exon 1) to the four constant
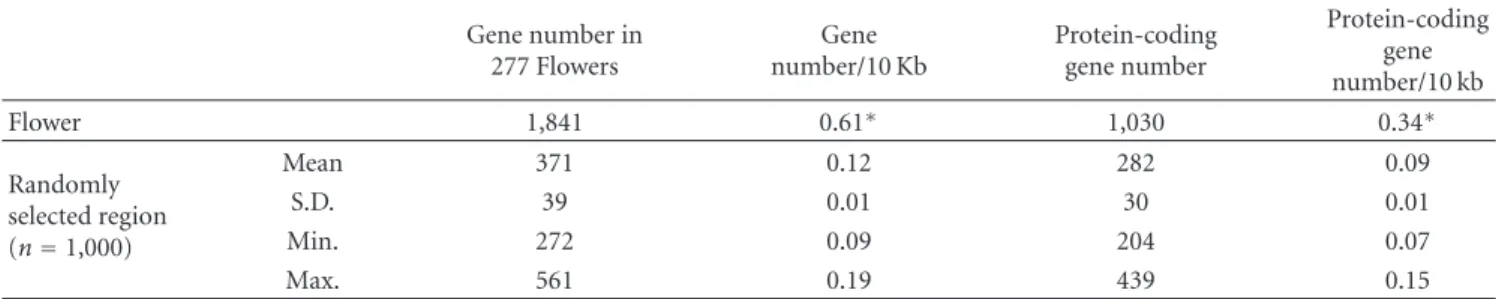
Table2: Statistics of Flowers in each chromosome.
Chr. Flower
number
Flower number
/1Mb
Flower lengtha(Kb)
Copy unit lengtha(Kb)
Effective number of copy unitsa
Min. identitya
(%)
Max. identitya
(%)
Gene numbera,b
Pseudogene number/Gene
numbera,b
1 27 0.12 472 80 3.3 89.8 98.7 12 0.3
2 10 0.04 1,110 102 2.8 86.5 98.8 19 0.3
3 6 0.03 271 17 2.3 88.0 96.4 4 0.7
4 10 0.05 346 47 3.5 88.2 97.6 6 0.4
5 9 0.05 556 39 5.7 88.0 96.5 9 0.2
6 15 0.09 238 39 2.5 88.1 97.2 6 0.3
7 17 0.11 789 54 3.0 88.8 97.6 12 0.4
8 11 0.08 373 40 3.4 87.6 97.2 14 0.3
9 12 0.10 1,308 129 3.2 88.3 97.2 17 0.3
10 14 0.11 707 74 2.7 90.3 97.5 8 0.2
11 18 0.14 405 26 4.0 87.5 96.8 8 0.5
12 12 0.09 223 18 2.4 88.7 96.4 2 0.1
13 6 0.06 264 24 2.1 90.2 97.3 2 0.4
14 6 0.07 449 75 2.6 86.8 99.1 20 0.5
15 7 0.09 2,911 141 3.8 87.1 99.9 27 0.4
16 10 0.13 1,082 85 3.0 89.1 99.3 13 0.4
17 11 0.14 1,031 73 2.7 91.4 99.2 12 0.3
18 3 0.04 268 16 4.1 87.5 99.0 1 0.0
19 26 0.47∗ 422 23 3.9 86.5 97.0 7 0.2
20 5 0.08 374 35 2.7 86.1 98.5 2 0.0
21 1 0.03 94 5 2.0 95.6 98.2 1 1.0
22 10 0.29∗ 351 31 2.4 90.3 98.3 11 0.3
X 39 0.26 270 28 3.8 89.1 99.2 5 0.2
Y 6 0.23 2,319 110 6.1 88.6 99.9 30 0.6
Mean 12 0.12 693 52 3.5 88.7 98.0 10 0.3
S.D. 9 0.10 680 37 1.2 2.0 1.1 8 0.2
Mean w/o
XY 11 0.11 638 51 3.3 88.7 97.9 10 0.3
S.D. w/o XY 7 0.10 607 37 0.9 2.1 1.0 7 0.2
aMean values of each chromosome,bFlower genes.
∗P < 0.05 by Z-test.
exons (exon 2 to 5) generates diverse functional UGT1 mRNA. Nine of the 13 first exons encode the specific N- terminal domains, conferring the substrate specificity of the enzyme [22], whereas the remaining four are pseudogenized. Similar to UGT1, the region for the protocadherin beta (PCDHB) gene family encodes 16 different proteins with variable N-termini. In contrast to UGT1, each PCDHB protein is encoded by a single exon, and in total, 16 independent exons exist in this region. PCDHB is also in an overrepresented GO category in Flowers (seeTable 4).
Except for AMY and PCDHB, most overrepresented GO categories in Table 4 are related to immune responses (multigene families of immunoglobulin, major histocompat- ibility complex (MHC), and defensin) and detoxifications (multigene families of UGT, glutathione S-transferase, and cytochrome P450). This is consistent with previous results for segmental duplications and CNVs showing that these
regions are rich in genes that can interact with their environment [23,24].
3.4. Gene Conversion within a Flower. We calculated the minimum and maximum identities between copies of a gene in a Flower to investigate the age of Flowers. We can estimate the time of occurring of the oldest and most recent duplications, from the minimum and maximum identities, respectively. For example, the lowest minimum identity was 77.7% (Table 1), suggesting that the duplication likely occurred prior to the placental mammal radiation. In the distributions of minimum and maximum identities, the minimum identity was evenly distributed from low to high identity (78%∼100%), whereas the maximum identity was concentrated at 100% identity (Figure S3). One hundred Flowers (34%) had exactly identical copies and 55 Flowers (19%) had almost identical copies (i.e., 99% to <100%).
Table3: Comparison of gene density of Flowers with randomly selected regions. Except Flowers with D length≥1 Mb, the number of Flower genes was compared to that of 1,000 randomly selected regions on the human genome.
Gene number in 277 Flowers
Gene number/10 Kb
Protein-coding gene number
Protein-coding gene number/10 kb
Flower 1,841 0.61∗ 1,030 0.34∗
Randomly selected region (n=1,000)
Mean 371 0.12 282 0.09
S.D. 39 0.01 30 0.01
Min. 272 0.09 204 0.07
Max. 561 0.19 439 0.15
∗P = 0, Z-test.
75 80 85 90 95 100
75 80 85 90 95 100
2∼20 0∼1
Maximumidentity(%)
Minimum identity (%)
>20
Figure3: Scatter plot of maximum and minimum identity. The X and Y axes show the maximum and minimum percent identity of blast hits in a Flower. A dot represents one Flower. The 291 Flowers were classified into three groups, based on the number of Flower genes: 0∼1, 2∼20, and more than 20, are colored purple, blue, and yellow, respectively. The two yellow dots outlined in red are two exceptional Flowers with low maximum identity.
When we considered all the BLAST hits in Flowers, the number of hits with≥99% identity was larger than that with
<99% identity (Figure S4).
Interestingly, the maximum identity did not depend upon the values of the minimum identities. Many old Flow- ers, which had rather low minimum identities, showed 100% maximum identity (Figure 3). In addition, we found that the maximum identity depended upon the number of genes included in a Flower. Flowers containing up to 20 genes showed variety in maximum identities, whereas Flowers containing more than 20 genes showed almost 100% maximum identity (Figure 3). This suggests that the number of gene copies is associated with the genetic distance between paralogs within a Flower.
This observation suggested one hypothesis to explain the association of gene copy numbers with the large number of highly similar copies in Flowers: gene conversions occurred between gene copies, generating identical sequences within a Flower. The conversion is likely to be enriched in the case of a large number of gene copies. To examine the possibility of gene conversions within a Flower, we per- formed a gene conversion detection test, using the CHAP package [12]. This method identifies the orthologous and paralogous sequences within input sequences and detects regions showing significantly higher identity between the paralogs rather than between the orthologs. This pipeline was developed to analyze gene cluster regions and was useful for the detection of gene conversions within Flowers. We applied this method and obtained results for 189 Flowers. There were some technical difficulties in producing results for all Flowers (seeSection 2).
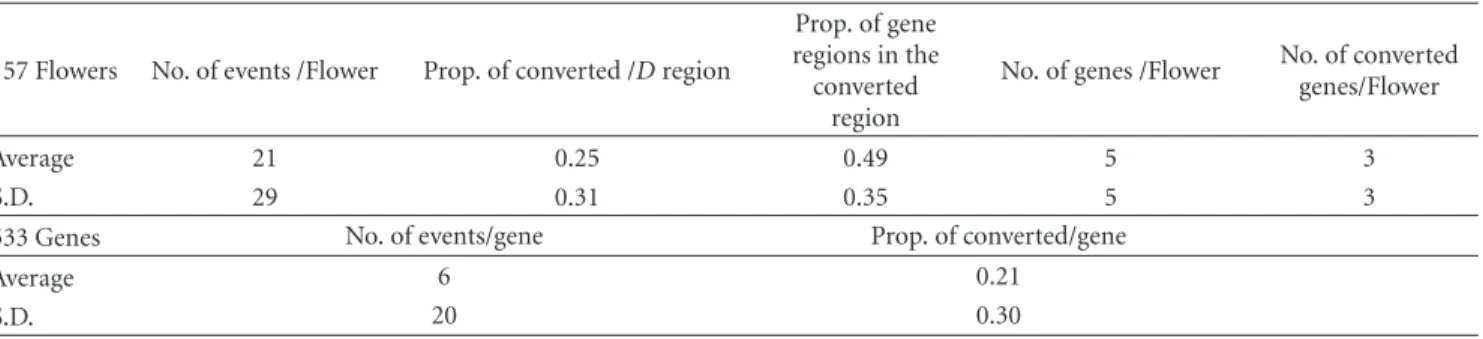
Among the 189 Flowers, gene conversion events that occurred in the human lineage were detected in 157 Flowers (83% of the tested Flowers). In the entire duplicated regions in the 157 Flowers, the average number of gene conversion events was 21, which corresponds to 20% of the duplicated regions (Table 5). Furthermore, in 798 genes of the 189 tested Flowers, 67% (533 genes) had experienced conversion. On average, 49% of the converted regions in a Flower had overlapped gene regions. In the 533 genes with conversions, the average number of conversions per gene was 6, and the proportion of converted region in the gene region was 21% (Table 5). These results indicate that gene conversions have been occurring frequently and recently within a Flower, especially in the gene regions, but also in the intergenic regions. Gene conversion events could play an important role in the evolution of Flower genes.
3.5. Simulations of Gene Conversions. To understand the effects of gene conversion on the evolution of Flower genes, we performed simulation studies (for details, see Section 2). The null hypothesis was that the fixation time of a pseudogene at a locus does not depend upon the rates of gene conversion. We measured the fixation time of a pseudogene in a population under neutrality or negative selection against fixation of pseudogenes in a diploid individual population. We assumed that gene conversion between alleles at two loci can take place in any of three different schemes: allelic- trans, allelic-cis, and nonallelic-trans (Figure 4). In all cases,
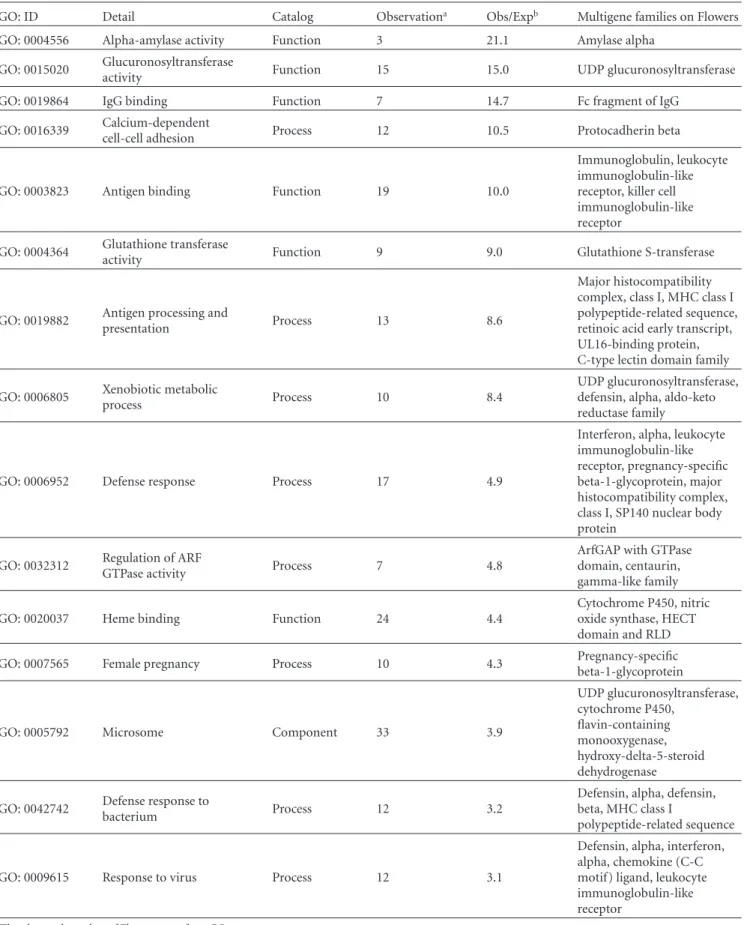
Table4: Functions of genes in Flowers. For a GO category, we tested significance of frequency of Flower genes compared to total number of the human genes. This table represents GO categories showing P < 10−4, the observed number of Flower genes≥3, and the ratio of observation to expectation≥3.
GO: ID Detail Catalog Observationa Obs/Expb Multigene families on Flowers
GO: 0004556 Alpha-amylase activity Function 3 21.1 Amylase alpha
GO: 0015020 Glucuronosyltransferase
activity Function 15 15.0 UDP glucuronosyltransferase
GO: 0019864 IgG binding Function 7 14.7 Fc fragment of IgG
GO: 0016339 Calcium-dependent
cell-cell adhesion Process 12 10.5 Protocadherin beta
GO: 0003823 Antigen binding Function 19 10.0
Immunoglobulin, leukocyte immunoglobulin-like receptor, killer cell immunoglobulin-like receptor
GO: 0004364 Glutathione transferase
activity Function 9 9.0 Glutathione S-transferase
GO: 0019882 Antigen processing and
presentation Process 13 8.6
Major histocompatibility complex, class I, MHC class I polypeptide-related sequence, retinoic acid early transcript, UL16-binding protein, C-type lectin domain family GO: 0006805 Xenobiotic metabolic
process Process 10 8.4
UDP glucuronosyltransferase, defensin, alpha, aldo-keto reductase family
GO: 0006952 Defense response Process 17 4.9
Interferon, alpha, leukocyte immunoglobulin-like receptor, pregnancy-specific beta-1-glycoprotein, major histocompatibility complex, class I, SP140 nuclear body protein
GO: 0032312 Regulation of ARF
GTPase activity Process 7 4.8
ArfGAP with GTPase domain, centaurin, gamma-like family
GO: 0020037 Heme binding Function 24 4.4
Cytochrome P450, nitric oxide synthase, HECT domain and RLD
GO: 0007565 Female pregnancy Process 10 4.3 Pregnancy-specific
beta-1-glycoprotein
GO: 0005792 Microsome Component 33 3.9
UDP glucuronosyltransferase, cytochrome P450,
flavin-containing monooxygenase, hydroxy-delta-5-steroid dehydrogenase GO: 0042742 Defense response to
bacterium Process 12 3.2
Defensin, alpha, defensin, beta, MHC class I
polypeptide-related sequence
GO: 0009615 Response to virus Process 12 3.1
Defensin, alpha, interferon, alpha, chemokine (C-C motif) ligand, leukocyte immunoglobulin-like receptor
aThe observed number of Flower genes for a GO category.
bThe ratio of the observed number of Flower genes to the expected number of genes.
0 100 200 300 400 500 600 700
0 0.01 0.1 0.2 0.5 1 2 5 10 20
Fixationtimeofpseudogenization(g)
N c N s=5
N s=4 N s=0
N s=2
(a)
0 100 200 300 400 500 600 700
0 0.01 0.1 0.2 0.5 1 2 5 10 20
Fixationtimeofpseudogenization(g)
N c N s=5
N s=4
N s=2 N s=0
(b)
0 100 200 300 400 500 600 700
0 0.01 0.1 0.2 0.5 1 2 5 10 20
N c N s=5
N s=4
N s=2 N s=0
Fixationtimeofpseudogenization(g)
(c)
Figure4: Fixation time of pseudogenes. We tested three types of gene conversion (double-headed arrows): (a) allelic-trans, (b) cis, and (c) nonallelic-trans gene conversion. The three graphs show that the pseudogene fixation time (in units of a generation) in a population (2N =100) depends on the gene conversion rate (Nc=0–20). The mutation rate is assumed to be constant (2Nµ=1) for the three cases shown here.
Table5: Statistics of detected gene conversion events within a Flower. The average and standard deviation of several values in the 157 Flowers and 533 genes, experiencing gene conversion events in the human lineage.
157 Flowers No. of events /Flower Prop. of converted /D region
Prop. of gene regions in the converted
region
No. of genes /Flower No. of converted genes/Flower
Average 21 0.25 0.49 5 3
S.D. 29 0.31 0.35 5 3
533 Genes No. of events/gene Prop. of converted/gene
Average 6 0.21
S.D. 20 0.30
under neutrality, the fixation time of a pseudogene did not appear to depend upon the rate of gene conversion (Ns=0, Figure4). Introduction of the purifying selection (Ns≥ 2) generally increased the fixation time with a constant Nc, and if Nc increases the fixation time gradually decreased. Nevertheless, in the case of cis gene conversion, when the conversion rate was lower than the mutation rate (Nµ=0.5 and Nc≤5), the fixation time decreased when Nc increased, but when Nc≥5, the fixation time increased. The life span of a multigene family in a Flower seems to be extended by gene conversion (in cis), probably because frequent gene conversion enhances homogenization of functional paralogs and thus counteracts pseudogenization. Frequent conversion also helps to convert pseudogenes to functional genes.
4. Discussion
In the human genome, we detected 291 regions with par- ticular genomic structures that we termed “Flowers.” Based on our characterization of the Flowers, we can draw two main conclusions. First, genes appear to be enriched in Flowers. Second, there is evidence of frequent gene conver- sion between duplicates within Flowers. These two findings may sometimes be contradictory, because gene conversion from a pseudogene has the potential to be deleterious for functional genes. Genomic rearrangements associated with several inherited diseases could be caused by this kind of gene conversion from paralogous pseudogenes [25]. In our observations, 30% of Flower genes were pseudogenes (Table 2and Table S1).
The results of this study, on the other hand, showed that frequent gene conversion could play an important role in the preservation of functionality of multigene families. InFigure 3, the 32 Flowers that had over 20 genes showed higher maximum identity than Flowers with fewer genes. Flowers containing a large copy number of genes have likely experienced more frequent gene conversions than other Flowers, and the gene copies had been homogenized. However, there were two exceptional Flowers (yellow dots outlined in red inFigure 3), which contained a large number of genes, but showed a maximum identity of less than 95%. These exceptions included immunoglobulin lambda variable (IGLV) and major histocompatibility complex class I (MHC) genes. These families need to maintain genetic diversity,
which is important for their functions. This result implies that the MHC and immunoglobulin gene families have evolved under purifying selection against homogenization between members of a multigene family [26].
A similar example of purifying selection was observed in melanoma antigen family A (MAGE-A) in a Flower on the X chromosome [27]. Members of this multigene family are expressed in cancer cells, encode epitopes recognized by MHC, and are associated with cancer immunity [28]. The genetic diversity between the MAGE-A3 and A6 genes has likely been preserved by purifying selection against homog- enization to maintain association with a particular MHC molecule.
In this study, we characterized several biologically signif- icant features of genomic structures, called Flowers, in the human genome. First, large-sized and complex Flowers were usually located in pericentromeric regions. In primates, the genomic structures of pericentromeric regions resulted from numerous segmental duplications of euchromatin regions [8,29]. Recent reports suggest that complex rearrangements played a role in the deterioration of functional genes during the generation of novel centromeres [30,31].
Second, we suggested an evolutionary mechanism for the preservation of multigene families within Flowers. Simula- tion studies showed that frequent gene conversion, probably at a higher rate than the mutation rate, could extend the age (lifespan) of a gene family. Negative selection against pseu- dogenization was a likely driving force in the maintenance of a multigene family.
Third, we provided evidence for the interrelationship of Flowers with the functions of multigene families. Multigene families related to immune responses and detoxification were overrepresented in the Flowers. These gene families have evolved under purifying selection opposing gene conversion to maintain the genetic variety between paralogous genes. Frequent genomic rearrangements in Flowers could drive the duplication of genes and increase the number of genes. This evolutionary mode was likely to be more favorable for multigene families related to immune responses and detoxi- fication, which need to adapt to environmental changes.
In conclusion, a Flower has an important role in the evo- lution of multigene families. Future studies will be extended to the genomes of other organisms to further understand the evolution of multigene families contained in genomic structures.
Acknowledgments
The authors thank Dr. Masafumi Nozawa for his critical comments on an early version of this paper. This work was supported in part by a Grant (no. 17018032) from the Min- istry of Education, Culture, Sports, Science and Technology (MEXT) of Japan.
References
[1] L. Huminiecki and K. H. Wolfe, “Divergence of spatial gene expression profiles following species-specific gene duplica- tions in human and mouse,” Genome Research A, vol. 14, no. 10, pp. 1870–1879, 2004.
[2] R. Blekhman, A. Oshlack, and Y. Gilad, “Segmental dupli- cations contribute to gene expression differences between humans and chimpanzees,” Genetics, vol. 182, no. 2, pp. 627– 630, 2009.
[3] H. C. Mefford and E. E. Eichler, “Duplication hotspots, rare genomic disorders, and common disease,” Current Opinion in Genetics and Development, vol. 19, no. 3, pp. 196–204, 2009. [4] F. J. Ayala and M. Coluzzi, “Chromosome speciation: humans,
Drosophila, and mosquitoes,” Proceedings of the National Academy of Sciences of the United States of America, vol. 102, no. 1, pp. 6535–6542, 2005.
[5] H. Skaletsky, T. Kuroda-Kawaguchi, P. J. Minx et al., “The male-specific region of the human Y chromosome is a mosaic of discrete sequence classes,” Nature, vol. 423, no. 6942, pp. 825–837, 2003.
[6] B. K. Bhowmick, Y. Satta, and N. Takahata, “The origin and evolution of human ampliconic gene families and ampliconic structure,” Genome Research, vol. 17, no. 4, pp. 441–450, 2007. [7] S. Rozen, H. Skaletsky, J. D. Marszalek et al., “Abundant gene conversion between arms of palindromes in human and ape Y chromosomes,” Nature, vol. 423, no. 6942, pp. 873–876, 2003. [8] X. She, J. E. Horvath, Z. Jiang et al., “The structure and evolution of centromeric transition regions within the human genome,” Nature, vol. 430, no. 7002, pp. 857–864, 2004. [9] E. V. Linardopoulou, E. M. Williams, Y. Fan, C. Friedman,
J. M. Young, and B. J. Trask, “Human subtelomeres are hot spots of interchromosomal recombination and segmental duplication,” Nature, vol. 437, no. 7055, pp. 94–100, 2005. [10] Y. Ohtsubo, W. Ikeda-Ohtsubo, Y. Nagata, and M. Tsuda,
“GenomeMatcher: a graphical user interface for DNA sequence comparison,” BMC Bioinformatics, vol. 9, article 376, 2008.
[11] S. B¨ohringer, R. G¨odde, D. B¨ohringer, T. Schulte, and J. T. Epplen, “A software package for drawing ideograms automati- cally,” Online Journal of Bioinformatics, vol. 1, pp. 51–61, 2002. [12] G. Song, C.-H. Hsu, C. Riemer et al., “Conversion events in gene clusters,” BMC Evolutionary Biology, vol. 11, article 226, 2011.
[13] A. J. Sharp, R. R. Selzer, J. A. Veltman et al., “Characterization of a recurrent 15q24 microdeletion syndrome,” Human Molec- ular Genetics, vol. 16, no. 5, pp. 567–572, 2007.
[14] F. Antonacci, J. M. Kidd, T. Marques-Bonet et al., “Charac- terization of six human disease-associated inversion polymor- phisms,” Human Molecular Genetics, vol. 18, no. 14, pp. 2555– 2566, 2009.
[15] L. Zhang, H. H. S. Lu, W. Y. Chung, J. Yang, and W. H. Li,
“Patterns of segmental duplication in the human genome,” Molecular Biology and Evolution, vol. 22, no. 1, pp. 135–141, 2005.
[16] X. She, G. Liu, M. Ventura et al., “A preliminary comparative analysis of primate segmental duplications shows elevated substitution rates and a great-ape expansion of intrachromo- somal duplications,” Genome Research, vol. 16, no. 5, pp. 576– 583, 2006.
[17] D. Q. Nguyen, C. Webber, J. Hehir-Kwa, R. Pfundt, J. Veltman, and C. P. Ponting, “Reduced purifying selection prevails over positive selection in human copy number variant evolution,” Genome Research, vol. 18, no. 11, pp. 1711–1723, 2008. [18] D. Q. Nguyen, C. Webber, and C. P. Ponting, “Bias of selection
on human copy-number variants,” Plos Genetics, vol. 2, no. 2, p. e20, 2006.
[19] P. C. Groot, W. H. Mager, and R. R. Frants, “Interpretation of polymorphic DNA patterns in the human α-amylase multigene family,” Genomics, vol. 10, no. 3, pp. 779–785, 1991. [20] G. H. Perry, N. J. Dominy, K. G. Claw et al., “Diet and the evolution of human amylase gene copy number variation,” Nature Genetics, vol. 39, no. 10, pp. 1256–1260, 2007. [21] R. H. Tukey and C. P. Strassburg, “Human UDP-glucurono-
syltransferases: metabolism, expression, and disease,” Annual Review of Pharmacology and Toxicology, vol. 40, pp. 581–616, 2000.
[22] Q.-H. Gong, J. W. Cho, T. Huang et al., “Thirteen UDPglu- curonosyltransferase genes are encoded at the human UGT1 gene complex locus,” Pharmacogenetics, vol. 11, no. 4, pp. 357– 368, 2001.
[23] J. A. Bailey, Z. Gu, R. A. Clark et al., “Recent segmental duplications in the human genome,” Science, vol. 297, no. 5583, pp. 1003–1007, 2002.
[24] G. M. Cooper, D. A. Nickerson, and E. E. Eichler, “Mutational and selective effects on copy-number variants in the human genome,” Nature Genetics, vol. 39, no. 1, pp. S22–S29, 2007. [25] J. M. Chen, D. N. Cooper, N. Chuzhanova, C. F´erec, and
G. P. Patrinos, “Gene conversion: mechanisms, evolution and human disease,” Nature Reviews Genetics, vol. 8, no. 10, pp. 762–775, 2007.
[26] M. Nei and A. P. Rooney, “Concerted and birth-and-death evolution of multigene families,” Annual Review of Genetics, vol. 39, pp. 121–152, 2005.
[27] Y. Katsura and Y. Satta, “Evolutionary history of the cancer immunity antigen MAGE gene family,” Plos ONE, vol. 6, no. 6, Article ID e20365, 2011.
[28] P. Van der Bruggen, C. Traversari, P. Chomez et al., “A gene encoding an antigen recognized by cytolytic T lymphocytes on a human melanoma,” Science, vol. 254, no. 5038, pp. 1643– 1647, 1991.
[29] J. E. Horvath, C. L. Gulden, R. U. Vallente et al., “Punctuated duplication seeding events during the evolution of human chromosome 2p11,” Genome Research, vol. 15, no. 7, pp. 914– 927, 2005.
[30] M. Ventura, F. Antonacci, M. F. Cardone et al., “Evolutionary formation of new centromeres in macaque,” Science, vol. 316, no. 5822, pp. 243–246, 2007.
[31] M. Lomiento, Z. Jiang, P. D’Addabbo, E. E. Eichler, and M. Rocchi, “Evolutionary-new centromeres preferentially emerge within gene deserts,” Genome Biology, vol. 9, no. 12, article R173, 2008.
Submit your manuscripts at
http://www.hindawi.com
Hindawi Publishing Corporation
http://www.hindawi.com Volume 2013
Hindawi Publishing Corporation
http://www.hindawi.com Volume 2013
The Scientiic
World Journal
Hindawi Publishing Corporation
http://www.hindawi.com Volume 2013
Archaea
Hindawi Publishing Corporation
http://www.hindawi.com Volume 2013
ISRN
Biotechnology
Hindawi Publishing Corporation
http://www.hindawi.com Volume 2013
Hindawi Publishing Corporation
http://www.hindawi.com Volume 2013
Evolutionary Biology
International Journal of
Hindawi Publishing Corporation
http://www.hindawi.com Volume 2013
Hindawi Publishing Corporation
http://www.hindawi.com Volume 2013
Advances in
Virology
ISRN Microbiology
Hindawi Publishing Corporation
http://www.hindawi.com Volume 2013
Marine Biology
Journal ofHindawi Publishing Corporation
http://www.hindawi.com Volume 2013
Hindawi Publishing Corporation
http://www.hindawi.com Volume 2013
ISRN Zoology
Hindawi Publishing Corporation
http://www.hindawi.com Volume 2013
Hindawi Publishing Corporation
http://www.hindawi.com Volume 2013
Signal Transduction
Journal of
ISRN Cell Biology
Hindawi Publishing Corporation
http://www.hindawi.com Volume 2013
Hindawi Publishing Corporation
http://www.hindawi.com Volume 2013
Bioinformatics
Advances inPeptides
Hindawi Publishing Corporation
http://www.hindawi.com Volume 2013
Hindawi Publishing Corporation
http://www.hindawi.com Volume 2013
Enzyme
Research
Hindawi Publishing Corporation
http://www.hindawi.com Volume 2013
Biochemistry Research International
ISRN
Molecular Biology
Hindawi Publishing Corporation
http://www.hindawi.com Volume 2013
Stem Cells
International
Hindawi Publishing Corporation
http://www.hindawi.com Volume 2013