Running head: DATABASE OF SYNESTHETIC COLORS FOR KANJI
Database of Synesthetic Color Associations
for Japanese Kanji
Daisuke Hamada, Hiroki Yamamoto, Jun Saiki
Graduate School of Human and Environmental Studies, Kyoto University, Japan
Article: Behavior Research Methods
pp 1-16
First online: 07 January 2016
Abstract
Synesthesia is a neurological phenomenon where certain types of stimuli elicit involuntary perceptions in an unrelated pathway. A common type of synesthesia is grapheme-color synesthesia, where visual perception of letters and numbers stimulates perception of a specific color. Previous studies have often collected relatively small numbers of grapheme-color associations per synesthete, but accumulation of a large quantity of data has greater promise for uncovering the mechanisms underlying synesthetic association. In this study, we therefore collected large samples of data from total eight synesthetes. Among them, we obtained over 1000 synesthetic colors associated with Japanese kanji characters for each of two synesthetes, over 100 synesthetic colors for each of three synesthetes, and about 80 synesthetic colors associated with Japanese hiragana, Latin letters, and Arabic numerals for each of three synesthetes. We then compiled the data into a database, called the KANJI-Synesthetic Colors Database (K-SCD), which has a total of 5125 colors for 483, 46, and 46 Japanese kanji, hiragana, and katakana characters, respectively, as well as 26 Latin letters, and 10 Arabic numerals. In addition to introducing the K-SCD, this paper
demonstrates the database’s merits using two examples, in which two new rules for
synesthetic association, “shape similarity” and “synesthetic color clustering,” were
INTRODUCTION
Synesthesia is a neurological phenomenon in which ordinary stimuli elicit vivid individual perceptions in unrelated pathways, without a corresponding physical stimulus. For example, grapheme-color synesthetes experience subjective colors upon viewing black alphanumeric characters (Dixon, Smilek, & Merikle, 2004; Ramachandran, & Hubbard, 2001). Hearing-color synesthetes similarly “see” colors upon hearing particular sounds (Baron-Cohen, Wyke, & Binnie, 1987). Lexical-gustatory synesthetes “taste” particular flavors and experience particular oral textures upon hearing/reading particular words (Ward & Simner, 2003). These synesthetic perceptions arise without a corresponding sensory input. Therefore, studies on these forms of synesthesia must isolate the process of consciousness from sensory processing, and in doing so may provide a clue to understanding perceptual consciousness. Indeed, brain imaging studies conducted among synesthetic subjects have provided evidence identifying brain regions important for color perception (Hubbard, Arman, Ramachandran, & Boynton, 2005; Nunn et al., 2002; Sperling, Prvulovic, Linden, Singer, & Stirn, 2006). Synesthesia may also provide insight for understanding various aspects of cognition, including mental imaging (Barnett & Newell, 2008), memory (Luria, 1968, Tammet, 2006), art and creativity (Rich, Bradshaw, & Mattingley, 2005, Ramachandran & Hubbard, 2001), and numeracy (Rich et al., 2005).
Most of the knowledge of synesthesia comes from studies on grapheme-color synesthesia, the most common form of synesthesia. In this form, visual perception of letters and numbers (graphemes) induces simultaneous perception of a given color (e.g.,
the letter “F” may be green and the number “2” may be red) (Cytowic & Eagleman, 2009).
their associated colors visually in external space, characterizing them as existing “out there on the page.” Others, termed “associators,” perceived their colors in internal space,
characterizing them as existing “in my mind’s eye” or “in my head.” Researchers often
use this categorization to classify subjects. But, there are currently controversies regarding the validity of the ‘associator’ vs ‘projector’ categorisation (see Chiou & Rich, 2014).
What determines the associations between a grapheme and a color? There is some evidence of commonality between individuals. English-speaking synesthetes often associate synesthetic colors with the initial letter of common color name words, such as
“R” being red and “G” being green (Rich et al., 2005; Simner et al., 2005), and with
phonological information, such as “I” [aɪ] being white [waɪt] (Rich et al., 2005). However,
several studies showed that associations were idiosyncratic between individuals (Laeng, Svartdal, & Oelmann, 2004; Ward, Li, Salih, & Sagiv, 2007). For example, when shown
the letter “B”, one individual may report blue, another green, and others yellow. Even
synesthetic monozygotic twins report different colors stimulated by the same letter (Rich et al., 2005). These aspects of synesthetic associations suggest that direct correspondences between a grapheme and a color, (a first-order relation), are too elusive to guide the investigation of possible associative mechanisms.
Given this difficulty in establishing first-order relations, recent studies have begun to explore correspondence between the relationships among graphemes on the one hand and the relationships among colors on the other (a second-order relation) (Watson et al., 2012). Brang, Rouw, Ramachandran, and Coulson (2011) showed that similarity between synesthetic colors depended on similarity in the shape of letters. Eagleman (2010) argued that letters early in their respective alphabets (e.g. A, B, C, D) tended to be associated with colors that are more distinct from each other, whereas letters that come later (e.g. V, W, X, Y) tended to be associated with colors that were quite similar to each other. This ordinal relationship has also been found for Japanese hiragana characters (Asano and Yokozawa, 2013).
this project has verified almost 10,000 synesthetes across 15 types of synesthesia and 8 languages. In fact, the ordinal relationship described above was found by using this Battery. Although these databases have great utility, there is one fundamental limitation: The number of synesthetic colors per synesthete is relatively small. Previous studies have often been limited to color associations with only 26 Latin letters (A–Z) and 10 Arabic numerals (0–9), and this relatively small sample per synesthete confines the analysis to the global structure of synesthesia common across synesthetes. If samples per synesthete could be greatly enlarged, we may uncover novel rules governing the fine structure of synesthetic associations.
Therefore, this study took a new approach, complementary to existing databases, where thousands of synesthetic colors were collected from each of two synesthetes, hundreds of synesthetic colors were collected from each of three synesthetes, and about 80of synesthetic colors from each of three synesthetes. This study had two major goals. The first goal was to create a database that includes synesthetic colors for 483 kanji, 46 hiragana and 46 katakana. Hiragana and katakana are phonetic characters. Kanji are Japanese logographic characters where each character has its own meaning. These characters originated from Chinese and are mainly used to write content words. Kanji have at least two important characteristics as they relate to synesthetic color associations. The first is that kanji are visually comprised of multiple orthographic components, called radicals. Most kanji have two or more radicals, and many kanji characters share common radicals. For example, the characters 決, 河, 活, and 流 share the common sanzui
radical, “氵,” which signifies water. Radicals may be linked to colors, and radical
commonality may underlie the generation of synesthetic colors (Asano & Yokozawa, 2012). The second important characteristic is that most kanji have multiple readings, termed the on-yomi and kun-yomi. On-yomi are derived from the original Chinese pronunciation of the character, while kun-yomi come from the Japanese pronunciation (Tamaoka, 1991). For example, the kanji 青 (meaning “blue”) is pronounced as /sho/ or /sei/ using the on-yomi, and /ao/ using the kun-yomi. By taking advantage of these specific characteristics of kanji, we succeeded in collecting a number of synesthetic colors from each of five synesthetes associated with kanji characters.
The second goal of this study was to propose new research directions using the developed database. The new database should allow more thorough analyses on the structure of the association between a grapheme and a color. We will illustrate two promising directions here. The first direction is the analysis of first- and the second-order relationships between a given kanji character and synesthetic color, taking advantage of
kanji’s multifaceted properties for the study of regularities. Asano & Yokozawa (2011,
METHODS
We collected a large number of synesthetic colors for Japanese kanji, hiragana, katakana, Latin letters, and Arabic numerals from each of eight synesthetes. Five of them had synesthetic colors associated with all kinds of characters (kanji-color synesthetes), and others had synesthetic colors associated with hiragana, Latin letters, and Arabic numerals (hiragana-color synesthetes). The five kanji-color synesthetes participated in two experiments. The first employed a color-selection task to determine the synesthetic colors that they experienced when stimulated with printed graphemes comprising kanji, hiragana, katakana, Latin letters, and Arabic numerals. The second experiment employed a color-matching task to determine their synesthetic color associations for Latin letters and Arabic numerals displayed on a CRT monitor. The three hiragana-color synesthetes participated only in the color-matching task.
Participants
Eight Japanese synesthete (five females: SH, AH, MH, AM and YH; three males: SO, HS and YK; age range = 18–21 years) received payment (dependent on experiment time) for their participation in the experiments. SH and SO were self-reported projector-type synesthetes and the others were self-reported associator-projector-type synesthetes. Their scores on the color match consistency test were below 1.0, indicating a consistent and authentic synesthetic experience (Eagleman, Kagan, Nelson, Sagaram, & Sarma, 2007).
Color selection experiment
Visual stimuli
The test stimuli comprised individual black graphemes printed centrally on a
white card, called the “character card” (127 mm × 89 mm). Character cards used in
elementary education included 482 kanji, 46 hiragana (あ–ん), 46 katakana (ア–ン), 26 Latin letters (A–Z), and 10 Arabic numerals (0–9). Each kanji, hiragana, and katakana character was printed in 42-point HG textbook font (about 15 mm × 15 mm), and each Latin letter and Arabic numeral was printed in 72-point Arial font (about 25 mm × 33 mm). Character cards were placed on a desk covered by a black cloth and illuminated by a D65 daylight fluorescent lamp, which has a high color-rendering index of 98 (FL20S D-EDL-D65; TOSHIBA Inc., Tokyo, Japan). The viewing distance was approximately 40 cm.
Procedure
best matched their perceived synesthetic color using color chips from the Munsell Book of Color, Matte Finish Collection. More specifically, in each trial, they picked up a character card, placed it on the center of the desk, observed the character, and selected one of the five basic colors (5R, 5G, 5B, 5Y, 5P) that most resembled their synesthetic color. Next, they examined all four sheets for the selected basic color from the Munsell Book, and selected the color chip that best matched the synesthetic color. Finally, they
wrote the color chip’s Munsell code in a blank space on the character card. If they
perceived multiple synesthetic colors for a character, the procedure was repeated. The part of the character where they perceived each synesthetic color was marked by a box. Trials were blocked for kanji, hiragana, and katakana (40 blocks of 12 or 13 cards for kanji; 4 blocks of 12 or 10 cards for hiragana or katakana, respectively) and the order of the trials was quasi-randomized.
Two of the participants, SH and AH, performed a longer-term experiment (480 kanji characters) than the others did (240 kanji characters). As the experiment was expected to be very time-consuming, we decided to allow SH and AH to perform the experiment in their home in their free time, after practice sessions were performed in the laboratory. Care was taken to ensure that the experiment was performed in a constant visual environment. The other six synesthetes performed the experiment in our laboratory. All participants was instructed to view the cards under the high color-rendering lamp, to do the experiment regularly, and to keep an experimental diary. The diary confirmed that it took a long time to complete the experiment. In synesthetes that had kanji-color associations, SH spent 16 hours 45 minutes, 1 hour 4 minutes, and 54 minutes for the kanji, hiragana, and katakana sets, respectively, over a total of 17 days. AH spent 53 hours 30 minutes, 2 hour 4 minutes for the kanji and hiragana sets, respectively, over a total of 23 days. Because of this very time-consuming of experiment, the experimenter did not employ the color-selection task of katakana for AH. SO spent 14 hours 41 minutes, 54 minutes, and 40 minutes for the kanji, hiragana, and katakana sets, respectively, over a total of 7 days. MH spent 10 hours 11 minutes, 49 minutes, and 57 minutes for the kanji, hiragana, and katakana sets, respectively, over a total of 7 days. HS spent 9 hours 25 minutes, 1 hour 4 minutes, and 55 minutes for the kanji, hiragana, and katakana sets, respectively, over a total of 5 days. The experimenters checked for mistakes in recording of the Munsell codes, found a total of 13 typos of the Munsell codes (2 typos for SH, 6 typos for AH; 1 typos for SO; 2 typos for MH; 2 typos for HS), and excluded them
Color matching using a CRT monitor
Visual stimuli
L*a*b*) of each synesthetic colors were determined by a color-matching task using a CRT monitor (1280 × 1024 pixels, 100 Hz, NANAO, FlexScan F980). The test character in Arial font (3° visual angle) was located on the left side (3° from center) of the screen and a reference color patch was located on the right side (3° from center). The test character was black and the background color was gray (CIE x = .284, y = .341, Y = 30.0). The monitor was calibrated with a chromameter (CS-100A; Konica Minolta, Tokyo, Japan), using Mcalibrator2 software (Ban & Yamamoto, 2013).
Procedure
In the laboratory setting, the participant was asked to adjust the color of the displayed reference patch so that it best matched their perceived synesthetic color of the test character. More specifically, after 3 min of dark adaptation followed by 2 min of light adaptation, they started the color-matching trials. First, the character and the reference patch were displayed on the CRT monitor. The initial color of the reference patch was set to the chromaticity of the Munsell chip as determined in the color selection experiment, but with random variation of the CIE L*a*b* color coordinates of ±5, 5, or 10. Next, the participant adjusted the color patch with a digital input device until they felt that it matched her perceived synesthetic color. The input device allowed her to alter the L*a*b* color coordinates of the color patch independently by ±0.3, 1, and 1. The trial order was randomized.
Analysis
We used the CIE L*a*b* color space to analyze the distribution of synesthetic colors. The CIE L*a*b* coordinates specify colors using values along three axes: light and dark (L*), red and green (a*), and blue and yellow (b*). An L*a*b* color space is a uniform color space, where a given spatial distance corresponds to an equivalent perceptual difference; that is, one unit corresponds approximately to one just-noticeable difference. This uniformity would be suitable to interpreting the distribution of synesthetic colors when analyzing based on a distance metric, as described below.
points. We considered the distribution of synesthetic colors in an a*b* chromaticity plane to be a 2D point pattern, and then explored which distribution patterns the synesthetic colors exhibited.
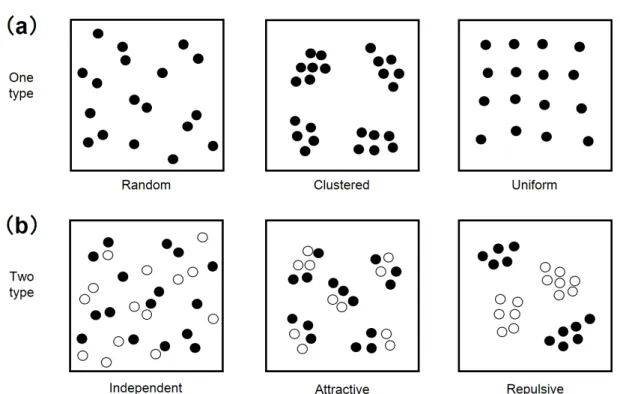
Figure 1. Examples of types of point pattern classified with spatial statistics. (a) When objects (points) comprising a single type, possible point patterns are random, clustered, or uniform. (b) When objects comprise two types, possible point patterns are independent, attractive, or repulsive.
More specifically, our exploratory analysis had three steps. First, the synesthetic
color’s point pattern was visualized in the a*b* chromaticity plane. Second, the density
of the point pattern was estimated by Kernel estimation using the density() function.
Kernel estimation calculates the density of points within a specified search radius (σ = 8.46) around each point. Third, the type of the synesthetic color’s point pattern was judged
by the L-function, computed from Ripley’s K-function, which is defined as
� = � � /λ. (1)
points within radius r of an arbitrary point. λ is the density of points (synesthetic colors per unit region), estimated by λ = n /a, with n points (synesthetic colors) in a given region a. If a point pattern is random, the K-function becomes
� = ��2. (2)
The L-function can be computed from the K-function as
� = √ � / � – �. (3)
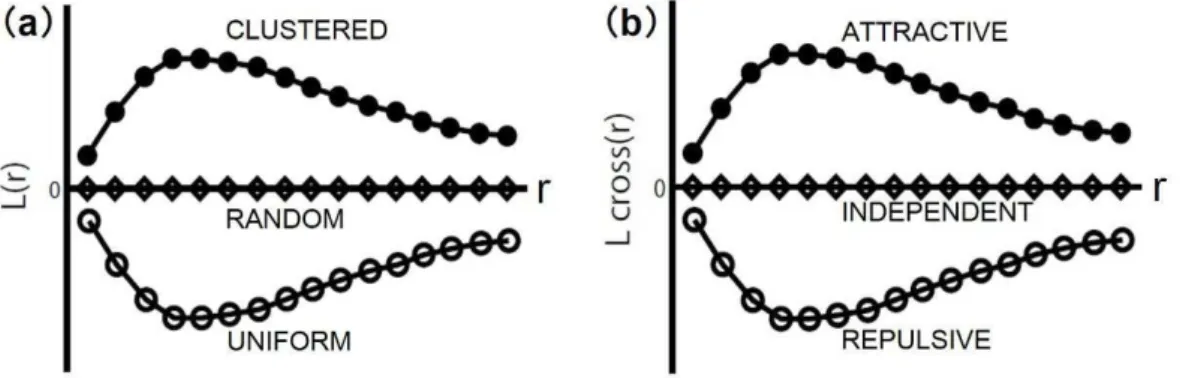
Using this L-function, we could classify the synesthetic color’s point pattern as being one of the three types: random when L (r) = 0, clustered when L (r) > 0, or uniform when L (�) < 0, as shown in Fig. 2a.
Figure 2. Example plots of expected L-function and cross L-function for the each of the three kinds of point patterns in Fig. 1a and Fig. 1b. For the definition of the L-function, see the main text. (a) Examples when objects comprise one type. If L-function is a constant 0, it indicates a random pattern, if it is positive, a clustered pattern, and if it is negative, a uniform pattern. (a) Examples when objects comprise two types. If L-function is a constant 0, it indicates an independent pattern, if it is a positive value, an attractive pattern, and if it is a negative value, a repulsive pattern.
more complex 雨 and 雲). The dependency of point patterns pairs was divided into three categories (Bailey & Gatrell, 1995), independent, attractive, or repulsive, as shown in Fig. 1. Independent is when no dependency was observed between the two patterns, attractive is when the two patterns collect at specific places, and repulsive is when the two patterns exclude each other. These types of synesthetic colors point patterns were judged by the cross L-function, which is computed from Ripley’s cross K-function, defined as
� = � � / � . (4)
Here, � � is the expected number of members of point pattern B within a given radius r of any arbitrary member of the point pattern A. � is the density of the point pattern B, which can be estimated as � /a, with a total of � members of the point pattern B and a given region a. The cross L-function can be computed from the cross K-function as
� = √ � / � – �. (5)
RESULTS
Synesthetic colors associated with kanji characters
We investigated the synesthetic colors associated with 482 kanji characters for SH and AH, and 240 kanji characters for SO, MH, HS. We obtained a total of 4187 colors from five synesthetes, as specified using the Munsell color system. Additionally, about 80 synesthetic colors from each of three synesthetes associated with hiragana characters. Notably, the number of synesthetic colors was larger than the number of kanji characters investigated. On average, a kanji character was associated with 2.26 colors for SH, 4.61 colors for AH, 1.92 colors for SO, 1.55 colors for MH and 0.80 colors for HS. In the below,the thousands of synesthetic colors for kanji characters were analyzed.
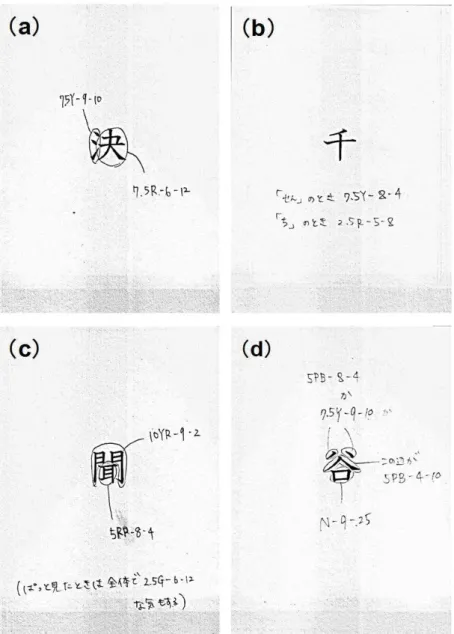
The first question we asked is “How is a kanji character associated with multiple colors?” There seem to be at least four ways for SH. The first was that synesthetic colors depended on the component radicals rather than the character as a whole, and that kanji characters are often comprised of multiple radicals. For example, the character “決” was perceived in two parts, the aforementioned sanzui radical “氵” perceived as yellow, and
the remaining “夬” component, perceived as red (Fig. 3a). This radical dependency was
also seen at synesthete SO, MH and HS. The second way was when synesthetic colors depended on pronunciation, and a kanji characters often have multiple readings. For
example, the character “千” was perceived as yellow when read by its on-yomi (/sen/),
while it was perceived as red when read by its kun-yomi (/chi/) (Fig. 3b). The third way was that a kanji character sometimes had an overall color that differed from the local
colors that were usually associated with its radicals. For example, the character “聞” is
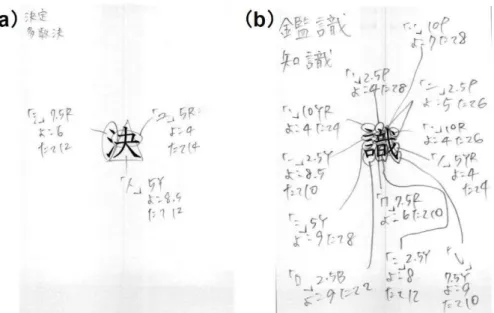
comprised of two radicals (“門” and “耳”), which were perceived to have their own local colors (yellow-red and red-purple, respectively), but the character as a whole was perceived to be green (Fig. 3c). The fourth way was that a kanji was sometimes simply perceived to be two different colors. For example, the upper radical (“ハ”) of the “谷” character was sometimes perceived as purple-blue and sometimes as yellow (Fig. 3d). For synesthete AH, almost of synesthetic colors depended on finer component parts of kanji characters beyond radicals. For example, the character “決” was divided into radical “氵”
and the “夬” as well as SH, but then the“夬” was divided into the “ユ” and the remaining
“人”. The sanzui “氵” perceived as red, the “ユ” component, perceived as different red,
and the “人” component, perceived as yellow (Fig. 4a). The character “識” was associated
Figure 3. Representative results of the color-selection experiment from a projector-type synesthete SH. Each figure is a scanned character card. The synesthete wrote the Munsell codes and supplemental comments in the blank spaces on the character
cards. (a) An instance where synesthetic colors varied by radical. The “決” was divided
into the “氵” radical and the remaining “夬” component, each of which had a distinct
color. (b) An instance where synesthetic colors varied by sound. She described that when
“千” was read by its on-yomi, “sen”, the color was 7.5Y-8-4, and when it was read by its
kun-yomi “chi”, the color was 2.5R-5-8. (c) An instance where the global color differed
from local colors. She added to her notation of the individual colors that “At a glance, I
feel also that the whole character is 2.5G-6-12”. (d) An instance of the case where the
synesthetic color switched for the same part. She described that the upper part (“ハ”) of
Figure 4. Representative results of the color-selection experiment froman associator-type synesthete AH, in similar fashion to Fig. 3. Both (a) and (b) shows instances where
synesthetic colors varied by finer components beyond radicals. (a) The “決” was divided
into the “氵” radical and the “夬” component, and even the “夬” was divided into the “ユ”
into the remaining “人”, each of which had a distinct color. (b) the “識” was associated with most the synesthetic colors (12 colors), which depended on highly-detailed components of the kanji character.
We also investigated 46 hiragana characters, 46 katakana characters, 26 Latin letters, and 10 Arabic numerals for SH, SO, MH and HS and these characters other than katakana for AH. Some of these characters were associated with two colors for SH and AH and thus there was a slightly greater number of synesthetic colors than characters (SH: 144 colors for 128 graphemes; AH: 192 colors for 82 graphemes; SO: 144 colors for 128 graphemes; MH: 144 colors for 128 graphemes; HS: 144 colors for 128 graphemes). When these were added with the kanji, there was a total of 1229 (SH), 2349 (AH), 429 (SO), 325 (MH) and 191 (HS) synesthetic colors collected, respectively.
where there were few points (a* vs. b*), suggesting that synesthetic colors were neither randomly nor uniformly distributed in the color space. This types of bias was also present for luminance dimension. Focusing on the point pattern along the luminance axis for kanji-color synesthetes (L* vs. a* and L* vs. b), there were a small number of dark colors with L* less than about 30 (Fig. 5c, d, g, h, k, l, o, p, s, t). For hiragana-color synesthetes AM, it can be seen that there were few dark colors with L* less than about 30 (Fig. 6c, d). In contrast, For YK and YH, it can be seen that there were dark colors with L* less than about 30 (Fig. 6g, h, k, l). Taken together, it appears that the synesthetic colors are distributed more heavily in some regions in the color space. Detailed analyses of this tendency are investigated at greater length using spatial statistics in the “Example of
Figure 5. The distribution of synesthetic colors collected from kanji-color synesthetes in CIE L*a*b* uniform color space. Synesthetic colors of kanji, hiragana, and katakana were transformed from the Munsell values to CIE L*a*b* values. (a) synesthetic colors of SH in L*a*b* color space, (b) those projected onto the a* vs. b* chromaticity plane, (c) those projected onto the L* vs. a* plane, and (d) those projected onto the L* vs. b* plane.(e ~ t) for AH, SO, MH, and HS in similar fashion to (a,b,c,d).
a* b*
L
*
a* b*
L
*
a* b*
L
*
a* b*
L
*
a* b*
L
*
SH (a)
AH (e)
SO (i)
MH (m)
HS (q)
(b) (c) (d)
(f) (g) (h)
(j) (k) (l)
(n) (o) (p)
Figure 6. The distribution of synesthetic colors collected from hiragana-color synesthetes in CIE L*a*b* uniform color space, in similar fashion to Fig. 5. (a) synesthetic colors of AM in L*a*b* color space, (b) those projected onto the a* vs. b* chromaticity plane, (c) those projected onto the L* vs. a* plane, and (d) those projected onto the L* vs. b* plane. (e ~ i) for YK and YH in similar fashion to (a,b,c,d).
We compiled these diverse synesthetic colors and the associations between kanji characters and colors into a database that could be helpful for the study of grapheme-color synesthesia. In the following sections, we describe the contents of the database and introduce new research directions that this database has opened up.
Database contents
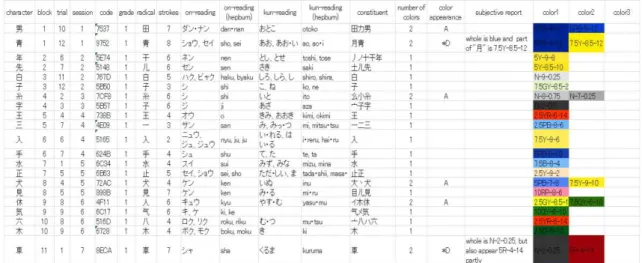
Figure 7. A screen shot of the kanji sheet in the K-SCD.
Table 1
Synesthetic color information and auxiliary information for characters in the database
Note. Color class includes chromaticity coordinates for Japanese kanji, hiragana, and katakana, Latin letters, and Arabic numerals. The elemental class contains subclasses relating to various components of kanji characters. The supplemental class has subclasses relating to complementary information about kanji characters or perceived synesthetic colors.
Kanji sheet
The kanji sheet had kanji characters in rows and various auxiliary information
associated with each kanji character in columns, hereafter called “classes.” The classes
a visualization of the color by coloring the cell background.
The elemental class was the category of the various components in the kanji
character. This had subclasses of “radical”, “constituent” “on-yomi”, “kun-yomi” and
“grade”. “Radical” described common sub-elements found in different kanji characters.
The “constituent” subclass showed component parts of the kanji character, set to
investigate the influence of all component shapes, not limited solely to radicals. The “
on-yomi” and “kun-yomi” subclasses list the various readings of the kanji character, as
previously described. “Grade” shows the year when the given kanji character is taught in
Japanese elementary school (first through sixth grade), as stated by the Ministry of Education, Culture, Sports, Science and Technology of Japan’s appendix “List of Kanji
by School Year” of “Course of Study for Elementary School”. As the school year in which
kanji characters are taught is standardized by the Ministry, this item will be potentially useful for the research on the longitudinal tendency of synesthetic colors.
The supplemental class was a category containing complementary information about kanji characters or synesthetic colors. This was divided into five subclasses,
“strokes,” “number of colors,” “color appearance,” “subjective report”, and “overall colors.” “Strokes” was the number of strokes in the kanji character. “Number of colors” showed the number of synesthetic colors associated with the character. “Color appearance”
categorized the various ways that the synesthete perceived the colors, divided into nine
categories: (a) colors were divided into each part (“component”) of the kanji; (b) colors
switched at within the same part; (c) colors were divided into each part, but there were a different overall color when seeing a character as a whole; (d) there was an overall color when seeing a character as a whole, but there was also local color; (e) the color changed depending on the reading or meaning; (f) colors were divided into each part and also colors switched in some part; (g) colors were perceived “somewhere”; (h) there was a
part with no color; and (i) there were colors in the mind’s eye. Lastly, “subjective report” contained additional information on the synesthete’s subjective thoughts about the
information contained in color appearance. “Overall colors” was overall synesthetic color of a kanji character.
Hiragana, katakana, and English grapheme sheets
These sheets had each character in a row and select classes or subclasses associated with the character in the columns. The hiragana and katakana sheets had the
color class and the supplemental class (only “number of colors” and “subjective report”).
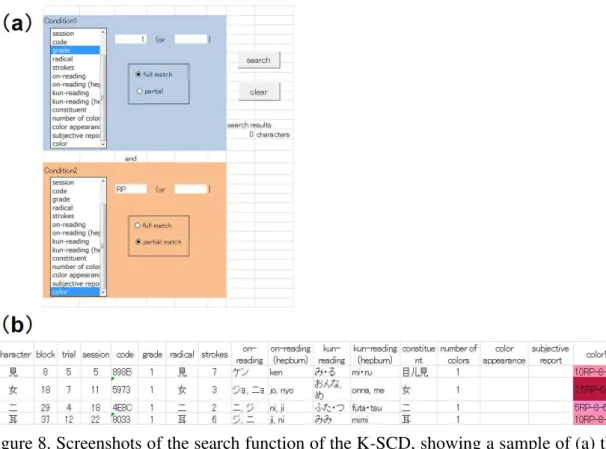
Search sheet
The search sheet can take arbitrary data from the kanji sheet. Figure 8 shows a screenshot of the search sheet. The search sheet has two functions for searching the database. The first was an OR search, where a user can assign a maximum of two factors per subclass. The second was an AND search, where a user can assign a maximum of two conditions. For these searches, search terms may be fully or partially matched. If a user would, for example, like to search for data on kanji that are first-grade level and were associated with red-purple synesthetic colors, as described in Fig. 8a, the user inputs “1” for grade with full match selected as condition 1 and inputs “RP” for color with partial match selected as condition 2. Figure 8b shows the result of this example search, containing all returned entries fulfilling the condition.
Figure 8. Screenshots of the search function of the K-SCD, showing a sample of (a) the search field and (b) the search results.
Example of applications
Exploring the relationship between the multidimensional natures of kanji and synesthetic colors
kanji characters and synesthetic colors. Here, we wanted to illustrate this with an example in which the first- and the second-order relationships of the association were examined, focusing on SH that had four ways of grapheme-color associations.
At first, we focused on the first-order relation; namely, which radicals were most frequently associated with what colors? To answer this, we determined the most frequent color among the five basic Munsell colors. In the database search sheet, we assigned each
basic color (“R”, “Y”, “G”, “B”, and “P”) for color with partial match selected as
condition 1. The most frequent color was yellow: 332 of 482 kanji characters had a yellowish color. We then explored the relationship between these yellowish colors and various radicals to check for common radicals or constituents in the 332 detected characters. It was found that yellowish colors were associated with the sanzui “氵”, tsukanmuri “ツ”, and ninben “イ” radicals. We then considered a possible second-order relationship: Do characters with shapes similar to these radicals have similar colors? To
answer this, we examined three katakana characters with similar shape, “シ”, “ツ”, and
“イ”. Interestingly, these katakana characters also had a yellowish color. Taken together,
for the most frequent color (yellowish), characters with similar shape have similar colors.
Analysis of the global structure of synesthetic colors in the chromaticity space
Finally, to confirm these synesthetic color clusters, we analyzed the type of point pattern using the L-function (Fig.11: kanji-color syesthetes; Fig. 12: hiragana-color synesthetes). As shown in Fig. 11, 12, the L-function returned positive values greater than the confidence intervals. This suggests that synesthetic colors are concentrated in multiple regions in the color space, that is, they form “synesthetic color clusters”.
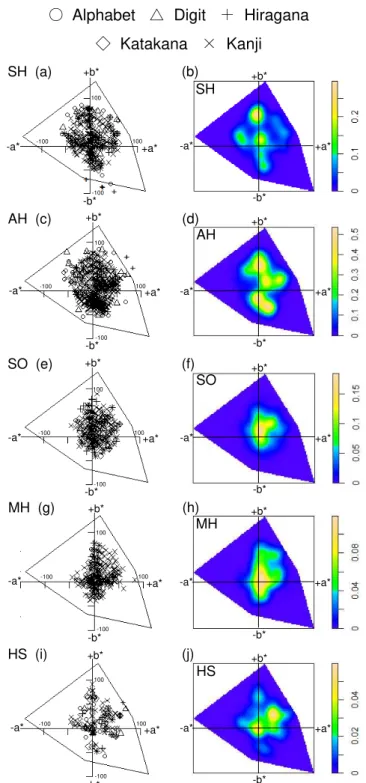
Figure 9. (a, c, e, g, i) The point patterns of synesthetic colors in the a*b* chromaticity -b* -a* +a* +b* 100 -100 100 -100 -b* -a* +a* +b* -b* -a* +a* +b* 100 -100 100 -100 -b* -a* +a* +b* -b* -a* +a* +b* 100 -100 100 -100 -b* -a* +a* +b* -b* -a* +a* +b* 100 -100 100 -100 -b* -a* +a* +b* -b* -a* +a* +b* 100 -100 100 -100 -b* -a* +a* +b*
SH (a) (b)
SH
AH (c) (d)
SO (e) (f)
MH (g) (h)
HS (i) (j)
AH
SO
MH
HS
○ Alphabet △ Digit + Hiragana
plane for kanji-color synesthete SH, AH, SO, MH and HS respectively. (b, d, f, h, j) The density plot of synesthetic colors as estimated by Kernel estimation for each synesthete. Achromatic synesthetic colors were excluded and then the density was estimated as before. Color bars denote density � of the points within a specified search distance (σ = 8.46) of each point.
Figure 10. (a, c, e) The point patterns of synesthetic colors in the a*b* chromaticity plane for hiragana-color synesthete AM, YK and YH respectively, in similar fashion to Fig. 9.
AM (a) (b)
-b* -a* +a* +b* 100 -100 100 -100 -b* -a* +a* +b* AM -b* -a* +a* +b* 100 -100 100 -100 -b* -a* +a* +b*
YK (c) (d)
YK -b* -a* +a* +b* 100 -100 -100 100 -b* -a* +a* +b*
YH (e) (f)
YH
Table 2
High-density and low-density region of synesthetic colors in in the a*b* chromaticity plane
Figure 11. L-function of the point pattern for the chromatic synesthetic colors atdistance rof a given point for kanji-color synesthetes. The solid black line indicates the computed L-function. The interval between the two blue lines indicates the 95% confidence intervals. Specifically, many spatial point patterns (1000) randomly selected from the Munsell renotation data can be generated under CSR and Ripley’s K-function estimated for each one.
Figure 12. L-function of the point pattern for the synesthetic colors atdistance rof a given point for hiragana-color synesthetes, in similar fashion to Fig. 11. The interval between the two blue lines indicates the 95% confidence intervals for complete spatial randomness (CSR). Specifically, many spatial point patterns can be generated under CSR and Ripley’s K-function estimated for each one.
Distance(r)
L-f
unc
tion
䠄SH䠅
Distance(r)
L-f
unc
tion
䠄AH䠅
Distance(r)
L-f
unc
tion
䠄SO䠅
Distance(r)
L-f
unc
tion
䠄MH䠅
Distance(r)
L-f
unc
tion
䠄HS䠅
Distance(r)
L
-func
ti
on
䠄AM䠅
Distance(r)
L
-func
ti
on
䠄YK䠅
Distance(r)
L
-func
ti
on
Explanations of the script for spatial statistics of synesthetic colors
Since the database was made in the widely used Excel format, it can be easily imported to many kinds of statistical software. For example, the above spatial statistics analysis was done using R, as is shown in Fig. 13. The details of the analysis steps are explained below to help researchers understand and modify the script for their own use.
Step 1: Prepare a spatstat package and input row data into R. Then, the user can input a portion of the database as a text file, for example, the L*a*b* coordinates of synesthetic colors.
Step 2: Create a point pattern object using a class ppp object. The ppp(x, y, window = w, marks = mf) will create the point pattern inside a rectangle. x (a*) and y (b*) are vectors of each coordinate of data points. The window = w specify a range of the
polygon. Each coordinate value of the polygon was decided by each of most achromatic color (red: [a*, b*] = [82.28, 22.42]; green: [-139.00, 20.36]; yellow: [11.91, 134.92]; blue: [-14.69, -67.01]; purple: [116.06, -94.45]) from the Munsell renotation data (http://www.rit.edu/cos/colorscience/rc_munsell_renotation.php). Next is defining marks, which is an additional attribute of each point in the point pattern (Baddeley, 2010). For example, in addition to the color coordinates of synesthetic colors, a user could also record the kanji, hiragana, katakana, letter, and numerals. This marked point pattern is constructed by the mf in the script. Step 3: Plot the point patterns and its density map. First, the user can plot the point patterns
using a plot(x, window = w), and the x is a point pattern. Next, a user can plot the map of kernel density estimation by a plot(density(x, σ). The x is apoint pattern. The σ is standard deviation of the isotropic Gaussian smoothing kernel used for the kernel method.
Step 4: Analyze point patterns using the L-function. The user can compute the K-function for a point pattern x using the Kest function. Next, the K-function can be used to plot the computed L-function using plot(K, sqrt(iso/pi) ~ r).
DISCUSSION
All previous studies on grapheme-color synesthesia have considered dozens of samples per synesthete (often 26 Latin letters and 10 Arabic numerals). In this study, we created a new database, which we call the Japanese KANJI-Synesthetic Colors Database (K-SCD). The K-SCD has 1229 and 2349 synesthetic colors for each of two synesthetes associated with 483 kanji, 46 hiragana, 46 katakana, 26 Latin letters, and 10 Arabic numerals, 429, 325 and 191 synesthetic colors for each of three synesthetes, and about 80 synesthetic colors for each of three synesthetes associated with hiragana, Latin letters, and Arabic numerals. To our knowledge, no study collected such a large number of synesthetic colors per synesthete. The large samples in the K-SCD should allow investigation of the intrapersonal structure of the grapheme-color synesthetic experience and possibly lead to promising new ways of studying synesthesia.
We illustrated two such ways here. Although these are preliminary studies in the sense that only partial information from the database was utilized, they nevertheless provided important findings. The first example, taking advantage of the multidimensional properties of kanji, analyzed the regularity in the first- and the second-order relationships between the radicals of kanji characters and their associated synesthetic colors. This analysis found that the radicals with similar shapes to katakana characters have similar colors to those katakana characters. This second-order relationship suggests that the colors associated with certain kanji may originate from those associated with katakana. This possibility is consistent with a previous finding (Asano & Yokozawa, 2012) showing that synesthetic colors for Japanese graphemes acquired at an early age (i.e., numerals, hiragana, and katakana) affect those acquired later in life (i.e., kanji) via their phonological and/or semantic content. The present result suggests the possibility that visual shape also contributes as a key factor for the process of synesthetic learning. Future studies may find other factors by analyzing auxiliary information such as pronunciation, meaning, and grade level of kanji.
synesthetic colors of newly learned graphemes. In the second process, a new character may be tinged with a color similar to the core color of the character to which it is most similar, and the color distance from the core may be proportional to the distance in similarity between the two characters in a given grapheme space, leading to clustering. In this scenario, the synesthetic color clusters may reflect both between- and within-category difference in the grapheme similarity space.
The emergence of the synesthetic color clusters may be further analyzed using the cross L-function to investigate the interdependency of two point patterns. Point patterns can be divided into three categories: independent, attractive, or repulsive (Fig. 1: bottom). Our above hypothesis predicts the attractive dependency between kanji and hiragana characters and between kanji characters across learning grades. This is supported by our preliminary analysis for the inter-relation between hiragana characters and Latin letters (Yamamoto, 2009). A preliminary analysis for kanji among learning grades (sample codes are shown in Fig. 9) also supports this hypothesis.
ACKNOWLEDGMENT
We would like to thank Maho Taniguchi for collecting data and Haruna Kawasaki for pilot analyses.
REFERENCES
Asano, M., & Yokosawa, K. (2011). Synesthetic colors are elicited by sound quality in Japanese synesthetes. Consciousness and Cognition, 20, 1816–1823. doi:10.1016/j.concog.2011.05.012
Asano, M., & Yokosawa, K. (2012). Synesthetic colors for Japanese late acquired graphemes. Consciousness and Cognition, 21, 983–993. doi:10.1016/j.concog.2012.02.005
Asano, M., & Yokosawa, K. (2013). Grapheme learning and grapheme-color synesthesia: toward a comprehensive model of grapheme-color association. Frontiers in Human Neuroscience, 7, 757. doi: 10.3389/fnhum.2013.00757
Baddeley, A. (2010). Analysing spatial point patterns in R. CSIRO, available on-line at http://staffhome.ecm.uwa.edu.au/~00025879/
Bailey, T. C., & Gatrell, A. C. (1995). Interactive Spatial Data Analysis. Longman Higher Education, Harlow, UK.
Ban, H., & Yamamoto, H. (2013) A non-device-specific approach to display characterization based on linear, nonlinear, and hybrid search algorithms. Journal of Vision, 13(6): 20, 1-26
Barnett, K. J., & Newell, F. N. (2008). Synaesthesia is associated with enhanced, self-rated visual imagery. Consciousness & Cognition, 17(3), 1032–1039. doi:10.1016/j.concog.2007.05.011
Baron-Cohen, S., Burt, L., Smith-Laittan, F., Harrison, J., & Bolton, P. (1996). Synaesthesia: Prevalence and familiarity. Perception, 25(9), 1073–1079.
Baron-Cohen, S., Wyke, M. A., & Binnie, C. (1987). Hearing words and seeing colours: An experimental investigation of a case of synaesthesia. Perception, 16, 761–767. Brang, D., Rouw, R., Ramachandran, V. S., & Coulson, S. (2011). Similarly shaped letters
evoke similar colors in grapheme–color synesthesia. Neuropsychologia, 49, 1355– 1358. doi:10.1016/j.neuropsychologia.2011.01.002
Chiou, R., & Rich, A. N. (2014). The role of conceptual knowledge in understanding
synesthesia: evaluating contemporary findings from a “hub-and-spokes” perspective.
Frontiers in PSYCHOGY, 5, 105. doi: 10.3389/fpsyg.2014.00105
Cytowic, R. E., & Eagleman, M. D. (2009). Wednesday is blue: Discovering the Brain of Synesthesia.
Dixon, M.J., Smilek, D., & Merikle, P.M. (2004). Not all synaesthetes are created equal: Projector versus associator synaesthetes. Cognitive, Affective and Behavioural Neuroscience, 4(3), 335-343.
standardized test battery for the study of synesthesia. Journal of Neuroscience Methods, 159, 139–145.
Eagleman, D. M. (2010, March). What has large-scale analysis taught us? Paper presented at the 2010 Meeting of the UK Synaesthesia Association, Brighton, U.K.
Laeng, B., Svartdal, F., & Oelmann, H. (2004). Does Color Synesthesia Pose a Paradox for Early-Selection Theories of Attention? Psychological Science, 15, 277-281. Luria A. (1968). The Mind of a Mnemonist. New York: Basic Books
Mills, C. B., Viguers, M. L., Edelson, S. K., Thomas, A. T., Simon-Dack, S. L. & Innis, J. A. (2002). The color of two alphabets for a multilingual synesthete. Perception, 31, 1371-1394. doi:10.1068/p3429
Ramachandran, V. S., & Hubbard, E. M. (2001). Synesthesia: A window into perception, thought and language. Journal of Consciousness Studies, 8, 3-34.
Rich, A. N., Bradshaw, J. L., & Mattingley, J. B. (2005) A systematic, large-scale study of synaesthesia: implications for the role of early experience in lexical-colour associations. Cognition, 98, 53-84. doi:10.1016/j.cognition.2004.11.003
Simner, J., Ward, J., Lanz, M., Jansari, A., Noonan, K., Glover, L., & Oakley, D. A. (2005). Non-random associations of graphemes to colours in synaesthetic and non-synaesthetic populations. Cognitive Neuropsychology, 22, 1069–1085. doi:10.1080/02643290500200122
Tamaoka, K. (1991). Psycholinguistic Nature of the Japanese Orthography. Studies in Language and Literature, 11(1), 49–82.
Tammet D. (2006). Born on a Blue Day. London: Hodder & Stoughton.
Ward, J., Li, R., Salih, S., & Sagiv, N. (2007). Varieties of Grapheme-Colour Synaesthesia: A New Theory of Phenomenological and Behavioural Differences. Consciousness and Cognition 16(4), 913-931. doi:10.1016/j.concog.2006.09.012 Ward, J., & Simner, J. (2003). Lexical-gustatory synaesthesia: Linguistic and conceptual
factors. Cognition, 89, 237–261. doi:10.1016/S0010-0277(03)00122-7
Watson, M. R., Akins, K. A., & Enns, J. T. (2012). Second-order mappings in grapheme-color synesthesia. Psychon Bull Rev, 19, 211–217. doi 10.3758/s13423-011-0208-4 Yamamoto, H. (2009, August) An exploratory analysis of the synesthetic color