THE NEUTRAL THEORY AND NATURAL SELECTION IN THE HLA REGION
Yoko Satta, Yi-Ju Li and Naoyuki Takahata
Department of Biosystems Science, The Graduate University for Advanced Studies, Hayama, Kanagawa 240-0193, Japan
Received 4/3/98 Accepted 4/7/98
TABLE OF CONTENTS
1. Abstract
2. Introduction
3. Genes and nucleotide differences in HLA
4. Intergenic recombination
5. DRB1 allelic lineages and disease association
6. Perspective
7. Acknowledgments
8. References
1. ABSTRACT
Based on available DNA sequence data in the
HLA region of 4 Mb, we review the degree of
polymorphism at 39 loci of which most are involved in the
immune system. The extent of nucleotide differences per
silent site differs greatly from locus to locus. It is
exceptionally high at classical MHC loci, intermediate at six
MHC-related pseudogenes as well as at some loci in class I
and II regions, and low in the class III region. Different
exons of individual MHC loci show also different degrees of
silent polymorphism; high in the exons encoding for the
peptide binding region (PBR) and low in the exons encoding
for trans-membranes and cytoplasmic tails. The degree of
polymorphism within MHC allelic lineages is not much
smaller than that between allelic lineages, contrary to the
expectation where intra-allelic sequence exchanges are
restricted. The observation that many allelic lineages at the
HLA-DRB1 locus are combinations of distinct motifs in the
beta pleated sheet and alpha helix of PBR indicates that
sequence exchanges occur even within exon 2. Semi-
quantitative analysis is presented about the rate of sequence
exchanges between selected and linked neutral regions,
although more sequence information is necessary to make
definite conclusions. The extraordinary MHC
polymorphism is viewed from the dual function of MHC
molecules that controls the acquired immune system.
2. INTRODUCTION
The pattern and degree of polymorphism across
the genome are a useful indicator for identifying genes or
genomic regions which are subjected to different types of
natural selection. In some circumstances, polymorphism
may also be used to infer the function of unknown genes.
Without the action of natural selection, polymorphism
(often measured by the pairwise nucleotide differences at
the DNA level) must have evolved in much the same way
as what the neutral theory of molecular evolution depicts
(1, 2): The larger the effective population size (N
e) and the
higher the neutral mutation rate, the more polymorphic. In
genomic regions experiencing either positive or negative
selection (purifying selection), polymorphism is lowered
(3, 4), while in those experiencing diversifying or balancing
selection, it is enhanced (5-9). These contrasting effects of
natural selection are not necessarily confined in the target
region per se, but they should be manifest also in a
neighboring genomic region in linkage. An important
factor is obviously the rate (c) of recombination between
two linked regions under study (5, 9).
A pair of neutral genes in an autosomal region
segregate for 2N
egenerations on average (10), so that if
recombination occurs rarely or at rate c = 1/N
eor less with
the target region of natural selection, the linked neutral
polymorphism will be affected (11). Since N
eis estimated
as about 104 for the human population over the past one
million years (7, 12), the indirect effect of natural selection
extends to the neighboring region with c ≤ 0.01% or
physical map distance ≤ 10 kb if 1 cM = 1 Mb (13). Thus,
if reduced polymorphism is observed in a neutral region,
purifying selection might have occurred somewhere in the
surrounding left or right 10 kb region during a much shorter
period of time than the last 2 × 10⁴ generations. On the
other hand, if enhanced polymorphism is observed,
balancing selection might have been operating throughout a
much longer period of time than 2 × 10⁴ generations. In
this case, the candidate region may be broader than of 20 kb
because the efficiency of recombination is reduced in
proportion to the number of alleles that are maintained by
balancing selection (9).
In humans, the nucleotide differences are
0.08% over 18,844 silent (synonymous) sites for 48 pairs
of carefully checked autosomal sequences ("standard") (12,
14). For 12 additional pairs of unchecked sequences (14),
the silent differences become high (0.31% over 6,071 sites),
yet they are much smaller than 1%. Although no
comparable estimates except for mitochondrial DNA are
available in non-human primates (15), the silent differences
(1.3% on average) in Drosophila melanogaster and its
sibling species suggested that the degree of DNA
polymorphism in humans is exceedingly low (14).
Notwithstanding, the silent differences at some functional
HLA class I and II loci are 50 to 100-fold greater than the
standard (16). Convincing evidence accumulated to support
the notion that this results from the long lasting operation
of balancing selection for non-silent substitutions in the
peptide binding region (PBR) of major histocompatibility
complex (MHC) molecules (17 - 20).
This review first summarizes the polymorphism
at 39 loci dispersed in the HLA region of 4 Mb; some are
MHC proper or their pseudogenes and others encode for
proteins involved in the immune system. Second, the silent
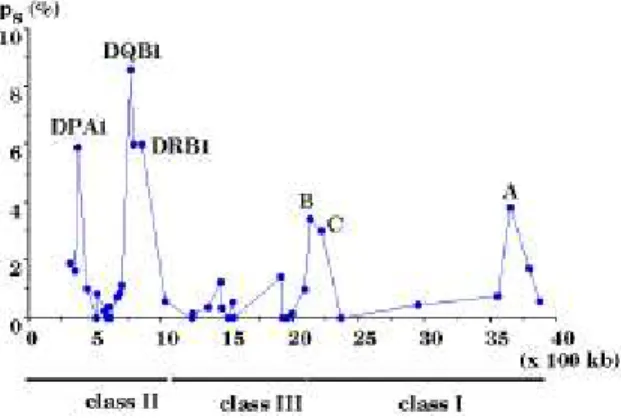
Figure 1 . The silent nucleotide differences (ps) and
chromosomal locations of 39 loci in the HLA region of 4
Mb (41 - 43).
differences at a particular locus are plotted against the
physical map distance from the nearest highly polymorphic
MHC locus and this relationship is used to examine semi-
quantitatively whether 1 cM = 1 Mb holds true in the HLA
region. Third, the silent differences within and between
class II DRB1 allelic lineages are presented to discuss the
possibility of intra-exonic recombination or gene conversion
(21 - 23). Relevant multi-locus haplotype data from
Siberian populations (24) are briefly mentioned. Finally,
we provide short comments on MHC-mediated thymic
selection in T cell repertoire and some perspectives for the
HLA study.
3. GENES AND NUCLEOTIDE DIFFERENCES IN
HLA
The degree of polymorphism at 39 loci in HLA is
summarized in table 1 in terms of the average number of
nucleotide differences and the number of segregating sites at
both silent (S
s) and non-silent sites (S
n). It is clear that the
degree differs greatly from locus to locus (figure 1).
Without direct and indirect effects of natural selection, the
silent polymorphism should be relatively uniform over the
loci, while the non-silent polymorphism may vary from
locus to locus owing to different degrees of functional
constraints (2). Nevertheless, the non-silent as well as
silent polymorphism at classical class I or class Ia (A, B
and C) and class II (DPB1, DPA1, DQB1, DQA1, DRB1
and DRA) loci is enhanced considerably from the standard
value of 0.08%. The overall silent differences (p
s) at these
class Ia and II loci are 3.37% and 4.20% per site,
respectively. If the neutral mutation rate is 10
-9per site per
year (25), it must have taken about 20 million years or
some millions of generations for these silent differences to
have accumulated. The different GC content in the HLA
region may well affect the neutral mutation rate, but this
does not seem sufficient to account for the observed
heterogeneity in the extent of polymorphism. No doubt,
the enhanced silent polymorphism has resulted largely from
the action of balancing selection on the PBR and its indirect
effects on tightly linked silent sites. The overall non-silent
polymorphism is also as great as the silent polymorphism.
The absence of any appreciable difference between silent
and non-silent polymorphism of MHC genes is similar to
what is expected for pseudogenes (2), but for very different
reasons.
The remaining 30 include immunity-related loci in
addition to two class I and four class II pseudogenes in
which all nucleotide sites are treated as silent. The overall
p
svalue at these 30 loci reduces to 127/15,132 = 0.84%.
Yet, it is ten-fold larger than the standard (P < 0.01). Also,
the p
svalue of 1.2% over the four class II pseudogenes
(DPB2, DQB2, DQA2 and DQB3) is much greater than the
standard (P < 0.01). This enhancement may be due to
recent cessation of balancing selection, inter-locus sequence
exchanges (unequal crossover or gene conversion), or tight
linkage to classical class II loci. The first possibility is
unlikely because the presence of DPB2 or DQB2 orthologs
in various primates (26) suggests that the two loci were
inactivated long before their alleles were generated. The
second possibility is inconsistent with the monophyletic
relationships between these pseudogenes and functional
paralogs (26); with inter-locus sequence exchanges, the
relationships must be para- or polyphyletic. Thus, the
relatively large p
svalue for these pseudogenes is attributed
to indirect effects of balancing selection operating on nearby
polymorphic class II loci.
The LMP2 and LMP7 genes encode for subunits
of a proteasome, while the TAP1 and TAP2 genes encode
for ABC transporter proteins, all being involved in
processing of proteins into peptides that are loaded onto
class I molecules (27). Unlike the rat TAP ortholog (28,
29), these four loci in HLA are rather monomorphic: The
p
svalue of 0.19% over the 1,492 silent sites is not different
from the standard. The DNA and DOB genes as well as
DMA and DMB genes encode for alpha and beta
polypeptide chains, respectively, each pair of chains
forming heterodimers like classical class II chains (30 - 32).
The function of the DM heterodimer is thought to facilitate
the exchange of class II associated invariant chains for
peptides that are generated in lysosomes from self and non-
self proteins (33), while the DO heterodimer inhibits such a
catalytic action of DM (34, 35). The average p
svalue at
these loci is 0.46%. Because of the small number of sites
compared (549 bp), the difference of p
s= 0.46% from the
standard is only marginally significant (0.05 < P < 0.1).
Among 13 loci in the class III region, CYP21B
(steroid 21-hydroxylase involved in biosynthesis of cortisol
and aldosterone) and HSP70-2 (the major heat-inducible
chaperone of the HSP70 group) are shown to have
undergone frequent sequence exchanges with nearby
paralogs (36, 37). As a result, the nucleotide differences are
rather large so that in what follows, these two loci are
excluded from consideration. In the remaining 11 loci, the
average p
svalue of 0.22% at 3,329 sites is not different
from the standard. However, the non-silent differences (p
n)
of 0.24% are greater than 0.024% at the standard loci (P <
0.01). It turns out that MICA (MHC class I chain-related
A) is unusual in that among 16 alleles at the locus, there are
22 non-silent segregating sites out of 618 and the alleles are
different from each other by seven such sites on average.
The MICA and MICB genes encode for non-classical (or
class Ib) MHC molecules (38 - 41) and may be recognized
mainly in intestinal epithelium by T lymphocytes with
gamma-delta T cell receptors (Tcr) (42). The significantly
large p
nvalue of MICA may be associated with
this putative function. The class III region
also encodes for several other immunity-related genes
(27) such as in the complement cascade (C4B, Bf) and the
regulation of T lymphocyte development and function
(TNF).
Table 1. The per-site nucleotide differences (p) and the number of segregating sites (S) over L sites at each of 39 loci in the HLA
coding region.
Locus Silent Non-silent References
(#genes) K
s/L
s= p
s(%) S
sK
n/L
n= p
n(%) S
nor accession numbers
1 DPB2 (2) 37/1977 = 1.9 37 – – (73), (74)
2 DPB1 (67) 1/63 = 1.6 6.5 9.1/191 = 4.8 24.5 (47)
3 DPA1 (8) 3.5/59 = 5.9 8.7 5.2/185 = 2.8 12.3 (47)
4 DNA (3) 2/204 = 1.0 3 0/547 = 0 0 M31525, M26039, X02882
5 DMA (4) 0/71 = 0 0 3/208 = 1.5 6 X62744, X76775, U04878, U04877
6 DMB (7) 0.5/60 = 0.83 2 2/177 = 1.1 5 Y14395, U00700, U31743, AF00482, U16762, U32663, X76776
7 LMP2 (3) 0.5/173 = 0.24 1 0.4/463 = 0.09 1 X62741, S75169, U01025
8 TAP1 (5) 0.3/631 = 0.05 1 1.8/1610 = 0.11 4 X57522, L21205, L21206, L21207, L21208
9 LMP7 (5) 0/172 = 0 0 0/509 = 0 0 X62598, L11045, U17496, U17497, X66401
10 TAP2 (3) 2/516 = 0.39 3 2/1350 = 0.15 3 U07844, Z22935, Z22936
11 DOB (2) 0/214 = 0 0 1.2/605 = 0.17 1 M26040, L29472
12 DQB2 (8) 1.4/201 = 0.69 3 – – M83889, M83890, M83891, M24921, M24920, M24922,
M24923, M95729
13 DQA2 (2) 21/2504 = 0.84 21 – – Z84490, M29615
14 DQB3 (2) 15/1407 = 1.1 15 – – Z84490, M26577
15 DQB1 (27) 6.2/73 = 8.6 17.5 17/212 = 8.1 42 (47)
16 DQA1 (15) 9.0/150 = 6.0 26.5 19/426 = 4.5 47.5 (47)
17 DRB1 (135) 3.6/60 = 6.0 24 12/183 = 6.5 55.5 (47)
18 DRA (2) 1/174 = 0.57 1 1.0/504 = 0.20 1 (47)
19 PBX-2 (3) 0/338 = 0 0 0.7/953 = 0.07 1 X59842, X80700, D28769
20 RAGE (2) 0.5/338 = 0.15 0.5 3.5/874 = 0.40 3.5 M91211, D28769
21 G13 (2) 2/578 = 0.35 2 3/1520 = 0.20 3 X98054, U89337
22 CYP21B (2) 5/405 = 1.23 5 3/1080 = 0.28 3 M31022, AF019413
23 C4B (2) 1/310 = 0.32 1 1/833 = 0.12 1 K02404, AF019413
24 G11 (2) 0/214 = 0 0 0/560 = 0 0 X77836, (75)
25 RD (4) 1.5/274 = 0.54 3 2.6/778 = 0.33 5 L03411, M32275, X16105, AF019413
26 Bf (2) 0/467 = 0 0 1/1350 = 0.07 1 X72875, AF0149413
27 HSP70-2 (2) 7/508 = 1.4 7 2/1410 = 0.14 2 M59830, M11717
28 TNF (3) 0/191 = 0 0 0.7/508 = 0.13 1 X01394, X02910, M10988
29 BAT1 (3) 0/211 = 0 0 0.7/639 = 0.11 1 Z37166, AF029062, A02961
30 MICB (7) 0.3/204 = 0.14 1 1.7/618 = 0.28 6 (36), (37)
31 MICA (16) 2/204 = 0.96 5 7.2/618 = 1.2 22 (38), (39)
32 B (91) 9.7/289 = 3.4 45.4 25/796 = 3.2 91.5 (48)
33 C (35) 8.3/281 = 3.0 46.8 18/779 = 2.3 89.8 (48)
34 SC1 (2) 0/301 = 0 0 8/767 = 1.0 8 S53374, U25826
35 E (5) 0.5/127 = 0.43 3 1.8/346 = 0.51 6 (76)
36 J (3) 7.5/1046 = 0.72 11 – – (76)
37 A (50) 10/261 = 3.8 38 25/758 = 3.3 90.5 (48)
38 H (6) 18.7/1091 = 1.71 45 – – (76)
39 G (6) 1.1/195 = 0.56 5 1.3/522 = 0.25 4 (76)
The K and L are the average number of nucleotide differences and the average number of sites in all pairwise comparisons,
respectively, and the subscripts stand for silent and non-silent nucleotide substitutions.
Figure 2. The observed silent nucleotide differences at
individual loci are plotted against the physical map distance
from the nearest highly polymorphic HLA locus. The solid
and dotted curves are computed by the theoretical formulas
(9, 45) under the assumption of 1 cM = 1 Mb and 0.1 cM
= 1 Mb, respectively. It is assumed that selection intensity
is 2% and the number of breeding individuals is 10
5and 10
4before and after 50,000 generations ago. The values of the
per-site neutral mutation rate and the non-silent
substitutions rate per PBR per generation are given in text.
The discrepancy from the 1 cM = 1 Mb curve is caused by
MICA, J, H and G or by DPB2, DQB3, DNA, DQA2 and
DQB2.
The average p
svalue over five loci (SC1, E, J, H
and G) in the class I region is 0.98% which is greater than
the standard (P < 0.01). The SC1 gene is thought to control
the cell cycle, while the E and G genes encode for class Ib
molecules. The relatively high p
svalue in the class I region
is largely attributable to processed pseudogene HLA-H (not
to be confused with the renamed gene (HFE) that is
responsible for hereditary hemochromatosis (43), more than
3 Mb telomeric from the HLA). Compared with the case of
HLA-J which is also a pseudogene, both p
s= 1.7% and S
s=
43 over 1,067 silent sites at the HLA-H locus appear to be
too large. However, there is evidence that a telomeric region
of the HLA-A locus is somewhat suppressed in
recombination (H. Inoko, personal communication).
Although the reason is poorly understood, the reduced
recombination may well account for the elevated
polymorphism at the HLA-H locus as well as the slightly
increased polymorphism at the HLA-G locus.
4. INTERGENIC RECOMBINATION
In order to study the relationships between
silent differences (p
s) and recombination rates (c), each p
svalue is plotted against the physical map distance (44 - 46)
which is measured from the nearest highly polymorphic
HLA locus (figure 2). As expected, the longer the distance,
the smaller the p
svalue. The following theoretical model (9,
47, 48) is used to examine the relationships more
quantitatively. The model assumes that the neutral region
and the PBR encoding exon are recombined with rate c per
generation. The model also assumes that any PBR non-
silent nucleotide substitution always generates a new allelic
lineage which, together with all other pre-existing alleles, is
subjected to random genetic drift and balancing selection.
The mutation rate per PBR is assumed to be 2.7 × 10⁻⁶ for
class I and 0.8 × 10⁻⁶ for class II locus owing to the
difference in the number of non-silent sites (25). The per-
site mutation rate is 2 × 10⁻⁸ per generation and the
generation time is 20 years. If a population has not been
demographically stable over time, N
eis dependent of a time
period during which polymorphism has been generated (9).
This time period for neutral polymorphism is relatively
short, while that for HLA polymorphism is relatively long.
The estimate of N
e= 104 is made based on the short-lived
neutral polymorphism, whereas that of N
e= 105 is made
based on the enhanced polymorphism due to long-lived
HLA allelic lineages (7). The reduction in the effective
population size might have begun when Homo erectus first
migrated from Africa about one million years ago (7, 9, 48),
although there are alternatives. Figure 2 also depicts the
expected level of linked neutral polymorphism. The indirect
effect of balancing selection is remarkable in linked neutral
regions with c < 0.01%, or only within 10 kb if 1 cM =
1Mb is postulated (13). Thus, in order to account for large
p
svalues by linkage, tightly linked regions must be
considered. The relatively large p
svalue at DPB2, DQB3,
DNA, DQA2 and DQB2 locus as well as that at MICA, J,
H and G locus requires that the c value is smaller than
0.01% (figure 2). Since these loci are located about 25 kb to
more than 200 kb apart from the nearest polymorphic
MHC locus (44), recombination may be rarer than expected
from 1 cM = 1 Mb. One can claim that proper alignment
necessary for recombination between the homologous
chromosomes is hindered by highly diversified loci (49).
However, the small p
svalue at the remaining loci is by and
large consistent with the postulate of 1 cM = 1Mb. In
addition, a reduction of silent polymorphism in non-PBR
coding exons at classical MHC loci indicated that
recombination is not fully suppressed even within a locus
(9).
5. DRB1 ALLELIC LINEAGES AND DISEASE
ASSOCIATION
Long lasting allelic lineages at classical MHC loci
permit us to glean insight into molecular mechanisms of the
polymorphism, in particular roles of intra-exonic sequence
exchanges (recombination or gene conversion). The silent
differences within (p
w) and between (p
b) allelic lineages are
particularly useful for this purpose. Without sequence
exchanges among allelic lineages, the silent differences
within lineages should be much smaller than those between
lineages (figure 3). However, in the absence of information
on associations between alleles at a locus and the nearby
MHC locus, figure 3 cannot be used. An exception is
MHC loci themselves at which the linkage relationships
between non-PBR coding exons or introns and the PBR
coding exon are certain in some data sets (50, 51).
Both p
wand p
bvalues depend critically on the
definition of allelic lineages. In addition to serological
methods, sequence motifs as well as phylogenetic analyses
can provide reasonable classifications of MHC allelic
lineages (9). As an example, we take a close look at
Figure 3. The silent nucleotide differences within (p
w)
and between (p
b