T itle
Pathological E ndogenous α
-S ynuclein A ccumulation in
Oligodendrocyte Precursor C ells Potentially Induces Inclusions
in Multiple S ystem A trophy
A uthor(s )
K aji, S eiji; Maki, T akakuni; K inoshita, Hisanori; Uemura,
Norihito; A yaki, T akashi; K awamoto, Y asuhiro; F uruta,
T akahiro; Urushitani, Makoto; Hasegawa, Masato; K inoshita,
Y usuke; Ono, Y uichi; Mao, X iaobo; Quach, T ran H.; Iwai,
K azuhiro; D awson, V alina L .; D awson, T ed M.; T akahashi,
R yosuke
C itation
S tem C ell R eports (2018)
Is s ue D ate
2018-01-11
UR L
http://hdl.handle.net/2433/228877
R ig ht
©
2017 T he A uthor(s). T his is an open access article under the
C C B Y -NC -ND license
(http://creativecommons.org/licenses/by-nc-nd/4.0/).
T ype
J ournal A rticle
T extvers ion
publisher
Stem Cell Reports
Repor t
Pathological Endogenous
a
-Synuclein Accumulation in Oligodendrocyte
Precursor Cells Potentially Induces Inclusions in Multiple System Atrophy
Seiji Kaji,1Takakuni Maki,1,*Hisanori Kinoshita,1Norihito Uemura,1Takashi Ayaki,1Yasuhiro Kawamoto,1,2 Takahiro Furuta,3Makoto Urushitani,4Masato Hasegawa,5Yusuke Kinoshita,6Yuichi Ono,6Xiaobo Mao,7 Tran H. Quach,7Kazuhiro Iwai,8Valina L. Dawson,7,9,10,12Ted M. Dawson,7,10,11,12and Ryosuke Takahashi1,*
1Department of Neurology, Graduate School of Medicine, Kyoto University, 54 Shogoin-Kawahara-cho, Sakyo-ku, 606-8397 Kyoto, Japan 2Department of Neurology, Rakusai Shimizu Hospital, Nishikyo-ku, 610-1106 Kyoto, Japan
3Department of Morphological Brain Science, Graduate School of Medicine, Kyoto University, Kyoto, Japan 4Department of Neurology, Shiga University of Medical Science, Otsu, 520-2192 Shiga, Japan
5Department of Dementia and Higher Brain Function, Tokyo Metropolitan Institute of Medical Science, Setagaya-ku, 156-8506 Tokyo, Japan 6Department of Developmental Neurobiology, KAN Research Institute, Inc., Kobe, 650-0047 Hyogo, Japan
7Neuroregeneration and Stem Cell Program, Institute for Cell Engineering and the Department of Neurology, Johns Hopkins University School of Medicine, Baltimore, MD 21205, USA
8Department of Molecular and Cellular Physiology, Graduate School of Medicine, Kyoto University, Kyoto, Japan 9Department of Physiology, Johns Hopkins University School of Medicine, Baltimore, MD 21205, USA
10Solomon H. Snyder Department of Neuroscience, Johns Hopkins University School of Medicine, Baltimore, MD 21205, USA 11Department of Pharmacology & Molecular Sciences, Johns Hopkins University School of Medicine, Baltimore, MD 21205, USA 12Adrienne Helis Malvin Medical Research Foundation, New Orleans, LA 70130-2685, USA
*Correspondence:[email protected](T.M.),[email protected](R.T.) https://doi.org/10.1016/j.stemcr.2017.12.001
SUMMARY
Glial cytoplasmic inclusions (GCIs), commonly observed asa-synuclein (a-syn)-positive aggregates within oligodendrocytes, are the pathological hallmark of multiple system atrophy. The origin ofa-syn in GCIs is uncertain; there is little evidence of endogenous
a-syn expression in oligodendrocyte lineage cells, oligodendrocyte precursor cells (OPCs), and mature oligodendrocytes (OLGs). Here, based onin vitroanalysis using primary rat cell cultures, we elucidated that preformed fibrils (PFFs) generated from recombinant human
a-syn trigger multimerization and an upsurge of endogenousa-syn in OPCs, which is attributable to insufficient autophagic proteolysis. RNA-seq analysis of OPCs revealed thata-syn PFFs interfered with the expression of proteins associated with neuromodulation and mye-lination. Furthermore, we detected cytoplasmica-syn inclusions in OLGs through differentiation of OPCs pre-incubated with PFFs. Over-all, our findings suggest the possibility of endogenousa-syn accumulation in OPCs that contributes to GCI formation and perturbation of neuronal/glial support in multiple system atrophy brains.
INTRODUCTION
Multiple system atrophy (MSA) is an a-synucleinopathy characterized by a relentless worsening of motor and non-motor symptoms during a typical time frame of 6–10 years. Glial cytoplasmic inclusions (GCIs) in oligodendrocytes (OLGs), which consist of a-synuclein (a-syn)-positive filamentous components, are the hallmark for a definitive neuropathological diagnosis of MSA. Given that the emergence of GCIs occurs prior to neuronal loss, it is likely that a primary oligodendroglial event is the root of the disease pathology in MSA (Wenning et al., 2008).
Sincea-syn is considered to be expressed almost exclu-sively in neurons, the origin of thea-syn that composes GCIs in oligodendrocytes has been enigmatic. Recent re-ports have suggested the existence of endogenousa-syn in oligodendrocyte lineage cells, emphasizing the patho-logical importance of endogenousa-syn as the source of the misfoldeda-syn in GCIs (Djelloul et al., 2015). The fi-brillary form ofa-syn contributes to prion-like propaga-tion of the misfolded structure and disease progression among bothin vitroandin vivomodels of
synucleinopa-thies (Angot et al., 2010). Considering that exogenous a-syn preformed fibrils (PFFs) seed and recruit endogenous a-syn to form insoluble aggregates in primary neurons, it is of great importance to determine if exogenous a-syn PFFs induce misfolding of endogenous a-syn in primary oligodendrocyte lineage cells (Volpicelli-Daley et al., 2011).
Oligodendrocyte lineage cells support neuronal activity not only by forming a myelin sheath to enable saltatory conduction but also by modulating axonal and neuronal homeostasis through the supply of neurotrophic factors
(Wilkins et al., 2003). Myelin-forming mature OLGs are
derived from oligodendrocyte precursor cells (OPCs). When activated in response to brain damage, OPCs prolif-erate and attempt to differentiate into mature OLGs. OPCs, which are immunoreactive to NG2 chondroitin sulfate or platelet-derived growth factor a receptor (PDGFRa), are distributed diffusely within the central nervous system and account for 5%–8% of all cells in adult brains (Levine
et al., 2001). Despite the importance of OPCs in brain
ho-meostasis, there are limited numbers of pathological inves-tigations of OPCs in MSA brains.
Stem Cell ReportsjVol. 10j1–10jFebruary 13, 2018jª2017 The Author(s). 1
This is an open access article under the CC BY-NC-ND license (http://creativecommons.org/licenses/by-nc-nd/4.0/).
(legend on next page)
2 Stem Cell ReportsjVol. 10j1–10jFebruary 13, 2018
In the present study, we provide new pathological insight into the interaction between endogenous and exogenous a-syn by using primary rat oligodendrocyte lineage cell cul-tures, and we propose the possibility of OPC involvement in the pathogenesis of MSA.
RESULTS
Oligodendrocyte Precursor Cells Containa-Syn
Aggregates in MSA Brains
We investigated whether OPCs containa-syn aggregates in MSA brains. One previous analysis revealed that a small fraction of OPCs in MSA cases showeda-syn immu-noreactivity, which was also confirmed by our postmortem investigation (May et al., 2014) (Figure S1A). The a-syn immunoreactivity in OPCs was stained with Thioflavin S, suggesting that thea-syn aggregate was misfolded. These results suggest that not only OLGs but OPCs may also containa-syn aggregates in MSA brains.
Oligodendrocyte Lineage Cells in Rat Primary Cultures Express Moderate Amounts ofa-Syn
To confirm the endogenousa-syn expression in oligoden-drocyte lineage cells, primary oligodenoligoden-drocyte lineage cell cultures were obtained from neonatal rats. Consistent with previous reports, anti-a-syn antibody immunostained endogenous a-syn within OPCs and OLGs with cyto-plasmic predominance (Figures S1B and S1C) (
Richter-Landsberg et al., 2000). Immunoblot analysis showed that
oligodendroglial endogenousa-syn expression at 4–6 days after plating was slightly greater than 20% of the neuronal a-syn expression (Figures S1D and S1E). Consistent with immunoblot analysis, quantitative real-time PCR (qPCR)
also suggested that oligodendrocyte lineage cells expressed 10%–20% of the amount of a-syn transcripts expressed in neurons (Figure S1F). Immunoblot analysis, immunocy-tochemistry, and qPCR analysis using each cell marker validated the high purity of each cell-type culture (Figures S1D and S1G–S1I, andMovies S1andS2).
Exogenousa-Syn PFFs Are Internalized into OPCs To elucidate the impact of extracellular a-syn PFFs on primary oligodendrocyte lineage cells, these cells were incubated with either recombinant human a-syn PFFs or monomer for 24 hr and immunostained with an anti-a-syn antibody. When OPCs and OLGs were incubated with a-syn PFFs, prominenta-syn immunoreactivity was observed on the cell membranes. Observation of the magni-fied images obtained by confocal microscopy enabled visu-alization of internvisu-alization ofa-syn predominantly in OPCs but not in OLGs (Figure 1A), which was also confirmed by immunoelectron microscopy showing the intracellular localization of a-syn fibrils in OPCs (Figures 1B and 1C). Meanwhile, the enhanced a-syn immunoreactivity was not found either in OPCs or OLGs exposed to an equivalent amount ofa-syn monomer (Figure S2A). The cytosolic local-ization of exogenousa-syn in OPCs was also verified by sub-cellular fractionation of these cells (Figure S2B).
Endogenousa-Syn Protein Expression in OPCs
Dramatically Increases in Response to Exogenous Recombinant Humana-Syn PFFs
To visualize the interaction between exogenous human a-syn and endogenous rata-syn in OPCs and OLGs, cells were immunostained with an anti-a-syn antibody that specifically recognizes rodent a-syn (endogenous a-syn
Figure 1. Internalization of Recombinant Humana-Syn PFFs Inducing Accumulation and Multimerization of Endogenous Rata-Syn
(A) Confocal microscopy of OPCs and OLGs incubated witha-syn PFFs (3mM) shows prominenta-syn accumulation on the cell membranes.
The magnified view of an OPC reveals intracellulara-syn immunoreactivity, which is not observed in OLGs. Each scale bar represents 10mm.
(B) Immunoelectron microscopy ofa-syn PFF (1mM)-treated OPCs reveals intracellular fibril-like structures, which are labeled with
anti-a-syn antibody (arrowheads). The antibody recognizes both rat and humana-syn. Each scale bar represents (a) 2mm, (b) 500 nm, and (c)
100 nm, respectively. (b) Dotted line indicates cell surface. N, nucleus.
(C) Immunoelectron microscopy ofa-syn PFF (1mM)-treated OLGs shows extracellularly distributed layers of fibril-like structures, which
are labeled with anti-a-syn antibody (arrowheads). The antibody recognizes both rat and humana-syn. Each scale bar represents (a) 2mm
and (b) 500 nm, respectively. (b) Dotted line indicates cell surface. N, nucleus.
(D) Confocal microscopy with human-specific (exogenous) and rat-specific (endogenous) anti-a-syn antibodies identifies the enhanced
expression of endogenousa-syn ina-syn PFF (3mM)-treated OPCs. The increase in rat-specifica-syn expression is less notable in OLGs
treated witha-syn PFFs (3mM). White arrowheads indicate locations where endogenous rat a-syn accumulation is predominantly
observed. Each scale bar represents 20mm.
(E) The magnified view ofa-syn PFF (1mM)-treated OPCs shows intracellular colocalization of exogenous human and endogenous rata-syn
(white arrowheads). The bar represents 5mm.
(F) Immunoblot analysis with a rat-specific anti-a-syn antibody reveals that 24-hr incubation witha-syn PFFs induces multimerization of
endogenous rata-syn, with a remarkable increase in the total amount of endogenous rata-syn in OPCs.
(G) Quantification of endogenous rata-syn accumulation ina-syn PFF-treated OPCs and OLGs by immunoblot analysis is illustrated. Both
total and multimer endogenous rata-syn are significantly increased in OPCs bya-syn PFF application. Mean±SEM; n = 5, respectively,
independent cultures; one-way ANOVA, *p < 0.05.
antibody) (Figure S2C). In response to incubation with exogenousa-syn PFFs, the endogenousa-syn expressions in OPCs were remarkably enhanced (Figures 1D and
S2D). The enhanced immunoreactivity of endogenous a-syn colocalized with that of exogenousa-syn in the cyto-plasm of OPCs (Figures 1E andS2B). The cytoplasmic inclu-sions immunostained with the endogenousa-syn antibody were also stained with Thioflavin S, which was exclusively observed in OPCs (Figures S2E and S2F). Immunoblot anal-ysis revealed a drastically increased amount of endogenous a-syn expression in OPCs characterized by the emergence of multimerizeda-syn as the result ofa-syn PFF application
(Figures 1F and 1G). On the other hand, there was minimal
change in the total amount of endogenous a-syn expres-sion in OLGs, as shown by both immunostaining and immunoblot analysis. Monomerica-syn did not alter the protein expression pattern of endogenousa-syn in OPCs (Figure S2G). Despite the striking evidence of inclusion for-mation in OPCs, the expression of phosphorylateda-syn was not confirmed either in immunostaining or immuno-blot analysis (Figures S2H and S2I).
Impairment of Autophagy Contributes to Endogenous
a-Syn Accumulation in OPCs
Incubation of OPCs witha-syn PFFs facilitated expression of endogenousa-syn not only in Triton-soluble fractions but also in Triton-insoluble fractions (Figure 2A). Based on the evidence of pathological a-syn expression, we then asked whether the endogenousa-syn protein increase is caused by overproduction, accompanied by increased a-syn transcripts, or by proteolytic dysfunction. qPCR of oligodendrocyte lineage cells 72 hr after application of a-syn PFFs clarified that there was no significant increase ina-syn transcripts (Figure 2B).
Subsequently, we investigated the effect of 24-hr applica-tion ofa-syn PFFs on proteolytic systems in oligodendro-cyte lineage cells. Immunoblot analysis of a-syn PFF-treated cells revealed p62 accumulation and fraction conversion of LC3-I to LC3-II in OPCs (Figures 2C and 2E), which are correlated with insufficient autophagic clearance and autophagosome accumulation, respectively.
Figure 2. Insufficient Autophagic Degradation in OPCs Trig-gered bya-Syn PFF Application
(A) Accumulation of Triton-insoluble endogenous rata-syn in OPCs
is triggered bya-syn PFF (3mM) application.
(B) Quantitative real-time PCR reveals unchangedSncaexpression
levels after 72-hr incubation of oligodendrocyte lineage cells with
3mMa-syn PFFs. Mean±SEM; n = 6, respectively, independent
cultures; paired t test. NS, not statistically significant.
(C) Immunoblot analysis with proteolytic markers discloses marked increases in p62 and LC3-II in OPCs, suggesting the induction of an
autophagic pathway due toa-syn PFF application.
(D–G) Quantification of each proteolytic marker expression in oligodendrocyte lineage cell is exhibited. (D and E) Autophagic
indicators, p62 and LC3-II/LC3-I, show increasing trends ina-syn
PFF-treated OPCs. (F) Cathepsin D protein expression is not
significantly affected bya-syn PFF application. (G) The expression
of lysine-48-linked ubiquitin chains is not affected bya-syn PFF
application. Mean±SEM; n = 4, respectively, independent cultures;
one-way ANOVA, *p < 0.05, ***p < 0.001.
4 Stem Cell ReportsjVol. 10j1–10jFebruary 13, 2018
These findings, as well as the increase of endogenous a-syn, were also observed when OPCs were incubated for 24 hr with an autophagy inhibitor, chloroquine
(Figures S3A–S3C). The interaction ofa-syn and autophagy
markers (p62, Beclin-1, and LC3) as well as the intra-lyso-somal localization ofa-syn was verified by immunostain-ing and LysoTracker probes, implyimmunostain-ing the possibility of compromised lysosomal degradation (Figures S3D and S3E). Conversely, the protein expression levels of p62 and LC3-II in OLGs treated with a-syn PFFs only slightly increased, which did not reach statistical significance.
Cathepsin D is one of the lysosomal enzymes that are known to regulate cell homeostasis by mediating the degra-dation of misfolded protein aggregates delivered to lyso-somes via autophagy or endocytosis (Bae et al., 2015). Although the a-syn PFF application did not affect the cathepsin D protein expression levels in OPCs or OLGs, the enzymatic activity analysis suggested the reduced cathepsin D activity in a-syn PFF-treated OPCs (Figures 2C, 2F, andS3F).
Lysine-48-linked polyubiquitin chains are well estab-lished as the signal for 26S proteasomal degradation (Grice
and Nathan, 2016). Both the OPCs and OLGs showed no
appreciable increase in lysine-48-linked ubiquitin chains
(Figures 2C and 2G). Taken together, these results indicate
thata-syn PFFs impair autophagy more severely in OPCs compared with OLGs, leading to the accumulation of endogenousa-syn proteins.
a-Syn PFFs Interfere with mRNA Expression Related to
Myelination and Neuronal Support in Oligodendrocyte Precursor Cells
Media lactate dehydrogenase (LDH) and water-soluble tetrazolium (WST) assays revealed thata-syn PFFs did not cause acute cell death after 24-hr exposure (Figures S3G and S3H). Therefore, we assessed the functional influence ofa-syn PFF application on OPCs.
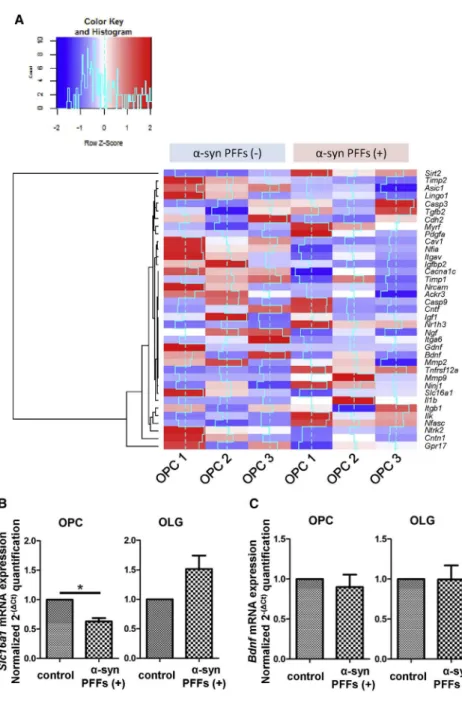
RNA sequencing (RNA-seq) analysis in OPCs revealed remarkable alterations in mRNA profiles associated with OLG maturation and neuromodulation after 72-hra-syn PFF application (Figure 3A). As for the gene expression involved in oligodendrocyte maturation, a-syn PFF application to OPCs suppressed the gene expressions of myelination-promoting factors such as Ackr3 (encoding CXCR-7) and Cntn1 (encoding Contactin 1), while increasing those of myelination-inhibiting factors such as Sirt2 (encoding sirtuin 2) and Il1b (interleukin 1b). Among the neurotrophic factors that regulate neurodegen-erative disease pathology, monocarboxylate transporter 1 (MCT1) encoded by Slc16a1, which mediates neuronal death through the release of lactate, and brain-derived neu-rotrophic factor (BDNF) showed a tendency to decrease (Lee et al., 2012). Therefore, we verified the alteration of
mRNA expression levels of Slc16a1and Bdnf(Figures 3B and 3C) as well as those of glial cell-derived neurotrophic factor (Gdnf) and insulin-like growth factor-1 (Igf1) by qPCR (Figures S3I and S3J). Interestingly, the mRNA expres-sion level ofSlc16a1was significantly suppressed, whereas those ofBdnfandGdnfwere unchanged. The perturbation of these neurotrophic factors induced by extracellular a-syn PFFs was more severe in OPCs than in OLGs, possibly reflecting the difference ofa-syn internalization and sus-ceptibility against seeding. Alterations of mRNA expression levels were observed in various profiles associated with pro-teolysis and protein trafficking (Figure S3K), phenotypic markers (Figure S3L), and risk genes for familial Parkinson’s disease and MSA (Figure S3M). The results and interpreta-tion of RNA-seq analysis regarding possible endocytic players fora-syn PFF uptake in OPCs are described in the
Supplemental Information.
OPCs Pre-incubated with Recombinant Humana-Syn
PFFs Differentiate into Mature OLGs with Endogenous
a-Syn-Positive Inclusions
To determine if the endogenous a-syn accumulation in OPCs remains even after differentiation into mature OLGs, we tried to differentiatea-syn PFFs-treated OPCs ac-cording to the procedure shown inFigure 4A. Immuno-staining revealeda-syn aggregates in differentiated OLGs, which were also immunoreactive to an endogenousa-syn antibody (Figures 4B–4D). Immunoelectron microscopy showed the intracellular existence of fibrillar a-syn (
Fig-ure S4A). An anti-phosphorylateda-syn antibody detected
vague immunoreactivity merged with a-syn aggregates through immunostaining, nevertheless the immunoreac-tivity was not detectable with immunoblot analysis (
Fig-ures S4B and S4C). Pre-incubation with a-syn PFFs also
caused a reduction in myelin-associated proteins, such as myelin basic protein (MBP) and tubulin polymerization promoting protein (TPPP/p25a) (Figures 4E, S4D, and S4E). The decrease of these OLG-specific markers was accompanied with an increase in the protein expression levels of PDGFRaand a decreasing trend of Mbp mRNA expression levels, suggesting insufficient differentiation as a result ofa-syn PFF application (Figures S4F–S4I).
In order to delineate the functional consequence induced by a-syn PFF application before maturation, we focused on the neuro-supportive function of conditioned medium from OLGs (Figures 4F–4I). The equivalent me-dium kept under the same conditions in culture flasks without cells was used as control medium. Generally, when primary neurons are incubated with full-medium change, the survival of neurons is impaired compared with half-medium change. The conditioned medium from our OLG culture promoted the survival of primary neurons even with full-medium change. Notably, this
neuro-supportive effect was suppressed when OLGs were differentiated from OPCs pretreated witha-syn PFFs.
DISCUSSION
The existence of endogenousa-syn in primary oligoden-droglial cell culture has been previously reported by
Richter-Landsberg et al. (2000). On the other hand, a
previ-ous report ofin situhybridization in GCI-rich regions re-vealed no increase in a-syn mRNA expression in MSA brains compared with controls (Miller et al., 2005). The
in vitro findings of endogenousa-syn accumulation as a
reflection of autophagic impairment in oligodendrocyte lineage cells in our study (Figures 1D–1G) are in keeping with both of the previous studies and suggested the possi-bility that endogenous a-syn in oligodendrocyte lineage cells per se contributes to the formation ofa-syn aggregates in MSA.
Macroautophagy is particularly important for patholog-icala-syn clearance, as it can degrade insoluble or aggre-gated forms of proteins (Konno et al., 2012). In fact, GCIs in MSA brains are immunoreactive to autophagic markers, such as LC-3 and p62 (Schwarz et al., 2012). In addition, the downregulation of a lysosomal enzyme, cathepsin D, is associated with intracellular a-syn accumulation in
Figure 3. RNA-Seq and qPCR Analysis for mRNA Expression Alteration in a-Syn
PFF-treated OPCs
(A) RNA-seq analysis ofa-syn PFF-treated
OPCs discloses a dramatic shift in the expression of transcripts related to neuro-modulation, myelination, and cell survival. Each pair of OPC culture samples (OPC1, OPC2, and OPC3) was allocated for the two
groups with and withouta-syn PFF (3mM)
application.
(B and C) qPCR elucidates reduced
mRNA expression ofSlc16a1 in a-syn PFF
(3mM)-treated OPCs, whereas Bdnf mRNA
expression is not significantly affected.
Mean±SEM; n = 6, respectively;
indepen-dent cultures; paired t test, *p < 0.05.
6 Stem Cell ReportsjVol. 10j1–10jFebruary 13, 2018
A
B
E
D C
Pe
rc
e
n
ta
g
e
o
f
O
L
G
s
w
ith
-s
y
n
/
T
h
io
fl
a
v
in
S
d
o
u
b
le
p
o
s
iti
v
e
c
y
to
p
la
s
m
ic
i
n
c
lu
s
io
n
s
F
G H I
W
S
T
a
s
s
a
y
MA
P
2
a
re
a
N
e
u
N
+
c
e
ll
s
(legend on next page)
SH-SY5Y cells and myelin degeneration in knockout mice (Mutka et al., 2010; Bae et al., 2015). The lysosomal locali-zation ofa-syn, as well as the altered cathepsin D activity in OPCs of our study, emphasizes the pathological relevance of insufficient lysosomal degradation fora-syn accumula-tion and disease progression in MSA patients (Figures S3E and S3F).
Loss of neurotrophic support from oligodendrocytes in MSA has been postulated as the mechanism for neurodegeneration secondary to the primary glial pathol-ogy (Fellner et al., 2011). The RNA-seq and qPCR analysis corroborated that OPCs express comparable amounts of transcripts related to neuro-supportive factors, such as MCT1, BDNF, and GDNF (Figures S1H and 3). The lack of metabolic support for neurons by oligodendroglial MCT-1, a key player for the shuttling of lactate, results in neuronal death, which potentially contributes to neuronal degeneration in MSA (Lee et al., 2012). Furthermore, the OLGs containing a-syn aggregates in our experiments showed decreased expression levels of myelin-associated proteins and compromised neuro-supportive function via soluble factors (Figures 4E–4I). These findings are consis-tent with a previous investigation that detected myelin loss and neurodegeneration in the brains of transgenic MSA mice overexpressing a-syn in OLGs (Shults et al., 2005).
A limitation of the present study is that primary oligo-dendrocyte lineage cell cultures can only be used in exper-iments with relatively short incubation times due to the short survival time of these cells. Thus, we conducted the studies with higher concentrations of recombinant human a-syn PFFs compared with the concentrations used in the previous study of primary neurons (Volpicelli-Daley et al., 2011). In consequence, our study could not clearly detect phosphorylateda-syn immunoreactivity in oligodendrog-lial cells, even with 7 days of incubation aftera-syn PFF
administration (Figures S2H, S2I,S4B, and S4C). Consid-ering that at least 7–10 days of the incubation period is required for neuronala-syn to be phosphorylated, a longer observation period is warranted to confirm phosphoryla-tion of a-syn in oligodendrocyte lineage cells with their modest basal a-syn expression compared with neurons
(Volpicelli-Daley et al., 2011). As another limitation of
the present study, we administereda-syn PFFs to cultured OPCs and OLGs to induce endogenousa-syn aggregation, since this is the standard protocol fora-syn aggregate for-mation in neurons (Volpicelli-Daley et al., 2011). However, the primary pathogenesis by which oligodendrocytes spe-cifically trigger the production of misfoldeda-syn in MSA is yet to be elucidated.
Overall,in vitroa-syn PFF administration in our primary cultures recapitulated a critical aspect of MSA pathogenesis and thus represents a practical model system. We suggest that OPCs potentially play a role in MSA pathology through internalization of extracellulara-syn and accumu-lation of endogenous a-syn, and that manipulation of a-syn expression in OPCs may serve as a therapeutic strat-egy against GCI formation.
EXPERIMENTAL PROCEDURES
Study Approval
Autopsied human brains were obtained from Kyoto University Hospital through a process approved by an institutional research committee. All animal procedures were performed according to the guidelines of the Animal Use and Care Committee of Kyoto University and of the Institute of Biomedical Research and Innovation.
Primary Oligodendrocyte Lineage Cell Cultures
Mixed glial cell cultures were obtained from cerebral cortices of 1- to 2-day-old Sprague-Dawley rats and prepared as previously
Figure 4. Cytoplasmica-Syn Inclusions and Impaired Neuro-supportive Function in Mature OLGs Derived through
Maturation-Induction ofa-Syn PFF-Treated OPCs
(A) Time chart of the experimental procedure is displayed. Cells are incubated witha-syn PFFs (1 or 3mM) for 24 hr followed by complete
removal of extracellulara-syn PFFs and initiation of 7 days of maturation.
(B) Cytoplasmica-syn inclusion is confirmed by confocal microscopy. The scale bar represents 20mm.
(C) The cytoplasmic inclusions contain endogenous rata-syn. The inclusions are also labeled with Thioflavin S staining. The scale bar
represents 20mm.
(D) Percentages of OLGs containing cytoplasmic inclusions labeled with both endogenous rata-syn and Thioflavin S are compared between
OLGs with and withouta-syn PFF (1mM) pretreatment before maturation. Mean±SEM; n = 3, respectively; independent cultures; one-way
ANOVA, **p < 0.01.
(E) Immunoblot analysis reveals reduced myelin-associated proteins, MBP and TPPP/p25a, in OLGs pretreated witha-syn PFFs before
maturation.
(F) Immunostaining of primary cortical neurons incubated with conditioned medium from OLGs reveals that reduced neuronal expressions
of MAP2 and NeuN are induced bya-syn PFF (3mM) pretreatment to OPCs before maturation. Each scale bar represents 50mm.
(G–I) Viability of primary neurons is evaluated by the quantification of (G) WST assay, (H) MAP2-positive areas, and (I) numbers of
NeuN-positive cells. Mean±SEM; n = 4, respectively; independent cultures; one-way ANOVA, *p < 0.05, **p < 0.01, ***p < 0.001.
8 Stem Cell ReportsjVol. 10j1–10jFebruary 13, 2018
described (Maki et al., 2015). Isolated OPCs were differentiated into mature OLGs by incubation with differentiation medium for 7 days.
Preparation of Recombinant Humana-Syn
Recombinant humana-syn was purified in accordance with a previously established method (Masuda-Suzukake et al., 2013). PFFs were diluted in PBS at 1mM or 3mM, sonicated several times (30–60 s in total), filtered with 0.2-mm syringe filters (Life Sciences), and diluted in medium.
Immunostainings Observed with Confocal Laser Microscopy
An Olympus Fluoview FV1000 confocal microscope was used to observe immunostaining with secondary antibodies conjugated to fluorescein isothiocyanate, Texas red, or Cy5 (1:200, Alexa Fluor 488, 594, and 647).
RNA-Seq Analysis of OPCs
Agilent SureSelect Strand Specific RNA prep kit (catalog no. G9691A) was used with 200 ng of total RNA to construct cDNA libraries.
Statistical Analysis
All quantitative data were analyzed by using GraphPad Prism 5.0.
ACCESSION NUMBERS
The GEO accession number for the full dataset of RNA-seq is GEO: GSE107582; see https://www.ncbi.nlm.nih.gov/geo/query/acc. cgi?acc=GSE107582for more information and a full list of sup-ported databases.
SUPPLEMENTAL INFORMATION
Supplemental Information includes Supplemental Experimental Procedures, four figures, one table, and two movies and can be found with this article online athttps://doi.org/10.1016/j.stemcr. 2017.12.001.
AUTHOR CONTRIBUTIONS
S.K., study design, data acquisition and analysis, and drafting the manuscript and figures; T.M., study conception and design, super-vising the preparation of primary cultures and data acquisition, and critical revision of the manuscript; H.K., N.U., and M.H., su-pervising the preparation ofa-synuclein; T.A. and W.K., histopath-ological data acquisition and analysis; T.F., supervising electron microscopic data acquisition and analysis; M.U. and K.I., study conception, data interpretation, and critical revision of the manu-script; Y.O. and Y.K., data acquisition by RNA-seq analysis; X.B.M., V.L.D., Q.T., and T.M.D., data acquisition and analysis and critical revision of the manuscript for important intellectual content; R.T., funding, supervising, and critical revision of the manuscript for important intellectual content.
ACKNOWLEDGMENTS
We thank all of our colleagues and staff at the Department of Neurology, Graduate School of Medicine, Kyoto University, including H. Yamashita, A. Kuzuya, H. Yamakado, M. Uemura, M. Hishizawa, Y. Taruno, M. Ikuno, E. Nakanishi, M. Sawamura, S. Okuda, K. Yasuda, S. Matsuzawa, Y. Hatanaka, R. Hikawa, and R. Tamano for their expert advice. We thank Dr. M. Takahashi for methodological suggestions on the immunoblot analysis. R.T. is supported by Grants-in-Aid for Scientific Research (A) (15H02540) and Grants-in-Aid for Scientific Research on Innova-tive Area Brain Environment (23111002) from the Japan Society for the Promotion of Science. T.M. is supported by Grants-in-Aid for Scientific Research (C) (16K07056) from the Ministry of Educa-tion, Culture, Sports, Science and Technology in Japan. X.B.M. is supported by NIH/NIA Johns Hopkins ADRC P50 AG05146. X.B.M., T.H.Q., V.L.D., and T.M.D. are supported by JPB and NIH/NINDS grant P50 NS38377. T.M.D. is the Leonard and Mad-lyn Abramson Professor in Neurodegenerative Diseases. X.B.M., V.L.D., and T.M.D. acknowledge the joint participation by the Adrienne Helis Malvin Medical Research Foundation through its direct engagement in the continuous active conduct of medical research in conjunction with the Johns Hopkins Hospital and the Johns Hopkins University School of Medicine and the founda-tion’s Parkinson’s Disease Program M-2014.
Received: January 17, 2017 Revised: December 2, 2017 Accepted: December 4, 2017 Published: January 11, 2018
REFERENCES
Angot, E., Steiner, J.A., Hansen, C., Li, J.Y., and Brundin, P. (2010). Are synucleinopathies prion-like disorders? Lancet Neurol. 9, 1128–1138.
Bae, E.J., Yang, N.Y., Lee, C., Kim, S., Lee, H.J., and Lee, S.J. (2015). Haploinsufficiency of cathepsin D leads to lysosomal dysfunction and promotes cell-to-cell transmission of alpha-synuclein aggre-gates. Cell Death Dis.6, e1901.
Djelloul, M., Holmqvist, S., Boza-Serrano, A., Azevedo, C., Yeung, M.S., Goldwurm, S., Frisen, J., Deierborg, T., and Roybon, L. (2015). Alpha-synuclein expression in the oligodendrocyte line-age: an in vitro and in vivo study using rodent and human models. Stem Cell Reports5, 174–184.
Fellner, L., Jellinger, K.A., Wenning, G.K., and Stefanova, N. (2011). Glial dysfunction in the pathogenesis of alpha-synucleinopathies: emerging concepts. Acta Neuropathol.121, 675–693.
Grice, G.L., and Nathan, J.A. (2016). The recognition of ubiquiti-nated proteins by the proteasome. Cell. Mol. Life Sci.73, 3497– 3506.
Konno, M., Hasegawa, T., Baba, T., Miura, E., Sugeno, N., Kikuchi, A., Fiesel, F.C., Sasaki, T., Aoki, M., Itoyama, Y., and Takeda, A. (2012). Suppression of dynamin GTPase decreases alpha-synuclein uptake by neuronal and oligodendroglial cells: a potent therapeu-tic target for synucleinopathy. Mol. Neurodegener.7, 38.
Lee, Y., Morrison, B.M., Li, Y., Lengacher, S., Farah, M.H., Hoffman, P.N., Liu, Y., Tsingalia, A., Jin, L., Zhang, P.W., et al. (2012). Oligo-dendroglia metabolically support axons and contribute to neuro-degeneration. Nature487, 443–448.
Levine, J.M., Reynolds, R., and Fawcett, J.W. (2001). The oligoden-drocyte precursor cell in health and disease. Trends Neurosci.24, 39–47.
Maki, T., Takahashi, Y., Miyamoto, N., Liang, A.C., Ihara, M., Lo, E.H., and Arai, K. (2015). Adrenomedullin promotes differentia-tion of oligodendrocyte precursor cells into myelin-basic-pro-tein expressing oligodendrocytes under pathological conditions in vitro. Stem Cell Res.15, 68–74.
Masuda-Suzukake, M., Nonaka, T., Hosokawa, M., Oikawa, T., Arai, T., Akiyama, H., Mann, D.M., and Hasegawa, M. (2013). Prion-like spreading of pathological alpha-synuclein in brain. Brain136, 1128–1138.
May, V.E., Ettle, B., Poehler, A.M., Nuber, S., Ubhi, K., Rockenstein, E., Winner, B., Wegner, M., Masliah, E., and Winkler, J. (2014). alpha-Synuclein impairs oligodendrocyte progenitor maturation in multiple system atrophy. Neurobiol. Aging35, 2357–2368. Miller, D.W., Johnson, J.M., Solano, S.M., Hollingsworth, Z.R., Standaert, D.G., and Young, A.B. (2005). Absence of alpha-syn-uclein mRNA expression in normal and multiple system atro-phy oligodendroglia. J. Neural Transm. (Vienna) 112, 1613– 1624.
Mutka, A.L., Haapanen, A., Kakela, R., Lindfors, M., Wright, A.K., Inkinen, T., Hermansson, M., Rokka, A., Corthals, G., Jauhiainen, M., et al. (2010). Murine cathepsin D deficiency is associated
with dysmyelination/myelin disruption and accumulation of cho-lesteryl esters in the brain. J. Neurochem.112, 193–203.
Richter-Landsberg, C., Gorath, M., Trojanowski, J.Q., and Lee, V.M. (2000). alpha-synuclein is developmentally expressed in cultured rat brain oligodendrocytes. J. Neurosci. Res.62, 9–14.
Schwarz, L., Goldbaum, O., Bergmann, M., Probst-Cousin, S., and Richter-Landsberg, C. (2012). Involvement of macroautophagy in multiple system atrophy and protein aggregate formation in oligo-dendrocytes. J. Mol. Neurosci.47, 256–266.
Shults, C.W., Rockenstein, E., Crews, L., Adame, A., Mante, M., Lar-rea, G., Hashimoto, M., Song, D., Iwatsubo, T., Tsuboi, K., and Mas-liah, E. (2005). Neurological and neurodegenerative alterations in a transgenic mouse model expressing human alpha-synuclein under oligodendrocyte promoter: implications for multiple system atro-phy. J. Neurosci.25, 10689–10699.
Volpicelli-Daley, L.A., Luk, K.C., Patel, T.P., Tanik, S.A., Riddle, D.M., Stieber, A., Meaney, D.F., Trojanowski, J.Q., and Lee, V.M. (2011). Exogenous alpha-synuclein fibrils induce Lewy body pa-thology leading to synaptic dysfunction and neuron death. Neuron72, 57–71.
Wenning, G.K., Stefanova, N., Jellinger, K.A., Poewe, W., and Schlossmacher, M.G. (2008). Multiple system atrophy: a primary oligodendrogliopathy. Ann. Neurol.64, 239–246.
Wilkins, A., Majed, H., Layfield, R., Compston, A., and Chandran, S. (2003). Oligodendrocytes promote neuronal survival and axonal length by distinct intracellular mechanisms: a novel role for oligodendrocyte-derived glial cell line-derived neurotrophic factor. J. Neurosci.23, 4967–4974.
10 Stem Cell ReportsjVol. 10j1–10jFebruary 13, 2018
Stem Cell Reports, Volume
10
Supplemental Information
Pathological Endogenous
a
-Synuclein Accumulation in
Oligodendro-cyte Precursor Cells Potentially Induces Inclusions in Multiple System
Atrophy
Seiji Kaji, Takakuni Maki, Hisanori Kinoshita, Norihito Uemura, Takashi Ayaki, Yasuhiro
Kawamoto,
Takahiro
Furuta,
Makoto
Urushitani,
Masato
Hasegawa,
Yusuke
Supplemental Information: Extended Experimental Procedures
Pathological Endogenous α-Synuclein Accumulation in Oligodendrocyte Precursor Cells Potentially
Induces Inclusions in Multiple System Atrophy
Authors: Seiji Kaji, MD, Takakuni Maki, MD, PhD, Hisanori Kinoshita, MD, Norihito Uemura, MD,
PhD, Takashi Ayaki, MD, PhD, Yasuhiro Kawamoto, MD, PhD, Takahiro Furuta, PhD, Makoto
Urushitani, MD, PhD, Masato Hasegawa, PhD, Yusuke Kinoshita, Yuichi Ono, PhD, Xiaobo Mao,
PhD, Tran H. Quach, Kazuhiro Iwai, MD, PhD, Valina L. Dawson, PhD, Ted M. Dawson, MD, PhD,
Ryosuke Takahashi, MD, PhD
Inventory of Supplemental Information
Extended Experimental Procedures
Supplemental Results
Supplemental Discussion
Supplemental References
Supplemental Table
Table S1, related to Figure 3
Supplemental Figures S1-S4
Figure S1, related to Figure 1
Figure S2, related to Figure 1
Figure S3, related to Figure 2 and 3
Figure S4, related to Figure 4
Supplemental Movies S1-S2
Supplemental Movie S1, related to Figure 1
Supplemental Experimental Procedures:
Histopathological Analysis of MSA Patients
For histopathological analysis, formalin-fixed, paraffin-embedded 6-μm-thick sections from the pons of
MSA patients were deparaffinized and immunostained. We applied primary antibodies for α-synuclein
(α-syn) (1:200, BD Biosciences, 610787) and NG2 (1:200, Merck Millipore, AB5320) and incubated overnight at 4℃. Subsequently to incubation with secondary antibodies (1:200, Alexa Fluor 594 and 647, A21207, A31571) for 1 hour at room temperature, sections were covered with VECTASHIELD mounting
medium (Vector Laboratories) with DAPI. For Thioflavin S assessment, sections were incubated with 20
µM Thioflavin S (Sigma Aldrich) in distilled water for 20 min at room temperature before mounting.
Images were obtained using a confocal microscopy as described below. Procedures involving the use of
human materials were performed in accordance with ethical guidelines set by Kyoto University.
Primary Cell Cultures
Primary oligodendrocyte lineage cell and other glial cell culture
OPCs were prepared as previously described (Maki et al., 2015). Briefly, cerebral cortices from 1- to 2-
day-old Sprague Dawley rats (Shimizu Laboratory Supplies Co., Ltd) were dissected, minced, and
digested. Dissociated cells were plated in poly-D-lysine-coated 75 cm2 flasks, and maintained in Dulbecco’s Modified Eagle’s Medium (DMEM) containing 20% heat-inactivated fetal bovine serum and 1% penicillin/streptomycin. After the cells were confluent (~10 days), the flasks were shaken for 1 hour
on an orbital shaker (220 rpm) at 37°C to remove microglia. The flasks were then changed to new
medium and shaken overnight (~20 hours). The medium was collected and plated on non-coated tissue
culture dishes for 1 hour at 37°C to eliminate contaminating astrocytes and microglia. The non-adherent
cells (OPCs) were collected and replated at a density of 20,000 cells/cm2 in Neurobasal (NB) medium
containing 2 mM glutamine, 1% penicillin/streptomycin, 10 ng/ml PDGF-AA, 10 ng/ml FGF-2 and 2%
B27 supplement onto poly-DL-ornithine-coated plates. Four to 6 days after plating, the OPCs were used
for the experiments. To differentiate OPCs to mature oligodendrocytes, the culture medium was switched
to DMEM containing 1% penicillin/streptomycin, 10 ng/ml CNTF, 15 nM T3 and 2% B27 supplement.
Seven days after switching medium, the mature oligodendrocytes were used for the experiments. To
obtain astrocytes, non-astrocytic cells were detached from the flasks with mixed glial cells by shaking and
removing the medium. Then, astrocytes were dissociated by tripsinization and subsequently replated at a
density of 200,000 cells/cm2.
Primary neuronal cell culture
Cortical neuronal cultures were prepared from 17-day-old Sprague Dawley rat embryos (Shimizu
Laboratory Supplies Co., Ltd) using methods described earlier (Maki et al., 2014). Briefly, cortices were
5% fetal bovine serum and 1% penicillin/streptomycin at a density of 200,000 cells/cm2. At 24-hour after
seeding, the medium was changed to NB medium containing 0.5 mM glutamine, 1%
penicillin/streptomycin and 2% B27 supplement. Cultured neurons were used for experiments 14 days
after seeding.
Preparation of Recombinant Human α-Syn PFFs
Purification was conducted in accordance with previously established method (Masuda-Suzukake et al.,
2013). Human wild-type α-syn cDNA was cloned into the bacterial expression vector pRK172.
Transformations and selection were performed using E. coli BL-21(DE3) competent cells (BioDynamics)
and ampicillin (100 μg/ml) in Luria-Bertani media. Following overnight incubation of transformed cells
in Luria-Bertani media containing ampicillin (100 μg/ml) at 37 °C, the culture was incubated for another
5 hours after 300-fold dilution and then induced with 1mM isopropyl-β-D-thiogalactopyranoside for 5
hours at 37 °C. Bacterial pellets were resuspended in high-salt buffer (1M Tris-HCl, pH 7.5, 1 mM EDTA), heated to 100 °C for 5 min, and centrifuged at 15,000 rpm for 15 min. The supernatants were
subjected to chromatography on a Q-Sepharose fast-flow column (GE healthcare) with a gradient of 0 to
0.5 M NaCl in Tris buffer. The proteins were dialyzed overnight against 50 mM Tris-HCl, 150 mM KCl,
pH 7.5 and centrifuged at 55,000 rpm at 4°C for 20 min. The supernatants were filtered with 0.2 μm
syringe filters (Life Sciences) and diluted in media for experimental use as monomeric α-syn. For PFFs
formation, proteins were incubated with constant agitation at 37°C for 3-7 days. α-Syn PFFs were diluted
in PBS at 1 µM or 3 µM, sonicated several times (30-60 seconds in total), filtered with 0.2 μm syringe
filters (Life Sciences), and diluted in media. For observation with confocal and immunoelectron
microscopy, 3 µM and 1 µM α-syn PFFs or monomer were prepared, respectively. The fractions were
assayed for the presence of the α-syn proteins by SDS-polyacrylamide gel electrophoresis (PAGE)
followed by Coomassie Blue R-250 staining. Protein concentration was determined using the
bicinchoninic acid protein assay (Thermo Fisher) and bovine serum albumin as a standard.
Incubation of OPCs with Autophagy-Modifying Drugs
To assess how altered autophagic states affect the endogenous α-syn expression and autophagic markers
in OPCs, we incubated OPCs for 24 hours with 10 μM chloroquine (Enzo Life Science), a lysosomal
inhibitor, or 500 nM rapamycin (Enzo Life Science), an autophagy inducer.
Differentiation of OPCs Pre-incubated with α-Syn PFFs
1 µM or 3 µM α-syn PFFs were added to OPCs culture when its confluency reaches 60%. Subsequently
to 24-hour incubation with α-syn PFFs, cells were washed twice with fresh medium not containing α-syn
PFFs. Medium was switched to DMEM containing 1% penicillin/streptomycin, 10 ng/ml CNTF, 15 nM
experiments.
Incubation of Primary Cortical Neurons with Conditioned Medium from OLGs
Primary cortical neuron culture was incubated for 72 hours either 1) with conditioned medium from
normal OLGs, 2) with conditioned medium from OLGs differentiated from OPCs preincubated with
α-syn PFFs (3 μM), or 3) with neuron medium incubated for 24 hours in no cell plate (serves as control). Conditioned medium was prepared from neuron medium (NB medium containing 0.5 mM glutamine, 1%
penicillin /streptomycin and 2% B27 supplement) which were incubated for 24 hours with mature OLGs
differentiated from OPCs with or without α-syn PFFs preincubation (as illustrated in Fig. 4A).
Time-Lapse Imaging
Time-lapse imaging was performed with BZ-X710 (Keyence) equipped with an incubator (37°C and 5%
CO2) by acquiring images at defined positions every 10 minutes. Images were converted to AVI files.
Cathepsin D activity Assay
The enzymatic activity of cathepsin D in OPCs was measured by cathepsin D assay kit (AnaSpec)
according to the manufacturer’s instructions. Cathepsin activity was determined by kinetic analysis,
which calculates the initial reaction velocity in relative fluorescence units (RFU) per minute. RFU change
during the first 5 minutes of the reaction was used for the calculation.
Cytotoxicity and Cell Survival Assay with Media LDH and WST Assay
Cytotoxicity was assessed by media LDH assay kit (Cytotoxicity LDH Assay Kit-WST, Dojindo). LDH is
rapidly released into the cell-culture supernatants when the plasma membrane is damaged. 100 µl of the
supernatants is incubated with the same amount of substrate mixture from the kit for 30 min. Then the
absorbance of the culture medium was measured with a microplate reader at a test wavelength of 490 nm.
Cell proliferation/survival was assessed by WST reduction assay kit (Cell Counting Kit-8, Dojindo). WST
assay is a sensitive colorimetric method to detect cell viability. The cells were incubated with 10% WST
solution for 1 hour at 37°C. The absorbance of the culture medium was measured at a wavelength of 450
nm and a reference wavelength of 630 nm.
Immunostainings with Confocal Microscopy
After washing the cells twice with PBS, the cells were fixed with 4% PFA for 15 min. After washing
twice with PBS, incubation with PBS/0.1%Tween (10 min) and blocking with 3%BSA/PBS (1 hour at room temperature), the cells were incubated with primary antibodies against PDGFRα (1:200, R&D
systems, AF1062), MBP (1:200, MBL, PD004 or 1:200, Thermo Fisher Scientific, MA1-10837), α-syn
α-syn (1:200, Thermo Fisher Scientific, 180215), TPPP/p25α (1:200, Abcam, ab92305), p62 (200:1, MBL, PM045), Beclin-1 (200:1, Santa Cruz, sc-10086), LC3 (300:1, MBL, PM036), phosphorylated α-syn
(1:200, Abcam, ab51253), MAP2 (300:1, Sigma Aldrich, M1406) and NeuN (300:1, Merck Millipore,
ABN78) at 4°C overnight. For the validation of endogenous α-syn expression in OPCs, we used
Mouse-IgG (200:1, Vector Laboratories, BA-2000) as a primary antibody for negative control.
Subsequently, after washing with PBS, they were incubated with secondary antibodies (1:200, Alexa
Fluor 488, 594 and 647, A21202, A21203, A31571, A21206, A21207, A31573, A11055, A11058,
A21447) for 1 hour at room temperature. After washing with PBS, the cells were covered with
VECTASHIELD mounting medium (Vector Laboratories) with DAPI. The cells were observed by
Olympus Fluoview FV1000 confocal microscope (Olympus). As for Thioflavin S staining, cells were
incubated with 20 µM Thioflavin S (Sigma Aldrich) in distilled water for 20 min at room temperature
before mounting. Image analysis and 3D surface reconstruction were performed by FV10-ASW software
(Olympus). Sections were imaged at 0.124 µm/pixel resolution in xy dimension and 0.4 µm in z
dimension. Regarding the use of the LysoTracker (Life technologies) probes, cells were incubated with
probe-containing medium (50 nM) for 30 minutes, before the wash with PBS and fixation. The following
immunostaining was conducted as described above.
Immunoelectron Microscopy
Immunoelectron microscopy using ultrathin cryosections was performed as described. Briefly, cells were
washed with PBS twice, immersed in 4% PFA with 0.1% glutaraldehyde at 4°C for 2 hours. Following 60
min pre-treatment with 3% BSA in PBS used for blocking agents containing 0.1 % Photo-Flo (EMS), the
samples were incubated overnight at 4°C with mouse anti-α-syn antibody (1:200, BD Biosciences,
610787). They were then incubated with Nanogold goat anti-mouse IgG conjugates (1:100, Nanoprobes,
2002) overnight at 4°C. Immunostained sections were fixed with 1% glutaraldehyde in 0.1M PB. To
better visualize the particles, the samples were reacted with Silver Enhancement Kit solutions
(Nanoprobes) The sections were then washed with 0.1 M PB, placed for 40 min in 0.1 M PB containing
1% osmium tetroxide, dehydrated, and embedded in epoxy resin (Luveak 812; Nacalai Tesque, Kyoto,
Japan). After polymerization of the resin, each tissue sample was cut into 70-nm-thick ultrathin sections
with a diamond knife on an ultramicrotome (Leica EM UC6 , Heiderberg, Germany), and mounted on
coated copper grids (Stork Veco, Eerbeek, The Netherlands). The sections were finally examined with an
electron microscope (H-7650; Hitachi, Tokyo, Japan) at 80 kV (Kameda et al., 2012).
Immunoblot Analysis
Cells were rinsed twice with PBS and collected into sample buffer containing 50% Tris-Glycine SDS buffer (Novex), 45% RIPA buffer (20 mM HEPES-KOH pH 7.4, 150 mM NaCl, 2 mM EDTA, 1%
inhibitor (Nacalai tesque) and 1% protease inhibitor (Nacalai tesque). Subsequently, samples were heated
at 95°C for 5 min, and each sample was loaded onto 5–20% or 15 % polyacrylamide gel (Wako). After
electrophoresis and transferring onto a PVDF membrane (Merck Millipore), the membranes were fixed
with 4%PFA for 30 min and blocked in Tris buffered saline with 0.1% Tween 20 (TBS-T) containing 5%
nonfat dry milk for 60 min at room temperature. Membranes were then incubated overnight at 4°C with
primary antibodies for α-syn (recognizes human and rat) (1:1000, BD Biosciences, 610787), rat α-syn (1:1000, CST, 4179S), human α-syn (1:500, Thermo Fisher Scientific, 180215), PDGFRα (1:500, R&D
systems, AF1062), MBP (1:1000, Thermo Fisher Scientific, MA1-10837), TPPP/p25α (1:500, Abcam,
ab92305) GFAP (1:5000, Thermo Fisher Scientific, 13-0300), NeuN (3000:1, Merck Millipore, ABN78),
GAPDH (500:1, Santa Cruz Biotechnology, sc-25778), HSP90α (1:5000, Abcam, ab133491), sodium
potassium ATPase (1:5000, Abcam, ab76020), p62 (500:1, MBL, PM045), LC3 (500:1, MBL, PM036),
Beclin-1 (500:1, Santa Cruz, sc-48341), cathepsin D (500:1, Santa Cruz Biotechnology, sc-6486),
lysine-48-specific ubiquitin (Merck Millipore, 1000:1, 05-1307) or anti-β-actin antibody (1:10000, Sigma
Aldrich, A5441), followed by 60 min incubation with secondary goat or donkey anti-IgG HRP antibodies
(Santa Cruz Biotechnology, NA9310V, NA9340V, NB7115, NB7357) and visualization by enhanced
chemiluminescence (Nacalai tesque). Assessment of Triton-insoluble SDS-soluble fractions was
conducted as previously described (Uemura et al., 2015). Cells were homogenized in lysis buffer
containing 1% Triton X-100 (150 mM NaCl, 50 mM Tris-HCl, 1% Triton X-100, pH 7.5) and centrifuged
at 55,000 rpm at 4°C for 30 min. The supernatants were used for Triton soluble fractions. For
SDS-soluble fractions, the pellet was rinsed with the lysis buffer, centrifuged again at 55,000 rpm at 4°C
for 30 min followed by removal of the supernatant. Subsequently, the pellet was sonicated in SDS buffer
(50 mM Tris-HCl, 2% SDS, pH 7.4) followed by centrifugation at 55,000 rpm at 4°C for 30 min. The
supernatant was boiled in sample buffer (1% SDS, 12.5% glycerol, 0.005% bromophenol blue, 2.5%
2-mercaptoethanol, 25 mM Tris-HCl, pH 6.8). Samples containing 20 μg of proteins were loaded onto
each lane of 10 % Bis-Tris gels (Novex) for both fractions. The following procedure was performed as
mentioned above. Each band was quantified with image J or ImageQuant software (GE healthcare)
(Schneider et al., 2012).
Subcellular Fractionation
Trident Membrane Protein Extraction Kit (GeneTex) was used for subcellular fractionation. Extraction of
cytosolic and plasma membrane fraction was conducted according to the manufacturer’s instructions.
RNA-seq Analysis in OPCs
Library construction and sequencing
protocol. All cDNA libraries were sequenced using an Illumina Miseq, producing 76×2 bp paired-end
reads with multiplexing.
Bioinformatics analysis
All raw sequencing reads were trimmed using Trimmomatic software (Bolger et al., 2014). Bases and QC
assessment of sequencing were generated by FastQC. QC-passed reads were aligned to the Ensembl Rnor
6.0.84 reference genome using Star v2.5.0c (Dobin et al., 2013). The abundance of transcripts was then
estimated using an Expectation-Maximization algorithm implemented in the software package Cufflnk
v2.2.1 [http://cole-trapnell-lab.github.io/cufflinks/]. Drawing heatmap of the RNA-seq data was
performed using R software and the ggplot2 package
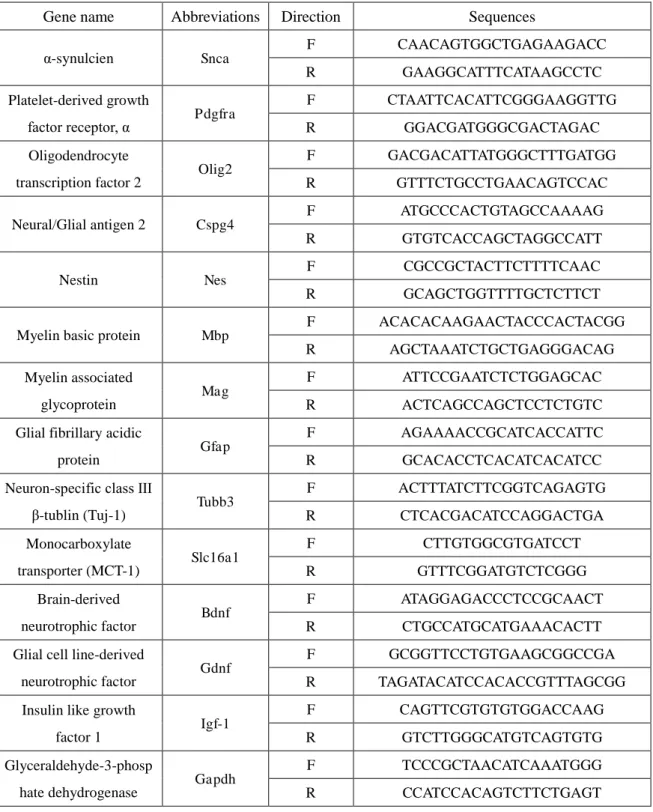
Quantitative Real-time PCR
RNA was extracted from cells with RLT lysis buffer (QIAGEN) according to the manufacturer’s
instructions. RNA concentration was measured by NanoDrop 1000 spectrometer (Thermo Scientific).
cDNA was generated with reverse transcription using the PrimeScript RT reagent kit (TaKaRa). The
amount of cDNA was quantified with real-time PCR using LightCycler 480 SYBR Green I Master
(Roche) and Roche LightCycler 480. The primer sets used in this study is listed in Table S1, thereafter.
Statistical Analysis
All quantitative data were analyzed using Prism 5.0 (Graphpad). Statistical significance was evaluated
using a paired t-test or a one-way ANOVA followed by Tukey’s honestly significant difference test for
multiple comparisons. Data are expressed as mean ± S.D. A p-value of <0.05 was considered statistically
significant.
Supplemental Results:
α-Syn PFF Receptor Membrane Proteins in Oligodendrocyte Lineage Cells
A recent report using primary neurons suggested that lymphocyte-activation gene 3 (LAG3) selectively binds to α-syn PFFs and mediates endocytosis as well as cell-to-cell transmission (Mao et al., 2016).
Unexpectedly, our RNA-seq analysis suggested that the basal gene expression levels of Lag3 in OPCs
were very low (Fig. S3K). The LAG3 protein expression in OPCs was also relatively low in immunoblot
analysis (data not shown), and the pathological function of LAG3 in oligodendrocyte lineage cells
Supplemental Discussion:
Our studies demonstrated the predominance of α-syn internalization and susceptibility against seeding in
OPCs, and indicated the possibility that OPCs are more relevant to the propagation of misfolded α-syn than OLGs. As is previously demonstrated with neurons, internalization of exogenous α-syn in
oligodendroglial cells is presumably mediated by endocytosis (Konno et al., 2012; Mao et al., 2016). In
fact, according to our RNA-seq analysis, the gene expressions of endocytic proteins such as Rab5a,
Rab7a and Rab7b in OPCs seemed to increase after α-syn PFFs application (Fig. S3K). Nevertheless, the gene expressions of possible candidate receptors for misfolded α-syn, such as clathrin and LAG3, remained basically unchanged. A variety of endocytic pathways need to be scrutinized to unravel the
seeding mechanisms lying behind our in vitro study results. In our study, however, the involvement of
endocytic pathway was difficult to confirm, due to the limited tolerability of primary OPCs against the
cytotoxicity of dynamin or clathrin inhibitor. In terms of in vivo propagation of misfolded α-syn, injection
Supplemental References
Bolger AM, Lohse M, Usadel B (2014) Trimmomatic: a flexible trimmer for Illumina
sequence data. Bioinformatics (Oxford, England) 30:2114-2120.
Dobin A, Davis CA, Schlesinger F, Drenkow J, Zaleski C, Jha S, Batut P, Chaisson M,
Gingeras TR (2013) STAR: ultrafast universal RNA-seq aligner. Bioinformatics
(Oxford, England) 29:15-21.
Kameda H, Hioki H, Tanaka YH, Tanaka T, Sohn J, Sonomura T, Furuta T, Fujiyama F,
Kaneko T (2012) Parvalbumin-producing cortical interneurons receive inhibitory
inputs on proximal portions and cortical excitatory inputs on distal dendrites. The
European journal of neuroscience 35:838-854.
Konno M, Hasegawa T, Baba T, Miura E, Sugeno N, Kikuchi A, Fiesel FC, Sasaki T, Aoki M,
Itoyama Y, Takeda A (2012) Suppression of dynamin GTPase decreases
alpha-synuclein uptake by neuronal and oligodendroglial cells: a potent therapeutic
target for synucleinopathy. Molecular neurodegeneration 7:38.
Maki T, Takahashi Y, Miyamoto N, Liang AC, Ihara M, Lo EH, Arai K (2015)
Adrenomedullin promotes differentiation of oligodendrocyte precursor cells into
myelin-basic-protein expressing oligodendrocytes under pathological conditions in
vitro. Stem cell research 15:68-74.
Maki T, Okamoto Y, Carare RO, Hase Y, Hattori Y, Hawkes CA, Saito S, Yamamoto Y,
Terasaki Y, Ishibashi-Ueda H, Taguchi A, Takahashi R, Miyakawa T, Kalaria RN, Lo
EH, Arai K, Ihara M (2014) Phosphodiesterase III inhibitor promotes drainage of
cerebrovascular beta-amyloid. Annals of clinical and translational neurology
1:519-533.
Mao X et al. (2016) Pathological alpha-synuclein transmission initiated by binding
lymphocyte-activation gene 3. Science (New York, NY) 353.
Masuda-Suzukake M, Nonaka T, Hosokawa M, Oikawa T, Arai T, Akiyama H, Mann DM,
Hasegawa M (2013) Prion-like spreading of pathological alpha-synuclein in brain.
Brain : a journal of neurology 136:1128-1138.
Schneider CA, Rasband WS, Eliceiri KW (2012) NIH Image to ImageJ: 25 years of image
analysis. Nature methods 9:671-675.
Uemura N, Koike M, Ansai S, Kinoshita M, Ishikawa-Fujiwara T, Matsui H, Naruse K,
Sakamoto N, Uchiyama Y, Todo T, Takeda S, Yamakado H, Takahashi R (2015)
Viable neuronopathic Gaucher disease model in Medaka (Oryzias latipes) displays
Table S1 Table of Primers Used in This Study
Gene name Abbreviations Direction Sequences
α-synulcien Snca
F CAACAGTGGCTGAGAAGACC
R GAAGGCATTTCATAAGCCTC
Platelet-derived growth
factor receptor, α Pdgfra
F CTAATTCACATTCGGGAAGGTTG
R GGACGATGGGCGACTAGAC
Oligodendrocyte
transcription factor 2 Olig2
F GACGACATTATGGGCTTTGATGG
R GTTTCTGCCTGAACAGTCCAC
Neural/Glial antigen 2 Cspg4
F ATGCCCACTGTAGCCAAAAG
R GTGTCACCAGCTAGGCCATT
Nestin Nes
F CGCCGCTACTTCTTTTCAAC
R GCAGCTGGTTTTGCTCTTCT
Myelin basic protein Mbp
F ACACACAAGAACTACCCACTACGG
R AGCTAAATCTGCTGAGGGACAG
Myelin associated
glycoprotein Mag
F ATTCCGAATCTCTGGAGCAC
R ACTCAGCCAGCTCCTCTGTC
Glial fibrillary acidic
protein Gfap
F AGAAAACCGCATCACCATTC
R GCACACCTCACATCACATCC
Neuron-specific class Ⅲ
β-tublin (Tuj-1) Tubb3
F ACTTTATCTTCGGTCAGAGTG
R CTCACGACATCCAGGACTGA
Monocarboxylate
transporter (MCT-1) Slc16a1
F CTTGTGGCGTGATCCT
R GTTTCGGATGTCTCGGG
Brain-derived
neurotrophic factor Bdnf
F ATAGGAGACCCTCCGCAACT
R CTGCCATGCATGAAACACTT
Glial cell line-derived
neurotrophic factor Gdnf
F GCGGTTCCTGTGAAGCGGCCGA
R TAGATACATCCACACCGTTTAGCGG
Insulin like growth
factor 1
Igf-1
F CAGTTCGTGTGTGGACCAAG
R GTCTTGGGCATGTCAGTGTG
Glyceraldehyde-3-phosp
hate dehydrogenase Gapdh
F TCCCGCTAACATCAAATGGG
R CCATCCACAGTCTTCTGAGT
B
OPCPDGFRα + DAPI α-syn Merge
OLG
MBP + DAPI α-syn Merge
D
E
G
S nca m R N A e x pre s s ion * *H
A
* * * α -s y n / β -a c ti n prot e in e x pre s s ion (% of neuron)Supplemental Figure S1
NG2 + DAPI Thioflavin S NG2 + Thioflavin S + DAPI α-syn + DAPI
α-syn
β-actin
PDGFRα
MBP
GFAP
OPC OLG Astrocyte Neuron
TPPP/p25α 43 (kDa) 17 55 150 28 28
NeuN 55
I
α-syn
PDGFRα + DAPI
PDGFRα + DAPI Ms-IgG
(negative control)
C
F
*** *** PD GF Rα G F A P N e u N M e rg e + D A P I
*
*
*
*
*
*
*
*
Pdgfra Olig2 Cspg4 Nes Mbp Mag
Figure S1 Identification of α-Syn Accumulation in OPCs of an MSA Brain, and In Vitroα-Syn
Expression in Primary Oligodendrocyte Lineage Cell Culture
MSA Brain
(A)The NG2+ OPC contains Thioflavin S-immunopositive aggregates, which are immunoreactive to α-syn in the pons of an MSA patient. The images were acquired by confocal microscopy. The white asterisks indicate erythrocytes. The scale bar represents 10µm.
Primary Oligodendrocyte Lineage Cells
(B) Confocal microscopy reveals α-syn immunoreactivity in both the cytoplasm of OPCs and OLGs.
The scale bars represent 20 µm.
(C) The α-syn immunoreactivity in OPCs is guaranteed by validating the difference between
immunostaining results with mouse-IgG and anti-α-syn antibody (mouse-derived). The scale
bars represent 20 µm.
(D)Immunoblot analysis with an anti-α-syn antibody and antibodies against each cell-type marker
illustrates α-syn expression in oligodendrocyte lineage cells as well as sufficiently high cell
purity of each primary culture.
(E) Quantification of α-syn expression in each cell type by immunoblot analysis verifies the
appreciable levels of α-syn protein expressions in oligodendrocyte lineage cells. Relative α-syn
expressions in glial cells with respect to that in neurons are illustrated. Mean±SEM; n=3,
respectively; independent cultures; one-way ANOVA, *p<0.05 (compared with neuronal
expression).
(F) Quantitative real-time PCR analysis confirms the Snca mRNA expression in each cell-type
culture. Mean±SEM; n=6 for OPCs and OLGs, n=3 for astrocytes and neurons; independent
cultures; one-way ANOVA, *p<0.05 (compared with neuronal expression).
(G)The purity of OPC culture is validated by immunostaining using antibodies against PDGFRα,
GFAP, and NeuN. The scale bar represents 100µm. Cell numbers per each ×175 magnified
visual field were quantified. Mean±SEM; n=3, respectively; one-way ANOVA, ***p<0.001.
(H)Quantitative real-time PCR shows each cell marker transcript and neuromodulating factors.
Mean±SEM; n=6 for OPCs and OLGs, n=3 for astrocytes and neurons, independent cultures.
P=0.002 P e rc e nt a ge of c e ll s w it h ra t α -s y n / T hi of la v in S doub le posi ti v e c y topl a s m ic i nclu s ions
C
F
E
Supplemental Figure S2
α-syn +PDGFRα + DAPI
PDGFRα + DAPI
α-syn
MBP + DAPI
α-syn
α-syn + DAPI
α-syn + DAPI α-syn +MBP + DAPI
O P C O LG 25 15 50 37 75 100 20 (kDa)
*
* Indicates non-specific bands
37 β-actin Ph os ph or yl at ed α -s y n
Days from α-syn PFFs
application 1 1 2 3 7 7
α-syn PFFs
concentration (µM) 0 3 3 3 3 0
25 15 50 37 75 100 150 20 37 (kDa) β-actin R at α -s y n
α-syn concentration (µM)
applied to OPCs PFFs
monomer -
- 1 - - 1 3 - - 3 *
* Indicates non-specific bands (kDa)
Neuron
36
17
β-actin
α-syn PFFs
concentration (μM)
0 1 3
R a t α -s y n 36 17 H u m a n α -s y n 43 28 1 In culture medium In buffer No cell P h o s p h o ry lat e d α -s y n + D A P I
24 hrs 48 hrs 72 hrs 7 days
Incubation period after extracellular α-syn PFFs application
Rat α-sy
n Hum a n α -s y n Rat + h u m a n α -s y n HSP90α Sodium Potassium ATPase
α-syn PFFs
OPC OLG
+ - + - - - + + 15 37 37 37 100 100 (kDa) 20 10 15 20 10 15 20 10
C M C M C M C M
A
B
G
H
I
Rat α-syn PDGFRα + DAPI Merge
O
P
C
MBP + DAPI
Rat α-syn Merge
O
LG
D
Rat α-syn +
PDGFRα + DAPI
Thioflavin S Rat α-syn Thioflavin SRat α-syn + + DAPI
Rat α-syn +
MBP + DAPI
Thioflavin S Rat α-syn Thioflavin SRat α-syn + + DAPI
O
P
C
O
LG
Rat α-syn
Thioflavin S PDGFRα + DAPI PDGFRα + Rat α-syn + DAPI
Rat α-syn
Figure S2 Characterization of Cytoplasmic Inclusions in Oligodendroglial Cells; Extracellular
α-Syn PFFs Trigger the Aggregation of Endogenous Rat α-Syn Predominantly in OPCs
(A)Confocal microscopy of OPCs and OLGs incubated with recombinant human α-syn monomer (3
µM) shows no evident cytoplasmic α-syn accumulation. The primary antibody used for the
immunostaining recognizes both exogenous human and endogenous rat α-syn. Each scale bar
represents 10 µm.
(B)Subcellular fractionation of OPCs and OLGs shows cytosolic accumulation of endogenous rat
and exogenous human α-syn in OPCs in response to 24-hour incubation with recombinant
human α-syn pre-formed fibrils (α-syn PFFs). Dimerization of endogenous rat α-syn is also
observed in the cytosolic fraction in OPCs. C = cytoplasmic fraction; M = plasma membrane
fraction.
(C) Immunoblot analysis of primary rat neurons verifies the specific detection of endogenous α-syn
by the rat-specific anti-α-syn antibody. The far right lane represents 1 μM of α-syn PFFs without
cell lysates, which is recognized only with human-specific anti-α-syn antibody guaranteeing the
specificity of each antibody. Endogenous rat α-syn in neurons is also multimerized by 24-hour
incubation with α-syn PFFs.
(D)Enhanced immunoreactivity of endogenous rat α-syn is observed predominantly in α-syn
PFFs-treated OPCs labeled with PDGFRα. OLGs are labeled with MBP. The scale bar
represents 20 µm.
(E) Magnified views of α-syn PFFs-treated oligodendroglial cells by confocal microscopy reveal
Thioflavin S-positive inclusions extensively observed in OPCs, but not in OLGs. Each
magnified oligodendroglial cell corresponds to the cells surrounded by the dotted yellow lines.
Each scale bar represents 20 µm.
(F) Percentages of cells containing endogenous rat α-syn/Thioflavin S double-positive inclusions
are quantified in OPC and OLG culture. The intracellular localization of each inclusion is
confirmed by each cell marker, PDGFRα or MBP. Mean±SEM; n=3, respectively; independent
cultures; one-way ANOVA.
(G)Immunoblot analysis of OPCs incubated with monomeric or fibrillar recombinant human α-syn
shows different response of endogenous rat α-syn expressions. Multimerization is not observed
with the application of monomeric α-syn.
(H) (I) Phosphorylated α-syn is not detected within a timeframe of 7 days after α-syn PFFs (3 µM)