A uthor(s )
Y amazaki, Hideo; Ishida, Masanobu; Hinokio, R yoichi;
Y amashiki, Y osuke A lexandre; A zuma, R yokei
C itation
PL OS ONE (2018), 13(3)
Is s ue D ate
2018-03-01
UR L
http://hdl.handle.net/2433/230428
R ig ht
©
2018 Y amazaki et al. T his is an open access article
distributed under the terms of the C reative C ommons
A ttribution L icense, which permits unrestricted use,
distribution, and reproduction in any medium, provided the
original author and source are credited.
T ype
J ournal A rticle
Spatiotemporal distribution and fluctuation of
radiocesium in Tokyo Bay in the five years
following the Fukushima Daiichi Nuclear
Power Plant (FDNPP) accident
Hideo Yamazaki1, Masanobu Ishida1*, Ryoichi Hinokio2, Yosuke Alexandre Yamashiki3, Ryokei Azuma4
1Graduate School of Science and Engineering, Kindai University, Higashiosaka, Osaka, Japan,2Faculty of
Science and Technology, Ryukoku University, Otsu, Shiga, Japan,3Graduate School of Advanced
Integrated Studies in Human Survivability, Kyoto University, Kyoto, Kyoto, Japan,4Department of Civil
Engineering and Urban Design, Osaka Institute of Technology, Osaka, Osaka, Japan
Abstract
A monitoring survey was conducted from August 2011 to July 2016 of the spatiotemporal distribution in the 400 km2area of the northern part of Tokyo Bay and in rivers flowing into it of radiocesium released from the Fukushima Daiichi Nuclear Power Plant (FDNPP) acci-dent. The average inventory in the river mouth (10 km2) was 131 kBq
m-2and 0.73 kBqm-2
in the central bay (330 km2) as the decay corrected value on March 16, 2011. Most of the radiocesium that flowed into Tokyo Bay originated in the northeastern section of the Tokyo metropolitan area, where the highest precipitation zone of137Cs in soil was almost the same level as that in Fukushima City, then flowed into and was deposited in the Old-Edogawa River estuary, deep in Tokyo Bay. The highest precipitation of radiocesium measured in the high contaminated zone was 460 kBqm-2. The inventory in sediment off the estuary of
Old-Edogawa was 20.1 kBqm-2in August 2011 immediately after the accident, but it increased
to 104 kBqm-2in July 2016. However, the radiocesium diffused minimally in sediments in
the central area of Tokyo Bay in the five years following the FDNPP accident. The flux of radiocesium off the estuary decreased slightly immediately after the accident and con-formed almost exactly to the values predicted based on its radioactive decay. Contrarily, the inventory of radiocesium in the sediment has increased. It was estimated that of the 8.33 TBq precipitated from the atmosphere in the catchment regions of the rivers Edogawa and Old-Edogawa, 1.31 TBq migrated through rivers and was deposited in the sediments of the Old-Edogawa estuary by July 2016. Currently, 0.25 TBqyr-1of radiocesium continues to
flow into the deep parts of Tokyo Bay.
Introduction
Tokyo Bay is a closed bay that extends 70 km from north to south and 20 km from east to west, covers a total area of 1,380 km2, is an average of 15 m deep, and is connected to the a1111111111 a1111111111 a1111111111 a1111111111 a1111111111 OPEN ACCESS
Citation:Yamazaki H, Ishida M, Hinokio R,
Yamashiki YA, Azuma R (2018) Spatiotemporal distribution and fluctuation of radiocesium in Tokyo Bay in the five years following the Fukushima Daiichi Nuclear Power Plant (FDNPP) accident. PLoS ONE 13(3): e0193414.https://doi.org/ 10.1371/journal.pone.0193414
Editor:Tim A. Mousseau, University of South
Carolina, UNITED STATES
Received:November 16, 2017
Accepted:February 10, 2018
Published:March 1, 2018
Copyright:©2018 Yamazaki et al. This is an open
access article distributed under the terms of the
Creative Commons Attribution License, which permits unrestricted use, distribution, and reproduction in any medium, provided the original author and source are credited.
Data Availability Statement:Relevant data are
within the paper and its Supporting Information files. The radiocesium activity of global fallout data are available from the Japan Chemical Analysis Center (JCAC), found here: http://www.kankyo-hoshano.go.jp/en/07/07.html.
Funding:This work was supported by the
Pacific Ocean by a 7 km wide strait at its south end. The average retention time of seawater varies seasonally but is reported to be approximately 31 days [1]. Central Tokyo is located on the west side of the bay, which is surrounded by a zone of large cities that forms the heart of Japan, and has a total population of 38 million. The catchment basins of rivers flowing into Tokyo Bay from the greater Tokyo region occupy a land area of 9,100 km2, and the total quantity of inflowing river water fluctuates greatly, but averages approximately 1.4×10⁷m3day-1. The major rivers are the
Edogawa, Old-Edogawa, Arakawa, Tamagawa, Sumidagawa, and Tsurumigawa. Even though Tokyo Bay is closed, its seawater flow is complex. In addition to tidal currents, permanent cur-rents flow throughout the bay, and the surface water movement is dominated by circular drifts: clockwise in the winter and counterclockwise in the summer. The bottom water moves in the opposite direction to the flow of the surface water. The pelagic water from the Pacific Ocean flows north on the bottom inside the bay until it reaches the Bay’s deepest section [1].
Aircraft monitoring of the134+137Cs precipitation was conducted by the Ministry of Educa-tion, Culture, Sports, Science and Technology of Japan (MEXT) [2], and the results were pub-lished by the Geospatial Information Authority of Japan (GSI) [3], showing that the catchment basin of Edogawa River was contaminated from 30 to 100 kBqm-2by radiocesium discharged
from the Fukushima Daiichi Nuclear Power Plant (FDNPP) accident, but the radioactive con-tamination levels in the catchment basins of the Bay’s other rivers were lower than those in the catchment basin of Edogawa. Radioactive materials precipitated on the ground surface in the greater Tokyo region are, as in the case of artificially discharged environmental contaminants, presumably carried by these rivers until they finally flow into Tokyo Bay.
Many reports outlining the FDNPP accident have already been released to the public [4–7]. However, many of these are analyses of the accident process, whereas few address the environ-mental radioactive contamination that was caused [2,8–10]. In particular, the movement in the greater Tokyo region of radioactive contamination produced by the FDNPP accident has been insufficiently analyzed. Nevertheless, after the accident, high concentration radioactive plumes arrived in the greater Tokyo region, radionuclides washout with precipitation (rainfall) on March 16 and 22 in 2011 [11]. Clarifying the movement of environmental radioactive con-taminants in the heavily populated greater Tokyo region is an important issue related to the problem of low dose exposure to large populations. Evaluation of the migration process of radiocesium from the Tokyo metropolitan area also is important from the viewpoint of reduc-tion and decontaminareduc-tion of radioactive contaminareduc-tion in these areas. In our previous paper, the behavior of radioactive contaminants of the soil in the Tokyo metropolitan area was dis-cussed [12]. It is estimated that 10 to 22% of the radiocesium precipitated in the surface soil and migrated to Tokyo Bay via rivers in the five years after the FDNPP accident.
This study was a continuous time-series analysis of the distribution and fluctuation of radiocesium in sediments and waters in Tokyo Bay and in the rivers flowing into Tokyo Bay starting in August 2011, immediately after the FDNPP accident. Based on the results, the pro-cess of the movement from the land and deposition in Tokyo Bay of radiocesium that was precipitated in the greater Tokyo region via the FDNPP accident were evaluated. However, before the FDNPP accident the Chernobyl accident and the Three Mile Island (TMI) accident affected many affecting people. TMI was located about 150 km west of Washington DC but because it avoided the destruction of the pressure vessel, the emission of radioactive nuclides to the environment is only rare gas nuclides, and the release amount of131I is estimated to be about 0.5 TBq [13,14]. In the case of the Chernobyl accident, Kiev City was located 130 km south, and 4 million residents lived in that metropolitan area. It was reported at the Chernobyl Forum by the IAEA in 2006 [15] that radioactive plume flew to Kyiv City by the north wind on May 1, 1986 immediately after the accident. However, regulations on information disclosure were made by the Soviet government at the time, and the actual state and dynamics of Yamazaki. He plays roles in Conceptualization,
Investigation, Writing - Review & Editing. Grant number: 26289155 (HY, RA),https://kaken.nii.ac. jp/en/grant/KAKENHI-PROJECT-26289155/. Co-investigators are Hideo Yamazaki and Ryokei Azuma. Ryokei Azuma plays a role in Formal Analysis. Grant number: 15J10109 (MI),https:// www.jsps.go.jp/j-pd/data/saiyo_ichiran/h27/dc1/ h27_dc1_09_sougou.pdf[in Japanese]. The URL is described the adopters for JSPS DC1; Under the URL, the overview of DC1 is described;https:// www.jsps.go.jp/english/e-pd/index.html. Principal investigator is Masanobu Ishida. He plays roles in Data Curation, Formal Analysis, Investigation, Methodology, Project Administration, Visualization and Writing - Original Draft Preparation. Grant number: 26303004 (RA, HY),https://kaken.nii.ac. jp/en/grant/KAKENHI-PROJECT-26303004/. Principal investigator is Ryokei Azuma. Co-investigator is Hideo Yamazaki. Grant number: 24110006 (YY),https://kaken.nii.ac.jp/en/grant/ KAKENHI-PLANNED-24110006/. Co-investigator is Yosuke Yamashiki. He plays a role in Formal Analysis and Investigation.
Competing interests:The authors have declared
radioactive contamination in Kiev City are still hardly understood even now. Of course, do not forget the radioactive contamination by the atomic bombs of Hiroshima and Nagasaki. The results of our investigation on the environmental dynamics of 60 years after radiation exposure in Nagasaki has already been reported [16–18]. From such a viewpoint, we think that the FDNPP accident was the first time that an urban region as densely populated as Tokyo was contaminated by radioactive material over a wide area.
Studies on the behavior of radiocesium in an urban environment have been performed through simulations [19], but fluctuation in this radionuclide’s spatiotemporal distribution has not been monitored nor analyzed over wide areas for long periods. Furthermore, the behavior of cesium as an alkaline element is often complicated and unknown in the estuary where seawater and river water mix [20,21]. In this study, the important roles that Tokyo Bay and rivers flowing into it play in the movement of radiocesium contaminants and the transport and accumulation mechanisms of such in the greater Tokyo region have been clarified.
The Nuclear Regulation Authority of the Japanese Government (NRA) has monitored the radioactive contamination derived from the FDNPP accident in the surface sediment of Tokyo Bay since June 2013 [22]. The Japan Coast Guard (JCG) has also been measuring the radioac-tive contamination of surface sediments in Tokyo Bay since 1981 [23]. On the other hand, sur-vey results of radiocesium contamination in the Tokyo Bay area immediately after the accident have been published [24]. However, since their monitoring is limited spatiotemporally, it is insufficient to evaluate the dynamics of radioactive contamination throughout the environ-ments of Tokyo Bay.
Sampling and analytical methods
Material and methods
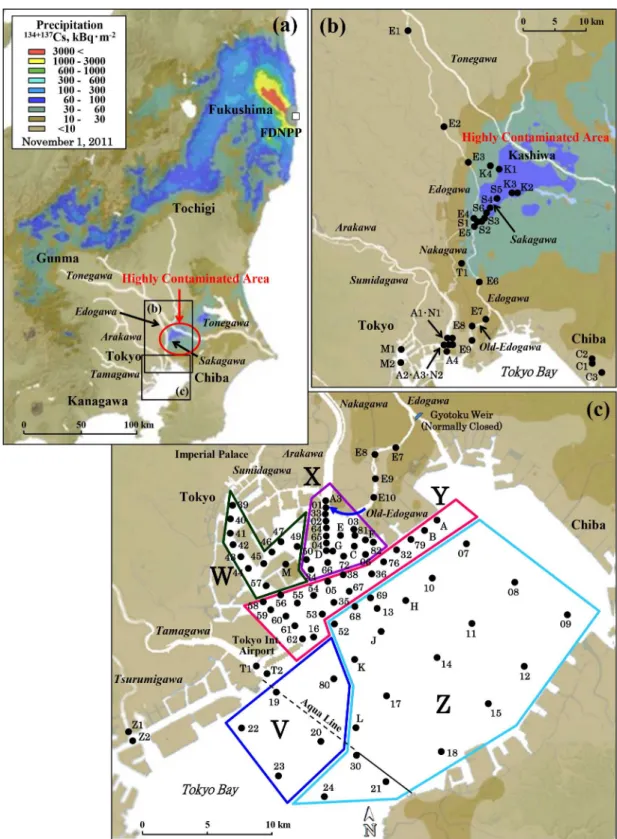
Sediment and water were sampled in Tokyo Bay and in the rivers in its catchment basin. The locations are shown inFig 1. Sampling was performed at the same points one to seven times during the study period, which ran from August 20, 2011, until July 12, 2016. Sediment sam-ples were collected at 77 points in Tokyo Bay, 10 points in Edogawa River, and 6 points in Sakagawa River. Of the sediment samples collected, 68 were core sediments and 142 surface sediments. Sediment cores were sampled at Point S1 (Fig 1), where Sakagawa flows into Edo-gawa, to evaluate the role of Sakagawa in the process of transporting radiocesium. To compare with sediment, soil samples were also collected from the 14 points shown inFig 1B.
Fig 1. Study areas and sampling points.Geographical distribution of the radiocesium precipitation is indicated by the values for eight months after the accident, adapted from “Extension Site of Distribution Map of Radiation Dose, etc.” [3]. (a) Study area. (b) Sampling points in the Edogawa river system. (c) Sampling points in the Tokyo Bay area. V: Tamagawa estuary, W: Sumidagawa estuary, X: Old-Edogawa estuary, Y: Off the Old-Edogawa estuary, Z: Center of Tokyo Bay, Aqua Line: Cross road of Tokyo Bay. River water in Old-Edogawa flows in the direction of the blue arrow in Fig 1C.
(pore size 0.8μm), then the radioactivity of the dried AMP precipitate was measured. In this way, it was confirmed in a preliminary experiment that the ionic and suspended radiocesium in the sample water can be recovered quantitatively.
Measurement of radioactivity
Radionuclides in the samples were quantified by connecting a 4096-multichannel pulse height analyzer (Lab Equipment, MCA600) to a low energy HPGe detector (ORTEC, LO-AX/30P) shielded in lead 10 cm thick, sealing the specimens inside a plastic container with a diameter of 5.5 cm and depth of 2.0 cm, then measuring them viaγ-ray spectrometry. The Ge detector calculated the geometric efficiency relative to the sample weight using the American NIST (National Institute of Standards and Technology) Environmental Radioactivity Standards, SRM 4350B (River Sediment) and SRM 4354 (Freshwater Lake Sediment), and the efficiency was corrected to within a range of 2 to 30 g of the sample weight [26]. The measurement time was set so that the counting error would be less than 5% according to the radioactive intensity of the samples.134Cs (605 keV) and137Cs (662 keV) were quantified in this study. A134Cs solu-tion with known concentrasolu-tion was used to correct the sum peak effect for134Cs counting. The detection limits of134Cs and137Cs under appropriate conditions were 0.6 Bqkg-1in
sedi-ment samples and 0.3 mBqL-1in water samples. Radiocesium activity was indicated by the
val-ues per sampling day, but was corrected for radioactive decay to the value on March 16, 2011, as necessary. In that case, it is denoted as “corrected activity.”
Measurements of heavy metals and particle size distributions in the
sediments
The heavy metals in the sediments were measured via an XRF method (Rigaku, ZSX-Primus I) using the NIST SRM 1646 (Estuarine Sediment) as the standard sample. Sample measured were made from cellulose powder pressed into 4 cm diameter aluminum ring 0.4 toncm-2, and then
1.2 g of powdered sample was placed on the disk and repressed at 1.6 toncm-2. The correction of
matrix effect was achieved by X-ray intensity ratio of peak to back ground for each element [27]. Mercury in the sediments was measured via a heating-vaporization atomic absorption spectrome-try (Hiranuma, HG-300). The particle size distribution of the wet sediment samples was measured using a laser diffractometer (Shimadzu, SALD-3000) with a measurement range of particle size 0.05 to 3000μm. Dispersion of sedimentary particles was carried out via ultrasonic irradiation (Shimadzu, SUS-200, 42 kHz) using sodium hexametaphosphate as a dispersant. In this paper, the particle size obtained is presented as the volume-based average particle diameter.
Results
Spatiotemporal distribution of radiocesium in Tokyo Bay sediment
The highest134+137Cs activity among all measured values in Tokyo Bay was 1340±13 Bqkg-1, found in the surface sediments sampled at Point 01 in the Old-Edogawa estuary on
November 1, 2012. As shown inFig 2, the134+137Cs activity in surface sediment in Tokyo Bay was ranked from high to low contamination level as the Edogawa estuary (X), off the Old-Edogawa estuary (Y), center of Tokyo Bay (Z), Tamagawa estuary (V), and Sumidagawa estu-ary (W). Throughout the survey period, the134+137Cs activity of the surface sediments was highest in the Area X, and fell remarkably towards the Area Z. The134+137Cs activity indicated by the weighted average value was 424±1 Bqkg-1(78–1340 Bqkg-1, n = 55) for X, 131±1
Bqkg-1(40–371 Bqkg-1, n = 40) for Y, and 17±0.3 Bqkg-1(1–162 Bqkg-1, n = 50) for Z. In
the Tamagawa estuary (V), which flows through farmland in western metropolitan Tokyo, the weighted average activity was 57±1 Bqkg-1(5–234 Bqkg-1, n = 7). In the Sumidagawa mouth
(W), which flows through central Tokyo, it was 103±2 Bqkg-1(32–374 Bqkg-1, n = 16). Both
are lower activities than that of the Old-Edogawa estuary (X).
Fig 2. Activities of134+137Cs in the surface sediments throughout the Tokyo Bay water system.Sediment samples were collected from August 20, 2011,
to July 12, 2016. The activity of134+137Cs was radioactive decay corrected based on the value of March 16, 2011. The value of activity is shown as an average of the values from the surface to 5 cm depth. When there are multiple data at the same point, the activity is expressed as a weighted average value for the counting error.
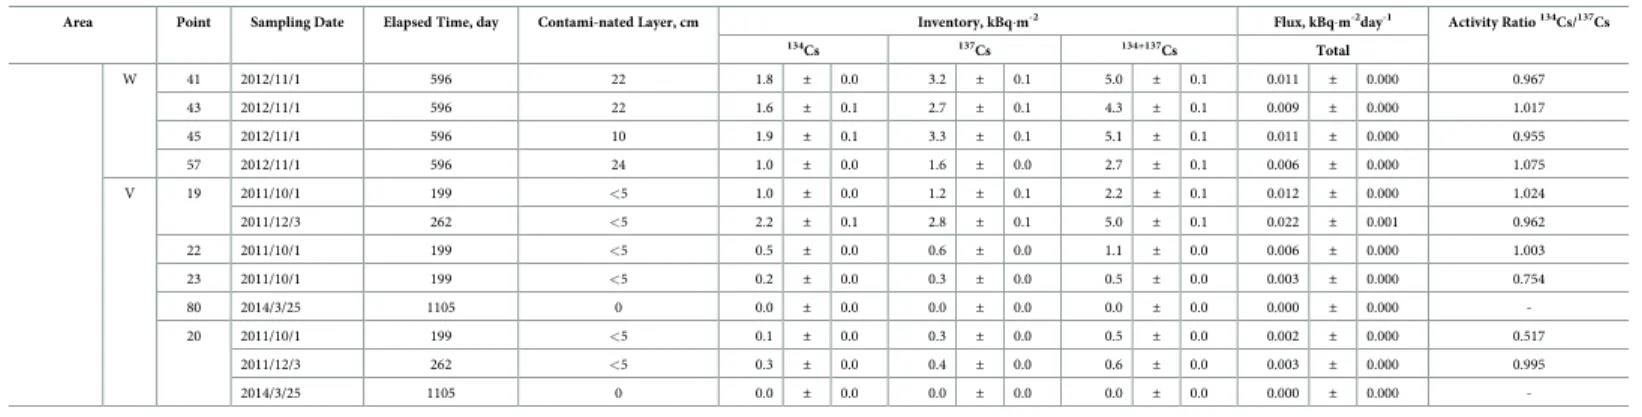
We inferred the inventory and flux of radiocesium accumulation in Tokyo Bay sediment from the catchment basin owing to the FDNPP accident for the five years studied.Table 1 shows the inventory, flux, and134Cs/137Cs activity ratio of radiocesium in the sediments col-lected from the Edogawa water system and Tokyo Bay. The134Cs/137Cs activity ratio in 117 sediment samples (Table 1,S6 Table), with counting error of the radioactivity measurements within 5%, was 1.006±0.003 (weighted average value), which conforms to the134Cs/137Cs ratio of radiocesium discharged by the FDNPP accident [28–30].
The vertical distribution of radiocesium in Tokyo Bay sediment was investigated via the core samples.Fig 3(S1 Table) shows the vertical distribution of the134+137Cs activities from the Old-Edogawa mouth (Point 02) to the center of the bay (Point J) in 2014 and 2015. The highest activity of radiocesium was 1070 Bqkg-1, detected in the 35 cm depth layer of Point
02, which is near the river mouth. However, for Point J in the center of the bay, the peak of
Table 1. Inventory and flux of radiocesium in the sediment of the Tokyo Bay water system.
Area Point Sampling Date Elapsed Time, day Contami-nated Layer, cm Inventory, kBqm-2 Flux, kBqm-2day-1 Activity Ratio134Cs/137Cs
134Cs 137Cs 134+137Cs Total
Edogawa River E1 2011/12/3 262 <5 3.5 ± 0.2 4.2 ± 0.2 7.6 ± 0.2 0.033 ± 0.001 1.039
2015/11/11 1701 25 22.3 ± 0.4 95.7 ± 0.9 118 ± 1 0.126 ± 0.001 1.005
E2 2011/12/3 262 <5 6.2 ± 0.2 7.6 ± 0.2 13.8 ± 0.3 0.060 ± 0.001 1.031
2015/11/12 1702 15 2.5 ± 0.2 10.5 ± 0.3 13.0 ± 0.3 0.014 ± 0.000 1.012
E3 2011/12/3 262 <5 15.3 ± 0.3 18.5 ± 0.3 33.9 ± 0.5 0.146 ± 0.002 1.036
2015/11/12 1702 5 0.3 ± 0.1 1.4 ± 0.1 1.8 ± 0.1 0.002 ± 0.000 1.027
E4 2011/12/3 262 <5 12.1 ± 0.3 15.2 ± 0.3 27.4 ± 0.4 0.118 ± 0.002 0.998
2015/11/12 1702 24 1.7 ± 0.2 7.1 ± 0.3 8.8 ± 0.4 0.009 ± 0.001 1.026
E5 2011/12/3 262 <5 10.7 ± 0.3 13.2 ± 0.3 23.9 ± 0.5 0.103 ± 0.002 1.023
2014/3/24 1104 <5 15.9 ± 0.3 39.5 ± 0.5 55.4 ± 0.6 0.078 ± 0.001 1.036
2015/11/12 1702 20 1.6 ± 0.2 7.3 ± 0.3 8.9 ± 0.4 0.009 ± 0.001 0.959
E6 2011/12/3 262 <5 27.5 ± 0.5 34.4 ± 0.6 61.9 ± 0.8 0.267 ± 0.003 1.000
2015/11/12 1702 31.5 29.4 ± 0.6 127 ± 1 156 ± 1 0.166 ± 0.002 1.003
E7 2011/12/3 262 <5 23.8 ± 0.4 31.5 ± 0.5 55.4 ± 0.7 0.238 ± 0.003 0.947
2014/3/24 1104 <5 2.5 ± 0.1 6.3 ± 0.2 8.8 ± 0.3 0.012 ± 0.000 1.027
E8 2012/4/3 384 <5 8.3 ± 0.3 11.1 ± 0.3 19.3 ± 0.5 0.060 ± 0.001 1.038
E9 2012/4/3 384 <5 8.3 ± 0.3 11.6 ± 0.3 19.9 ± 0.4 0.062 ± 0.001 1.000
E10 2012/4/3 384 <5 3.1 ± 0.2 4.6 ± 0.2 7.7 ± 0.3 0.024 ± 0.001 0.949
Sakagawa S5 2014/4/29 1140 13.2 175 ± 2 462 ± 3 637 ± 3 0.874 ± 0.005 1.009
S4 2014/4/29 1140 14 56.4 ± 0.7 151 ± 1 207 ± 1 0.284 ± 0.002 0.996
S6 2014/4/29 1140 41 213 ± 3 553 ± 3 766 ± 5 1.055 ± 0.008 1.023
S3 2014/4/29 1140 5 31.9 ± 0.4 85.3 ± 0.7 117 ± 1 0.160 ± 0.001 0.994
S2 2014/4/29 1140 14 87.8 ± 0.9 234 ± 1 321 ± 2 0.440 ± 0.003 1.001
S1 2014/4/29 1140 50 400 ± 2 1050 ± 3 1450 ± 4 1.997 ± 0.006 1.011
2015/11/13 1703 12 13.5 ± 0.3 57.6 ± 0.6 71.2 ± 0.7 0.076 ± 0.001 1.012
2016/6/25 1928 32 50.5 ± 0.7 257 ± 2 307 ± 2 0.305 ± 0.002 1.029
X 02 2012/11/1 596 12 8.5 ± 0.1 13.9 ± 0.2 22.4 ± 0.2 0.049 ± 0.000 1.024
2016/7/12 1945 52 14.0 ± 0.3 74.7 ± 0.6 88.7 ± 0.7 0.087 ± 0.001 0.995
64 2013/10/4 933 26 11.2 ± 0.2 24.7 ± 0.3 35.9 ± 0.3 0.056 ± 0.001 1.009
D 2011/8/20 157 26 9.3 ± 0.2 10.8 ± 0.2 20.1 ± 0.2 0.138 ± 0.002 0.984
2012/4/2 383 26 12.1 ± 0.1 17.0 ± 0.1 29.1 ± 0.2 0.090 ± 0.001 0.986
2012/11/1 596 44 21.0 ± 0.2 34.7 ± 0.3 55.8 ± 0.4 0.122 ± 0.001 1.012
2013/10/4 933 44 17.7 ± 0.2 39.2 ± 0.3 56.9 ± 0.4 0.089 ± 0.001 1.007
2014/3/25 1105 42 17.2 ± 0.2 44.1 ± 0.3 61.3 ± 0.3 0.086 ± 0.001 1.009
2015/11/13 1703 70 18.0 ± 0.2 76.3 ± 0.5 94.2 ± 0.6 0.101 ± 0.001 1.017
2016/7/12 1945 78 16.9 ± 0.2 87.1 ± 0.5 104.0 ± 0.6 0.103 ± 0.001 1.029
G 2016/7/12 1945 70 15.0 ± 0.3 78.5 ± 0.6 93.5 ± 0.6 0.092 ± 0.001 1.013
03 2012/4/2 383 36 53.0 ± 0.5 72.8 ± 0.5 126 ± 1 0.392 ± 0.002 1.011
2012/11/1 596 18 6.3 ± 0.1 10.8 ± 0.2 17.1 ± 0.2 0.037 ± 0.001 0.968
C 2011/8/20 157 10 2.8 ± 0.1 3.3 ± 0.1 6.0 ± 0.1 0.041 ± 0.001 0.972
2014/3/25 1105 10 0.5 ± 0.0 1.2 ± 0.0 1.7 ± 0.1 0.003 ± 0.000 1.139
49 2012/11/1 596 26 5.3 ± 0.1 9.0 ± 0.1 14.3 ± 0.1 0.031 ± 0.000 0.983
2015/11/13 1703 4 0.1 ± 0.0 0.4 ± 0.0 0.5 ± 0.0 0.001 ± 0.000 1.176
Table 1. (Continued)
Area Point Sampling Date Elapsed Time, day Contami-nated Layer, cm Inventory, kBqm-2 Flux, kBqm-2day-1 Activity Ratio134Cs/137Cs
134Cs 137Cs 134+137Cs Total
Tokyo Bay Y 34 2012/11/1 596 18 1.9 ± 0.1 3.3 ± 0.1 5.2 ± 0.1 0.011 ± 0.000 0.969
72 2012/11/1 596 16 2.0 ± 0.1 3.4 ± 0.1 5.4 ± 0.1 0.012 ± 0.000 0.964
06 2012/11/1 596 8 0.6 ± 0.0 1.1 ± 0.0 1.7 ± 0.1 0.004 ± 0.000 0.823
05 2013/10/4 933 30 2.3 ± 0.1 5.3 ± 0.1 7.6 ± 0.1 0.012 ± 0.000 0.969
38 2012/4/2 383 26 3.0 ± 0.1 4.2 ± 0.1 7.2 ± 0.1 0.022 ± 0.000 0.982
2014/3/25 1105 28 1.9 ± 0.1 4.7 ± 0.1 6.6 ± 0.1 0.009 ± 0.000 1.025
54 2012/11/1 596 28 1.7 ± 0.0 3.0 ± 0.1 4.7 ± 0.1 0.010 ± 0.000 0.960
61 2012/11/1 596 16 1.9 ± 0.1 3.4 ± 0.1 5.3 ± 0.1 0.011 ± 0.000 0.949
59 2012/11/1 596 16 1.3 ± 0.0 2.2 ± 0.1 3.5 ± 0.1 0.008 ± 0.000 0.984
36 2014/3/25 1105 10 0.3 ± 0.0 0.7 ± 0.0 1.0 ± 0.0 0.001 ± 0.000 1.059
32 2012/11/1 596 18 3.4 ± 0.1 5.6 ± 0.1 9.0 ± 0.1 0.020 ± 0.000 1.006
B 2011/8/20 157 16 2.3 ± 0.1 2.7 ± 0.1 5.0 ± 0.1 0.034 ± 0.001 0.958
A 2011/8/20 157 6 0.3 ± 0.0 0.3 ± 0.0 0.6 ± 0.0 0.004 ± 0.000 0.959
2012/11/1 596 36 4.1 ± 0.1 6.9 ± 0.1 11.1 ± 0.1 0.024 ± 0.000 0.992
Z 07 2011/10/1 199 <5 0.3 ± 0.0 0.5 ± 0.0 0.8 ± 0.0 0.004 ± 0.000 0.825
2011/12/3 262 <5 1.2 ± 0.0 1.5 ± 0.0 2.6 ± 0.1 0.011 ± 0.000 1.003
2014/3/25 1105 5 0.1 ± 0.0 0.4 ± 0.0 0.6 ± 0.0 0.001 ± 0.000 0.900
2015/11/13 1703 <5 0.1 ± 0.0 0.3 ± 0.0 0.4 ± 0.0 0.000 ± 0.000 1.040
10 2011/10/1 199 <5 0.2 ± 0.0 0.3 ± 0.0 0.5 ± 0.0 0.003 ± 0.000 1.005
2011/12/3 262 <5 0.2 ± 0.0 0.3 ± 0.0 0.6 ± 0.0 0.002 ± 0.000 0.833
2014/3/25 1105 2.5 0.1 ± 0.0 0.2 ± 0.0 0.2 ± 0.0 0.000 ± 0.000 1.062
2015/11/13 1703 <5 0.0 ± 0.0 0.1 ± 0.0 0.2 ± 0.0 0.000 ± 0.000 1.811
H 2015/11/13 1703 <5 0.1 ± 0.0 0.4 ± 0.0 0.5 ± 0.0 0.001 ± 0.000 1.074
69 2012/11/1 596 <5 0.3 ± 0.0 0.6 ± 0.0 1.0 ± 0.1 0.002 ± 0.000 0.907
2014/3/25 1105 2.5 0.0 ± 0.0 0.1 ± 0.0 0.1 ± 0.0 0.000 ± 0.000 0.540
68 2012/11/1 596 6 0.1 ± 0.0 0.2 ± 0.0 0.3 ± 0.0 0.001 ± 0.000 0.801
2015/11/13 1703 20 0.5 ± 0.1 2.3 ± 0.1 2.8 ± 0.1 0.003 ± 0.000 0.984
52 2012/11/1 596 14 0.7 ± 0.0 1.2 ± 0.0 1.9 ± 0.0 0.004 ± 0.000 0.993
2014/3/25 1105 5 0.1 ± 0.0 0.3 ± 0.0 0.4 ± 0.0 0.000 ± 0.000 0.859
2015/11/13 1703 <5 0.1 ± 0.0 0.3 ± 0.0 0.4 ± 0.1 0.000 ± 0.000 0.868
13 2011/10/1 199 <5 0.3 ± 0.0 0.4 ± 0.0 0.7 ± 0.0 0.004 ± 0.000 0.987
2011/12/3 262 <5 0.0 ± 0.0 0.1 ± 0.0 0.1 ± 0.0 0.000 ± 0.000 0.834
2014/3/25 1105 2.5 0.0 ± 0.0 0.1 ± 0.0 0.1 ± 0.0 0.000 ± 0.000 0.791
2015/11/13 1703 <5 0.0 ± 0.0 0.1 ± 0.0 0.1 ± 0.0 0.000 ± 0.000 0.914
J 2016/7/12 1945 8 0.1 ± 0.0 0.4 ± 0.0 0.5 ± 0.0 0.001 ± 0.000 1.141
K 2015/11/13 1703 <5 0.0 ± 0.0 0.1 ± 0.0 0.2 ± 0.0 0.000 ± 0.000 1.258
17 2011/10/1 199 <5 0.2 ± 0.0 0.3 ± 0.0 0.5 ± 0.0 0.003 ± 0.000 0.989
2011/12/3 262 <5 0.2 ± 0.0 0.2 ± 0.0 0.4 ± 0.0 0.002 ± 0.000 0.790
2014/3/25 1105 2.5 0.0 ± 0.0 0.1 ± 0.0 0.2 ± 0.0 0.000 ± 0.000 0.874
2015/11/13 1703 <5 0.0 ± 0.0 0.1 ± 0.0 0.1 ± 0.0 0.000 ± 0.000 1.283
14 2011/10/1 199 <5 0.2 ± 0.0 0.2 ± 0.0 0.4 ± 0.0 0.002 ± 0.000 1.002
2011/12/3 262 <5 0.2 ± 0.0 0.2 ± 0.0 0.3 ± 0.0 0.001 ± 0.000 1.309
2014/3/25 1105 2.5 0.0 ± 0.0 0.1 ± 0.0 0.1 ± 0.0 0.000 ± 0.000 1.187
11 2011/10/1 199 <5 0.0 ± 0.0 0.2 ± 0.0 0.2 ± 0.0 0.001 ± 0.000 0.218
2011/12/3 262 <5 0.1 ± 0.0 0.1 ± 0.0 0.1 ± 0.0 0.000 ± 0.000 1.385
2014/3/25 1105 2.5 0.1 ± 0.0 0.2 ± 0.0 0.3 ± 0.0 0.000 ± 0.000 0.991
2015/11/13 1703 <5 0.0 ± 0.0 0.2 ± 0.0 0.2 ± 0.0 0.000 ± 0.000 0.957
08 2011/10/1 199 <5 0.1 ± 0.0 0.1 ± 0.0 0.2 ± 0.0 0.001 ± 0.000 0.890
2011/12/3 262 <5 0.2 ± 0.0 0.3 ± 0.0 0.5 ± 0.0 0.002 ± 0.000 0.999
2014/3/25 1105 5 0.1 ± 0.0 0.3 ± 0.0 0.5 ± 0.0 0.001 ± 0.000 0.930
09 2011/10/1 199 <5 0.2 ± 0.0 0.3 ± 0.0 0.5 ± 0.0 0.003 ± 0.000 0.920
2014/3/25 1105 0 0.0 ± 0.0 0.0 ± 0.0 0.0 ± 0.0 0.000 ± 0.000
-12 2011/10/1 199 0 0.0 ± 0.0 0.0 ± 0.0 0.0 ± 0.0 0.000 ± 0.000
-2014/3/25 1105 2.5 0.0 ± 0.0 0.1 ± 0.0 0.2 ± 0.0 0.000 ± 0.000 0.941
15 2011/10/1 199 <5 0.1 ± 0.0 0.2 ± 0.0 0.3 ± 0.0 0.002 ± 0.000 0.910
2014/3/25 1105 5 0.1 ± 0.0 0.2 ± 0.0 0.3 ± 0.0 0.000 ± 0.000 0.960
18 2011/10/1 199 <5 0.4 ± 0.0 0.4 ± 0.0 0.8 ± 0.1 0.004 ± 0.000 1.211
2014/3/25 1105 0 0.0 ± 0.0 0.0 ± 0.0 0.0 ± 0.0 0.000 ± 0.000
-21 2011/10/1 199 <5 0.2 ± 0.1 0.4 ± 0.1 0.6 ± 0.1 0.003 ± 0.000 0.712
2014/3/25 1105 0 0.0 ± 0.0 0.0 ± 0.0 0.0 ± 0.0 0.000 ± 0.000
-L 2015/11/13 1703 <5 0.0 ± 0.0 0.2 ± 0.0 0.3 ± 0.0 0.000 ± 0.000 1.045
30 2011/10/1 199 <5 0.2 ± 0.0 0.2 ± 0.0 0.5 ± 0.0 0.003 ± 0.000 1.071
24 2011/10/1 199 0 0.0 ± 0.0 0.0 ± 0.0 0.0 ± 0.0 0.000 ± 0.000
radiocesium activity was 44 Bqkg-1, detected in the 5 cm depth layer. This suggests that the
radiocesium in the river was rapidly deposited on the sediment in the river mouth and only slightly diffused to the center of the bay.
The change over time in the vertical distribution of radiocesium at Point D in the Old-Edo-gawa estuary is shown inFig 4(S1 Table). The activity of radiocesium was high in the 5 cm layer in August 2011, immediately after the FDNPP accident, and it peaked at 547 Bqkg-1in
Table 1. (Continued)
Area Point Sampling Date Elapsed Time, day Contami-nated Layer, cm Inventory, kBqm-2 Flux, kBqm-2day-1 Activity Ratio134Cs/137Cs
134Cs 137Cs 134+137Cs Total
W 41 2012/11/1 596 22 1.8 ± 0.0 3.2 ± 0.1 5.0 ± 0.1 0.011 ± 0.000 0.967
43 2012/11/1 596 22 1.6 ± 0.1 2.7 ± 0.1 4.3 ± 0.1 0.009 ± 0.000 1.017
45 2012/11/1 596 10 1.9 ± 0.1 3.3 ± 0.1 5.1 ± 0.1 0.011 ± 0.000 0.955
57 2012/11/1 596 24 1.0 ± 0.0 1.6 ± 0.0 2.7 ± 0.1 0.006 ± 0.000 1.075
V 19 2011/10/1 199 <5 1.0 ± 0.0 1.2 ± 0.1 2.2 ± 0.1 0.012 ± 0.000 1.024
2011/12/3 262 <5 2.2 ± 0.1 2.8 ± 0.1 5.0 ± 0.1 0.022 ± 0.001 0.962
22 2011/10/1 199 <5 0.5 ± 0.0 0.6 ± 0.0 1.1 ± 0.0 0.006 ± 0.000 1.003
23 2011/10/1 199 <5 0.2 ± 0.0 0.3 ± 0.0 0.5 ± 0.0 0.003 ± 0.000 0.754
80 2014/3/25 1105 0 0.0 ± 0.0 0.0 ± 0.0 0.0 ± 0.0 0.000 ± 0.000
-20 2011/10/1 199 <5 0.1 ± 0.0 0.3 ± 0.0 0.5 ± 0.0 0.002 ± 0.000 0.517
2011/12/3 262 <5 0.3 ± 0.0 0.4 ± 0.0 0.6 ± 0.0 0.003 ± 0.000 0.995
2014/3/25 1105 0 0.0 ± 0.0 0.0 ± 0.0 0.0 ± 0.0 0.000 ± 0.000
-Elapsed time is from March 16, 2011 to sampling date. Contaminated layer means the thickness from the surface to deepest layer where134Cs is detected. Flux was calculated by dividing the inventory by elapsed time from the FDNPP accident.
https://doi.org/10.1371/journal.pone.0193414.t001
Fig 3. Spatial changes in the vertical distribution of134+137Cs in sediment cores collected from the Old-Edogawa estuary toward the central Tokyo Bay.
the 13 cm layer in October 2013. Because a large amount of flood materials flowed into Tokyo Bay owing to the Kanto-Tohoku heavy rainfall event from September 9 to 11, 2015, the radioce-sium was buried to a much deep layer. As shown inFig 4(Red circle) andS1 Fig, sediment with a relatively low deposition density was accumulated in the 8 to 22 cm layer of the Point D core col-lected in November 2015 after this flood. It is shown that sedimentary materials with high water content and low apparent density are deposited in the estuary area during flooding [31]. Further-more, the radiocesium derived from the FDNPP accident was detected as approximately 350 Bqkg-1in the 70 cm depth layer, collected on July 2016. This value in April 2012 when correction
of radioactive decay was 560 Bqkg-1. Furthermore, It is suggested that the concentration peak of
radiocesium about five years after the accident is buried while being retained in the sediment.
Radiocesium activity in water samples around Tokyo Bay
It was assumed that radiocesium flows into Tokyo Bay through the rivers. Thus, the134+137Cs activity in water from the estuaries of the major rivers that flow into Tokyo Bay was analyzed. The results are shown inTable 2. The134+137Cs activity in water standardized for March 16, 2011, ranged from 4.4 to 178 mBqL-1, and in the estuary of the Old-Edogawa, it was higher,
by 20 mBqL-1or more. In particular, higher radiocesium activity (23 to 178 mBqL-1) was
detected in the water at the confluence of Sakagawa and Edogawa (Point S1). In the estuaries of Sumidagawa and Tamagawa, on the other hand, it was lower than 10 mBqL-1. This
Fig 4. Temporal changes in the vertical distribution of134+137Cs in the sediment core collected at Point D.A large amount of suspended materials flowed in owing to the Kanto-Tohoku heavy rainfall event from September 9 to 11, 2015 and was deposited in the Old-Edogawa estuary. The red circle in the core collected on November 13, 2015 shows the flood sedimentary layer that flowed in due to the flood.
Cs Cs Cs Cs Cs Cs (S/B) Cs/ Cs Edogawa E1 S 2014/3/24 1.7 ± 1.1 6.2 ± 0.9 7.9 ± 1.5 4.6 ± 3.1 6.7 ± 1.0 11.3 ± 3.3 0.688 ± 0.478
2016/6/24 0.9 ± 0.5 5.2 ± 0.8 6.1 ± 0.9 5.2 ± 3.1 5.9 ± 0.9 11.1 ± 3.2 0.881 ± 0.544 E2 S 2016/6/24 1.0 ± 0.4 5.8 ± 0.8 6.8 ± 0.9 6.0 ± 2.5 6.6 ± 0.9 12.5 ± 2.7 0.906 ± 0.402 E3 S 2014/3/24 4.7 ± 0.9 17.5 ± 1.3 22.2 ± 1.6 13.0 ± 2.6 18.8 ± 1.4 31.7 ± 2.9 0.692 ± 0.147 2016/6/24 0.8 ± 0.4 4.1 ± 0.7 4.9 ± 2.4 4.6 ± 2.3 4.7 ± 0.8 9.3 ± 2.4 0.998 ± 0.520 E4 S 2016/6/24 0.7 ± 0.5 4.9 ± 0.8 5.5 ± 0.9 4.1 ± 3.1 5.5 ± 0.9 9.5 ± 3.2 0.739 ± 0.568 Sakagawa S5 S 2014/4/29 4.2 ± 0.8 12.8 ± 1.4 17.0 ± 1.6 12.1 ± 2.2 13.7 ± 1.5 25.8 ± 2.7 0.880 ± 0.187 S4 S 2014/4/29 12.2 ± 1.2 38.9 ± 1.4 51.1 ± 1.8 34.9 ± 3.3 41.7 ± 1.5 76.6 ± 3.6 0.836 ± 0.085 S3 S 2016/6/24 1.8 ± 0.8 10.8 ± 1.0 12.6 ± 1.3 10.6 ± 4.5 12.2 ± 1.1 22.7 ± 4.7 0.866 ± 0.380 S2 S 2016/6/24 2.7 ± 0.6 17.1 ± 1.2 19.8 ± 1.3 16.0 ± 3.3 19.3 ± 1.3 35.3 ± 3.6 0.829 ± 0.182 S1 S 2014/4/29 31.3 ± 1.9 82.6 ± 2.4 113.9 ± 3.1 89.5 ± 5.6 88.8 ± 2.5 178.3 ± 6.1 1.009 ± 0.069 2014/3/24 19.2 ± 1.5 48.1 ± 1.8 67.4 ± 2.3 53.2 ± 4.2 51.6 ± 1.9 104.8 ± 4.6 1.032 ± 0.090 2015/11/12 5.3 ± 0.6 20.7 ± 1.1 26.0 ± 1.3 25.4 ± 3.0 23.0 ± 1.2 48.4 ± 3.3 1.101 ± 0.145 2016/6/24 3.2 ± 0.5 17.5 ± 1.3 20.7 ± 1.3 18.8 ± 2.7 19.8 ± 1.4 38.6 ± 3.1 0.950 ± 0.154 Edogawa E5 S 2016/6/24 0.6 ± 0.5 4.3 ± 0.9 5.0 ± 1.0 3.7 ± 3.1 4.9 ± 1.0 8.6 ± 3.3 0.762 ± 0.658 E6 S 2014/3/24 2.2 ± 0.6 5.5 ± 0.7 7.7 ± 0.9 6.0 ± 1.5 5.9 ± 0.7 11.9 ± 1.7 1.010 ± 0.286 2016/6/24 2.2 ± 0.6 15.4 ± 1.3 17.6 ± 1.5 12.9 ± 3.7 17.4 ± 1.5 30.3 ± 4.0 0.742 ± 0.225 Old- Edogawa E7 S 2016/7/12 1.9 ± 0.3 13.8 ± 1.0 15.8 ± 1.1 11.7 ± 1.8 15.6 ± 1.2 27.3 ± 2.1 0.747 ± 0.125 E8 S 2016/3/24 1.4 ± 0.7 8.3 ± 1.0 9.8 ± 1.2 7.7 ± 3.7 9.4 ± 1.2 17.0 ± 3.9 0.817 ± 0.405 2016/7/12 1.2 ± 0.5 8.9 ± 0.9 10.1 ± 1.1 7.5 ± 3.0 10.0 ± 1.1 17.5 ± 3.2 0.747 ± 0.309 E9 S 2016/3/24 1.5 ± 0.6 9.9 ± 1.0 11.4 ± 1.1 7.9 ± 3.0 11.1 ± 1.1 19.0 ± 3.2 0.708 ± 0.278 Nakagawa N1 S 2016/7/12 1.0 ± 0.4 6.7 ± 0.8 7.7 ± 0.9 5.7 ± 2.5 7.6 ± 0.9 13.3 ± 2.7 0.751 ± 0.343 N2 S 2016/3/24 2.9 ± 0.5 15.2 ± 1.0 18.1 ± 1.1 15.8 ± 2.5 17.0 ± 1.2 32.8 ± 2.8 0.924 ± 0.161 S 2016/7/12 1.2 ± 0.5 7.9 ± 0.9 9.0 ± 1.1 7.1 ± 3.0 8.9 ± 1.1 16.0 ± 3.2 1.37 0.797 ± 0.355 B 2016/7/12 0.9 ± 0.5 5.6 ± 0.9 6.5 ± 1.0 5.3 ± 3.2 6.4 ± 1.0 11.6 ± 3.3 0.826 ± 0.518 Arakawa A1 S 2016/7/12 1.4 ± 0.6 8.8 ± 0.9 10.2 ± 1.1 8.4 ± 3.8 9.9 ± 1.1 18.3 ± 3.9 0.852 ± 0.395 A2 S 2016/3/24 1.8 ± 0.6 9.7 ± 1.1 11.5 ± 1.3 9.9 ± 3.4 10.9 ± 1.3 20.8 ± 3.6 0.915 ± 0.327 S 2016/7/12 2.3 ± 0.5 12.5 ± 1.1 14.7 ± 1.2 13.6 ± 3.3 14.1 ± 1.2 27.7 ± 3.5 1.31 0.967 ± 0.245 B 2016/7/12 1.5 ± 0.5 10.6 ± 1.1 12.1 ± 1.2 9.2 ± 2.9 11.9 ± 1.2 21.1 ± 3.2 0.771 ± 0.258 A3 S 2016/3/24 0.9 ± 0.5 6.4 ± 1.1 7.2 ± 1.2 4.9 ± 2.7 7.1 ± 1.2 12.0 ± 2.9 0.680 ± 0.391 S 2016/7/12 1.7 ± 0.7 11.7 ± 1.0 13.3 ± 1.2 9.9 ± 4.2 13.2 ± 1.2 23.1 ± 4.3 1.32 0.750 ± 0.323 B 2016/7/12 1.4 ± 0.8 8.2 ± 1.3 9.6 ± 1.5 8.2 ± 5.1 9.3 ± 1.4 17.5 ± 5.3 0.883 ± 0.564 A4 S 2016/7/12 2.3 ± 0.6 15.4 ± 0.6 17.7 ± 0.9 13.9 ± 3.9 17.4 ± 0.7 31.3 ± 3.9 0.799 ± 0.224
(Continued)
Tokyo
Bay
pollution
|
https://doi.or
g/10.137
1/journal.po
ne.01934
14
March
1,
134
Cs 137Cs 134+137Cs 134Cs 137Cs 134+137Cs (S/B) 134Cs/137Cs Estuary of Arakawa and Old-Edogawa 02 S 2014/3/25 6.8 ± 0.7 15.7 ± 1.2 22.5 ± 1.4 18.7 ± 2.1 16.9 ± 1.2 35.6 ± 2.4 1.25 1.109 ± 0.147
B 2014/3/25 4.8 ± 0.8 14.1 ± 1.1 19.0 ± 1.3 13.3 ± 2.3 15.2 ± 1.1 28.5 ± 2.5 0.880 ± 0.163 S 2015/11/13 1.9 ± 0.5 10.6 ± 0.8 12.5 ± 0.9 8.9 ± 2.5 11.8 ± 0.9 20.7 ± 2.6 2.62 0.752 ± 0.218 B 2015/11/13 0.9 ± 0.4 3.2 ± 0.6 4.1 ± 0.8 4.4 ± 2.0 3.5 ± 0.7 7.9 ± 2.2 1.243 ± 0.629 S 2016/7/12 2.0 ± 0.6 12.3 ± 1.0 14.3 ± 1.2 11.9 ± 3.8 13.9 ± 1.1 25.8 ± 4.0 2.59 0.859 ± 0.284 B 2016/7/12 0.8 ± 0.5 4.7 ± 0.9 5.5 ± 1.0 4.7 ± 2.8 5.3 ± 1.0 9.9 ± 3.0 0.882 ± 0.562 64 S 2013/10/4 5.1 ± 0.6 15.3 ± 0.8 20.4 ± 1.0 12.0 ± 1.5 16.3 ± 0.8 28.3 ± 1.7 3.78 0.738 ± 0.099 B 2013/10/4 1.3 ± 0.5 4.2 ± 0.6 5.5 ± 0.8 3.0 ± 1.2 4.4 ± 0.6 7.5 ± 1.3 0.687 ± 0.280 D S 2013/10/4 4.5 ± 0.8 14.5 ± 1.2 19.0 ± 1.4 10.7 ± 1.9 15.4 ± 1.2 26.0 ± 2.3 2.18 0.693 ± 0.138 B 2013/10/4 2.4 ± 0.7 5.9 ± 0.9 8.3 ± 1.1 5.7 ± 1.7 6.3 ± 0.9 12.0 ± 1.9 0.901 ± 0.297 S 2014/3/25 7.0 ± 1.0 16.8 ± 1.2 23.9 ± 1.6 19.5 ± 2.9 18.0 ± 1.3 37.5 ± 3.1 2.30 1.083 ± 0.177 B 2014/3/25 2.7 ± 0.5 8.3 ± 0.9 11.0 ± 1.0 7.4 ± 1.5 8.9 ± 0.9 16.3 ± 1.8 0.839 ± 0.189 S 2015/11/13 1.7 ± 0.5 9.5 ± 0.9 11.2 ± 1.0 8.0 ± 2.3 10.6 ± 1.0 18.6 ± 2.5 1.41 0.759 ± 0.230 B 2015/11/13 1.2 ± 0.5 6.5 ± 0.8 7.8 ± 0.9 5.9 ± 2.3 7.3 ± 0.9 13.2 ± 2.4 0.815 ± 0.326 S 2016/7/12 1.8 ± 0.6 9.0 ± 0.9 10.8 ± 1.1 11.0 ± 3.9 10.2 ± 1.0 21.2 ± 4.0 3.29 1.080 ± 0.395
B 2016/7/12 nd 5.7 ± 0.9 5.7 ± 0.9 - 6.4 ± 1.0 6.4 ± 1.0
-05 S 2013/10/4 3.3 ± 0.4 8.4 ± 0.8 11.7 ± 0.9 7.8 ± 0.9 8.9 ± 0.9 16.7 ± 1.3 1.50 0.872 ± 0.135 B 2013/10/4 2.2 ± 0.3 5.6 ± 0.5 7.8 ± 0.6 5.1 ± 0.8 6.0 ± 0.5 11.1 ± 0.9 0.864 ± 0.150 38 S 2016/7/12 1.2 ± 0.5 7.1 ± 0.9 8.3 ± 1.1 7.0 ± 3.0 8.0 ± 1.0 15.0 ± 3.2 3.10 0.874 ± 0.392
B 2016/7/12 nd 4.3 ± 0.7 4.3 ± 0.7 - 4.8 ± 0.7 4.8 ± 0.7
-Center of Tokyo Bay 68 S 2014/3/25 4.9 ± 0.5 13.1 ± 1.0 18.0 ± 1.1 13.6 ± 1.3 14.0 ± 1.1 27.6 ± 1.7 2.71 0.972 ± 0.120 B 2014/3/25 2.0 ± 0.3 4.3 ± 0.6 6.3 ± 0.7 5.6 ± 0.8 4.6 ± 0.7 10.2 ± 1.1 1.210 ± 0.252 J S 2015/11/14 0.5 ± 0.4 1.9 ± 0.5 2.4 ± 0.7 2.3 ± 2.2 2.1 ± 0.6 4.4 ± 2.2 0.66 1.075 ± 1.061 B 2015/11/14 0.7 ± 0.5 2.8 ± 0.6 3.5 ± 0.8 3.5 ± 2.4 3.1 ± 0.7 6.6 ± 2.5 1.122 ± 0.795 Sumidagawa M1 S 2016/3/24 1.4 ± 0.6 6.5 ± 0.8 7.9 ± 1.0 7.9 ± 3.4 7.3 ± 0.9 15.1 ± 3.6 1.083 ± 0.495 M2 2016/3/24 0.4 ± 0.7 3.2 ± 0.7 3.6 ± 0.9 2.2 ± 3.7 3.6 ± 0.7 5.8 ± 3.7 0.627 ± 1.037 Tamagawa T1 S 2016/3/24 0.3 ± 0.4 2.6 ± 0.7 2.9 ± 0.8 1.6 ± 2.0 2.9 ± 0.8 4.5 ± 2.2 0.544 ± 0.702 T2 2016/3/24 0.5 ± 0.6 3.3 ± 0.7 3.8 ± 0.9 2.9 ± 3.2 3.7 ± 0.8 6.6 ± 3.3 0.784 ± 0.877 Tsurumigawa Z1 S 2016/3/24 0.6 ± 0.6 3.6 ± 0.9 4.2 ± 1.1 3.4 ± 3.4 4.0 ± 1.0 7.4 ± 3.5 0.851 ± 0.871 Z2 2016/3/24 0.6 ± 0.4 4.3 ± 0.7 4.9 ± 0.8 3.4 ± 2.1 4.8 ± 0.8 8.2 ± 2.3 0.720 ± 0.461
The corrected value was radioactive decay corrected based on the value of March 16, 2011. The134Cs/137Cs activity ratio was calculated as a weighted average value without the data for counting
error more than 30%. S: Surface water, B: Bottom water above 1 m from seabed. Activity ratio of the surface layer to the bottom layer (S/B) was calculated with the radioactive decay corrected values.
https://doi.org/10.1371/journal.pone.0193414.t002
Tokyo
Bay
pollution
|
https://doi.or
g/10.137
1/journal.po
ne.01934
14
March
1,
conforms to the radiocesium distribution in the sediments of these points. Surface and bottom seawater was sampled from the Old-Edogawa estuary to the center of the bay, but the ratio of the134+137Cs activity in the surface and bottom water was 2.05±0.91 (n = 15), excluding Point J in the center of the bay, showing that the activity was approximately twofold higher in the surface water than in the bottom water. This means that the radiocesium flowed into Tokyo Bay via river water. Moreover, the radioactivity ratio of134Cs/137Cs was 0.893±0.025 (n = 51). It was thought that the water still contained 1 to 2 mBqL-1of137Cs as background in Japan,
owing to global fallout [32].
Spatiotemporal distribution of radiocesium in the river sediment of
Old-Edogawa, Old-Edogawa, and Sakagawa
In the Sakagawa (Fig 2), which converges with the middle Edogawa, the weighted average 134+137Cs activity was 3630
±11 Bqkg-1(n = 11), whereas in Edogawa, it was 170±2 Bqkg-1
(n = 20) upstream from Sakagawa and 473±3 Bqkg-1(n = 14) downstream from Sakagawa.
As the results of the aircraft monitoring [2] in Figs1and2clearly show, the forested zone in Gunma Prefecture upstream on Tonegawa River was also contaminated with radiocesium at 60 to 300 kBqm-2. However, upstream in Edogawa after it diverges from Tonegawa, the
134+137Cs activity was low in both the sediment and water at Point E4. Therefore, it considered
that the radiocesium-contaminated area in upstream Tonegawa is not an important radioce-sium source supplying Tokyo Bay.
The Matsudo Weir is installed about 100 m downstream from Point S1 and is normally closed to adjust the flow rate of the Sakagawa water. This means that contaminated suspended materials flowing down from the Sakagawa catchment basin is deposited at the point where the flow velocity is low. However, this weir was opened during the Kanto-Tohoku heavy rain-fall event from September 9 to 11, 2015 [33,34], and the sediment deposited upstream of the weir flowed out into the confluence with Edogawa.
Fig 5. Temporal changes in the vertical distribution of134+137Cs in the sediment core at Point S1.The core samples were collected on (a)
April 29, 2014; (b) November 13, 2015; and (c) June 25, 2016. When the weir was opened because of the Kanto-Tohoku heavy rainfall event. A large proportion of the contaminated sediment deposited at Point S1 flowed out. The period of decontamination work in Kashiwa City in the Sakagawa catchment area as shown in “Begin” and “End” of Fig 5A [35].
The core sampled on April 29, 2014 (Fig 5A,S3 Table) shows a record of the vertical distri-bution of radiocesium from before the FDNPP accident. If it is presumed that the 38 to 40 cm layer in which134Cs was detected is the layer was deposited immediately after the accident, the rate of deposition of this sediment is 1.0 cmmonth-1. Thus, the sediment layer deposited in
October 2011, when decontamination work started in Kashiwa City [35], which is in the catch-ment basin of Sakagawa, is the sedicatch-ment layer from 32 to 34 cm. This decontamination work was completed in December 2012, which corresponds to the layer from 14 to 16 cm. For this reason, the vertical distribution of134+137Cs, shown inFig 5A, presumably is sediment with a record of contaminated soil from the high contamination zone accompanied by a discharge of contaminated sludge caused by the decontamination work in Kashiwa City. Some of the decontamination wastewater that does not receive treatment flows into Sakagawa, and it is highly likely that this contaminated sludge was deposited at Point S1. In a core sampled at the same point on November 13, 2015, three months after the Kanto-Tohoku heavy rainfall event, the high contamination sediment layer had disappeared, but new contaminated sediment had been deposited (Fig 5B). The sedimentation rate at Point S1 after the flood was 2.2 cmmonth-1,
suggesting that the sedimentation environment had changed under the effects of the flood. Another core sampled in July 2016 showed a sedimentation rate of 2.2 cmmonth-1, suggesting
that, similarly to the core after the flood (Fig 5B), the134+137Cs activity was a constant value of about 2,000 Bqkg-1(Fig 5C). This implies that contaminated soil has been flowing constantly
into Sakagawa from the high contamination zone around Kashiwa, and thus is a supply source of radiocesium that has accumulated in the Old-Edogawa estuary in Tokyo Bay.
Discussion
Importance of Sakagawa River as a radiocesium source supplying Tokyo
Bay
As shown inFig 2, the radiocesium activity of the sediments in the Sakagawa, Edogawa and Old-Edogawa rivers is higher than that in the Old-Edogawa upstream. Furthermore, it is suggested from Fig 5that contaminated soils flowing in Sakagawa from the high contaminated zone around
Fig 6. Temporal changes in the estimated flux of134+137Cs to the sediment at Point S1.The radioactive decay curve
of134+137Cs was calculated assuming that the activities of134Cs and137Cs were equal immediately after the FDNPP accident [28–30].
Kashiwa City are being transported to Tokyo Bay through these rivers. In other words, the origin of radiocesium contamination in Tokyo Bay is polluted soil in the high contaminated zone, and it can be thought that the Edogawa water system plays an important role in its transportation.
Fig 6(S7 Table) shows the flux of the134+137Cs under the sediments at Point S1 calculated fromFig 5(S3 Table). The estimated flux immediately after the accident was about 1.0 kBq
m-2day-1and had decreased to about 0.5 kBqm-2day-1by July 2016.Fig 6also shows the flux
estimated for each the sampling period of each sediment core, and the flux decay corrected based on the value of March 16, 2011. For both, the radioactive decay curve of134+137Cs con-forms closely, and from this fact as well, it was assumed that a constant supply of radiocesium currently continues at Point S1.
Contamination via global fallout of
137Cs in Tokyo Bay sediment before the
FDNPP accident
Compared with the water samples, the radiocesium activity in the present soil and sediment samples before the FDNPP accident is extremely low; therefore, we did not consider the back-ground in this study.
Global fallout via atmospheric nuclear testing contributed137Cs to the environment before the FDNPP accident. Precipitation of the global fallout137Cs from the atmosphere was 6.56 kBqm-2from 1954 to 1985 (before the Chernobyl accident), in Chiba City, located in east of
Tokyo Bay (S8 Table) [36]. The inventory of the global fallout137Cs in the sediment of central Tokyo Bay was presumed from 0.37 to 0.51 kBqm-2[37]. However, it is possible these values
are underestimates, as the cores were too short. The global fallout137Cs in the initial stage probably was not measured. On the other hand, we also found a record of the global fallout 137Cs in the core collected from Points 36 and J in the center of Tokyo Bay. The inventories
were 0.80 and 0.71 kBqm-2, respectively, for Points 36 and J (S8 Table). From our data, it was
estimated that 11 to 12% of the global fallout137Cs precipitation observed in Chiba City from 1954 to 1985 was accumulated in the Tokyo Bay sediment. However, as shown inTable 2, it is presumed from the134Cs/137Cs activity ratio that137Cs due to the global fallout and the fallout from the Chernobyl accident is significant in river water and seawater in the Tokyo Bay water system.
Inventory and flux of radiocesium owing to the FDNPP accident in the
sediment of Point D in the Old-Edogawa estuary
Based on the vertical distribution of radiocesium in the core sediment deposits at Point D, as shown inFig 4, the changes over time in the activity, inventory, and flux of the134+137Cs in the sediment were analyzed. The results are shown inFig 7(S9 Table). The radioactive decay curve of the134+137Cs activity leads to the hypothesis that the134Cs/137Cs activity ratio emitted during the accident was 1.0 [28–30]. The134+137Cs activity of surface sediment presumably reflects the level of contamination of the catchment basin, which is the supply source of radio-cesium.Fig 7Ashows the average radioactivity of134+137Cs in the sediment layers contami-nated by radiocesium and in the top 5 cm of the sediments. In both the surface and in the contaminated layers, the maximum values appeared at the end of 2012, about two years after the accident. Afterwards, the134+137Cs activity of sediments decreased until its value matched
Table 3. Balance of the radiocesium precipitated in the Edogawa watershed.
Region Areaa 134+137Cs Activity Ratio for Total Amount
Inventory Each Amount Total Amount km2 kBq
m-2 TBq TBq %
Source
Edogawa Upstream A 50 10 0.50 8.33
Kashiwa City B 20 80 1.60
Edogawa Midstream C 65 45 2.93
Edogawa Downstream D 80 20 1.60
Nakagawa E 85 20 1.70
Sink
Old-Edogawa Estuary X 10 131 1.31 1.53 15.7
Offshore from Area X Yb 40 5.52 0.22 2.6
Central Bay Zb, Vb 330 0.73 0.24 0.24 2.9
Sumidagawa Estuary Wb 20 5.55 0.11 0.11 1.3
The134+137Cs activities are shown the values at July 2016 as the radioactive decay corrected on March 16, 2011. The inventory of source was estimated from the result of the MEXT aircraft monitoring [2]. The inventory of sink was calculated from the analytical values of core sediments.
a
Areas shown inS2 Fig. b
It is thought that the radiocesium flowing in from other than the Edogawa watershed also accumulates.
the activity anticipated from the radioactive decay curve.Fig 7Bshows the inventory and change over time of134+137Cs in sediments and the flux estimated from the inventory. The inventory immediately after the accident was about 20 kBqm-2, but five years later in 2016, it
had increased to about 100 kBqm-2. Theoretically, by that time, the134+137Cs activity should
have decayed to 53% of its value immediately after the accident, yet the inventory had greatly increased. The flux was 0.13 kBqm-2day-1immediately after the accident, but in 2016, it had
decreased to 0.053 kBqm-2day-1(19 kBqm-2yr-1). Beginning in 2014, when it is assumed
that the inflow of radiocesium to Point D had become constant, the flux also conformed almost exactly to the values anticipated, based on the radioactive decay of134+137Cs. This suggests that, even now, radiocesium continues to constantly flow into Tokyo Bay.
Balance of the radiocesium flowing into Tokyo Bay from the Edogawa
watershed
Based on the analytical results, the balance of radiocesium in the Edogawa water system and in Tokyo Bay sediment are shown inTable 3(S2 Fig). Under the activity value standardized to that of March 16, 2011, the quantity of134+137Cs precipitated in the catchment basin of the Edogawa water system was 8.33 TBq per the results of aircraft monitoring [2]. Judging from the results of the analysis of the core samples, the average inventory of134+137Cs in Area X, which has an area of 10 km2and is located about 8 km southeast of Chiyoda-Ward in central Tokyo, was 131 kBqm-2(n = 10), and the total inventory of134+137Cs was 1.31 TBq. In July
2016, about 70% of the radiocesium deposited in the study area of Tokyo Bay accumulated in Area X. Similarly, the average inventory in Area Y, which is 40 km2in area, was 5.52 kBqm-2
(n = 11), and the total inventory was 0.22 TBq. Assuming that all the radiocesium deposited in Area X was supplied from the Edogawa water system, about 16% of radiocesium precipitated in the catchment basin during the five years following the accident had moved to Area X. This value is larger than the 11 to 12% global fallout measured in the center of Tokyo Bay, but because Area X is located in the estuary, it is reasonable that it has a relatively large value. Fur-thermore, the contaminated particles that flowed out during the decontamination work in the highly contaminated zone also may have caused this value to be higher. The average flux in sediment of Area X for 5.4 years (from the FDNPP accident to July 2016) was 0.067 kBqm
-2
day-1(24.5 kBqm-2yr-1), so 0.245 TBq of radiocesium continues to flow into Area X every
year. This value is consistent with the value for July 2016 of the flux estimated at Point D, off the coast of the river mouth, as shown inFig 7. The average radiocesium flux of Area X in July 2016 from the FDNPP accident is about 15 times the maximum value of 1.59 kBqm-2yr-1of
the global fallout137Cs, found in 1963 in Chiba City [36].
Estimation of the sedimentation process of radiocesium in the Edogawa
water system and Tokyo Bay
deposited. The fine particles are not found in sediments at Points 02 and D of the estuary where seawater and river water mix. This suggests that coagulated deposition of colloidal parti-cles by salting out did not occur. Since the average particle size of the sediment decreases from the estuary towards the offshore, it is shown that sedimentary substances flowing from the river are accumulating first from large particles as they diffuse through the sea water.
It is well known that cesium cations is inserted between layers of 2:1:1 type clay minerals like vermiculite and strongly absorbs by ion exchange [42–47]. Therefore, radiocesium
Fig 8. Relationship between the134+137Cs activity and the grain size of surface sediments in the Tokyo Bay water system.So: Soil in the Sakagawa catchment area, S: Sakagawa river, E: Edogawa and Old-Edogawa rivers, X: Old-Edogawa estuary, Y: Off the Old-Edogawa estuary, Z: Center of Tokyo Bay, V: Tamagawa estuary, W: Sumidagawa estuary. If the radiocesium is adsorbed on the suspended materials in water owing to the grain size effect [56–58], the relationship should obey the inverse square law. The vertical arrow in the Fig 8A indicates the range of the radiocesium background referred from the JCG report [23].
precipitated from atmosphere on ground surfaces is absorbed and held by clay minerals in the soil. Recently, it has been confirmed directly that radiocesium released from the FDNPP is adsorbed by the clay mineral using a new technic such as EXAFS and NMR [48–50]. More-over, fine particles with a particle size of 10μm or less containing radiocesium at high activity are found in various places of eastern Japan [51–55], but we believe that washout due to rainfall plays an important role in precipitation on the ground even if radiocesium is scattered in the atmosphere as gaseous or fine particles. It can be hypothesized that in the greater Tokyo region, radiocesium precipitated on ground surfaces was absorbed by the soil and transported to the Tokyo Bay estuary by such a mechanism, underwent coagulating sedimentation via the salting out effect as it mixed with seawater [56,57], and then accumulated in the estuary sedi-ment. However, such a mechanism cannot explain the difference in the sedimentation pro-cesses of radiocesium and that of heavy metals in Tokyo Bay (Fig 8,S6 Table,S3 Fig).
Assuming that the background lead concentration in the Tokyo Bay sediment older than 1800s is about 10 mgkg-1[59], the anthropogenic lead concentration of the sediment was
esti-mated. As shown inFig 8B, a clear grain size effect between the concentrations of lead and the average particle size of the surface sediments in the Tokyo Bay water system has been con-firmed. This indicates that the lead is selectively accumulated in sediments in the center of Tokyo Bay, where the average particle size is relatively small. This phenomenon occurs when anthropogenic lead absorbs onto the surface of suspended particles in water. But the slope is less than two. As many rivers flow into Tokyo Bay, this may be due to the dilution effect of sus-pended particles with low anthropogenic lead contamination. Moreover, as the particle size increases, it deviates slightly from the inverse square law. This is probably due to the relatively higher lead concentration of constituent components of sediments than anthropogenic lead in large particles. Such a tendency was also observed with zinc and mercury (S6 Table,S4 Fig). If it can be assumed that the deposited particle are spherical, the radiocesium activity should fol-low the inverse square law for the sediment particles [56–58]. However, a negative correlation between them is not observed.
As shown inFig 8, the average particle size in the soil of the high contamination zone was 20 to 100μm and the radiocesium activity was in the range of 1000 to 35000 Bqkg-1. It is
believed that this soil in the high contamination zone is the source of radiocesium contamination in Tokyo Bay. When it flows into Sakagawa, the average particle size is separated into 8 to 20μm (4000 to 35000 Bqkg-1) and 250 to 350μm (1500 to 6000 Bqkg-1) size classes. The larger
is a possibility of coagulation and precipitation owing to the salting out effect of seawater [42,56,57], but from our results regarding this period, no such effect was found.
Conclusions
Changes in the radiocesium contamination of the Tokyo Bay sediment surrounded by the Tokyo metropolitan area were discussed for five years after the FDNPP accident. Most of radio-cesium flowed from the high contaminated zone in the northeastern part of the Tokyo metro-politan area through the river into the Old-Edogawa estuary inner part of Tokyo Bay and was accumulated without diffusing to the center of the bay. The radioactivity increased from imme-diately after the accident and decreased following the theoretical radioactive decay after showing the maximum value of 547 Bqkg-1at end of 2012. The average inventory of radiocesium in the
Old-Edogawa estuary increased to 104 kBqm-2in July 2016. At that time about 70% of the
radiocesium deposited in the study area of Tokyo Bay had accumulated in the Old-Edogawa sediment. On the other hand, the inventory of radiocesium in the central bay was 0.46 kBqm-2.
Radiocesium may be transported to Tokyo Bay as contaminated soil particles through rivers such as Sakagawa, Edogawa, and Old-Edogawa from the high contaminated zone in the north-eastern part of the Tokyo metropolitan area. Observation results suggested that the river plays an important role in transporting radiocesium from pollution sources. Furthermore, it is con-sidered that the radiocesium precipitated from the atmosphere was adsorbed onto soil parti-cles. The contaminated particles flow out into the river, but they selectively deposited and accumulated in the estuary of Tokyo Bay where the flow velocity of the river water decreases. Therefore, it was presumed that it did not diffusing to the center of the bay.
It is important to recognize that, as the present study has indicated, radiocesium from the FDNPP accident which was deposited in distant watersheds is still flowing into Tokyo Bay, and the consequences are not fully understood. Continued and careful long-term monitoring of these environmental radionuclides is warranted. In the other words, Tokyo Bay plays the role of a sink for radioactive contaminants discharged in the greater Tokyo region.
Supporting information
S1 Fig. Evidence that flood sediment deposited at Point D.Coastal flood sediments have high water content and small particle size, so their apparent density is small. The cumulative mass of the 8 to 22 cm layer of the core collected in November 2015 immediately after the Kanto-Tohoku heavy rainfall event is clearly lower than that of the other cores. It can be thought that this is a trace of the flood sedimentary layer [31].
(DOCX)
S2 Fig. Classification region map for radiocesium balance estimation in Tokyo Bay and Edogawa watershed.The area surrounded by the red line shows the Edogawa river catchment basin. Area E indicates the Nakagawa river catchment basin of a branch of Edogawa.
(PPTX)
S3 Fig. Change in the particle size distribution of surface sediments in the Tokyo Bay water system.The green arrow indicates the average particle diameter.
(PPTX)
S4 Fig. Relationship between heavy metal and particle size of surface sediments in the Tokyo Bay water system.S: Sakagawa river, E: Edogawa and Edogawa rivers, X: Old-Edogawa estuary, Y: Off the Old-Old-Edogawa estuary, Z: Center of Tokyo Bay, V: Tamagawa estu-ary, W: Sumidagawa estuary.
S5 Fig. Photographs of the sampling location and sampling sediment.(a) Viewing the Tokyo metropolitan from Area X. (b) Core sampling by a diver. (c)-(e) Sediment core in seabed and the collected core sample. (f), (g) Surface sediment collected by an Ekman-Birge sampler.
(PPTX)
S1 Table. Radiocesium activity and particle size in the sediment samples collected from Tokyo Bay.Corrected values were corrected for radioactive decay on March 16, 2011. (XLSX)
S2 Table. Radiocesium activity and particle size in the sediment samples collected from Edogawa River.Corrected values were corrected for radioactive decay on March 16, 2011. (XLSX)
S3 Table. Radiocesium activity, inventory, and particle size in the sediment samples col-lected from Sakagawa River.Corrected values were corrected for radioactive decay on March 16, 2011.
(XLSX)
S4 Table. Radiocesium activity, anthropogenic heavy metal concentration, and particle size in the soil collected around Kashiwa City.Corrected values were corrected for radioac-tive decay on March 16, 2011. The background concentration of heavy metal was assumed to be Zn 100 mgkg-1, Hg 40μgkg-1, and Pb 10 mgkg-1.
(XLSX)
S5 Table. Geographic coordinates of sampling points.Latitude and longitude of land sam-pling points were not measured.
(XLSX)
S6 Table. Radiocesium activity, anthropogenic heavy metal concentration, and particle size in the surface sediment collected from the Tokyo Bay water system.a: X (Old-Edogawa estuary), Y (Off the Old-Edogawa estuary), Z (Center of Tokyo Bay), V (Tamagawa estuary), W (Sumidagawa estuary). b: Value on sampling date. c: Corrected values were corrected for radioactive decay on March 16, 2011. d: Weighted average value of the decay corrected radio-cesium activity for multiple samples from the same site. e: Ratio for the decay corrected value. f: Value for samples whose counting error of the decay corrected total radiocesium activity was within 5%. The background concentration of heavy metal was assumed to be Zn 100 mgkg-1,
Hg 40μgkg-1, and Pb 10 mgkg-1.
(XLSX)
S7 Table. Estimated radiocesium flux at Point S1 in Sakagawa.a: Corrected values were cor-rected for radioactive decay on March 16, 2011. The values in parentheses are the detected val-ues for the sampling date. b: Contaminated sediment flowed out owing to the Kanto-Tohoku heavy rainfall event of September 9 to 11, 2015. c: Sampling interval.
(XLSX)
S8 Table. Estimated inventory of the global fallout137Cs recorded in the core sediment at Points 36 and J in Tokyo Bay and the annual precipitation of global fallout137Cs at Chiba City.Sedimentary age of the sediment was estimated by the210Pb method. a: The activity was corrected for radioactive decay in the sedimentary age. b: The value measured at Chiba City by the NIRS and published by the JCAC [36].
S9 Table. Flux and inventory of radiocesium in the sediment collected at Point D of the Old-Edogawa estuary.a: Including the flood-deposited layer of 8 to 22 cm (average activity: 170 Bqkg-1). b: Including the flood-deposited layer in the core. c: Weighted average of ratio of
134Cs to137Cs in the sediment of each layer.
(XLSX)
Acknowledgments
The authors are deeply grateful to Dr. K. Jin of Hokkaido University for appropriate advice on this manuscript. Ms. Y. Sakai and Mr. S. Yokoi helped us measure and analyze the samples and process the data. This work was supported by JSPS KAKENHI (B) Grant Numbers 24310014 (HY), 26289155 (HY, RA), and 26303004 (RA, HY) and MEXT KAKENHI Grant Number 24110006 (YY) and Grants-in-aid for JSPS Research Fellow 15J10109 (MI).
Author Contributions
Conceptualization:Hideo Yamazaki.Formal analysis:Masanobu Ishida, Ryoichi Hinokio, Yosuke Alexandre Yamashiki, Ryokei Azuma.
Investigation:Hideo Yamazaki, Masanobu Ishida, Yosuke Alexandre Yamashiki.
Visualization:Masanobu Ishida.
Writing – original draft:Masanobu Ishida.
Writing – review & editing:Hideo Yamazaki.
References
1. MLIT (Ministry of Land, Infrastructure, Transport and Tourism of Japan). Overview of Tokyo Bay and
the catchment area. 2005. [in Japanese] Available from:http://www.ktr.mlit.go.jp/chiiki/chiiki00000044.
html.
2. MEXT (Ministry of Education, Culture, Sports, Science and Technology of Japan). Results of survey
and research on the distribution status of radioactive substances released by the Tokyo Electric Power Company Fukushima Daiichi Nuclear Power Station accident. 2012. [in Japanese] Available from:
http://radioactivity.nsr.go.jp/ja/contents/6000/5233/24/5233_20120313_20120615_rev20130701.pdf.
3. GSI (Geospatial Information Authority of Japan). Extension site of distribution map of radiation dose,
etc. 2014. Available from:http://ramap.jmc.or.jp/map/eng/.
4. NDJ (The National Diet of Japan). The Official Report of the Fukushima Nuclear Accident Independent
Investigation Commission. 2012. Available from:https://www.nirs.org/wp-content/uploads/fukushima/
naiic_report.pdf.
5. Investigation Committee on the Accident at the Fukushima Nuclear Power Stations of Tokyo Electric
Power Company. Final Report. 2012. Available from:
http://www.cas.go.jp/jp/seisaku/icanps/eng/final-report.html.
6. The Independent Investigation on the Fukushima Nuclear Accident. The Fukushima Daiichi Nuclear
Power Station Disaster: Investigating the Myth and Reality. London: Routledge; 2014.
7. IAEA (International Atomic Energy Agency). The Fukushima Daiichi Accident. Report by the Director
General. 2015.
8. Kakehi S, Kaeriyama H, Ambe D, Ono T, Ito S, Shimizu Y, et al. Radioactive cesium dynamics derived
from hydrographic observations in the Abukuma River Estuary, Japan. J. Environ. Radioact. 2016; 153: 1–9.https://doi.org/10.1016/j.jenvrad.2015.11.015PMID:26698826.
9. Yamasaki S, Imoto J, Furuki G, Ochiai A, Ohnuki T, Sueki K, et al. Radioactive Cs in the estuary
sedi-ments near Fukushima Daiichi Nuclear Power Plant. Sci. Total Environ. 2016; 551–552: 155–162.
10. Saegusa H, Ohyama T, Iijima K, Onoe H, Takeuchi R, Hagiwara H. Deposition of radiocesium on the
river flood plains around Fukushima. J. Environ. Radioact. 2016; 164: 36–46.https://doi.org/10.1016/j.
jenvrad.2016.04.020PMID:27414488.
11. Tsuruta H and Nakajima T. Radioactive materials in the atmosphere released by the accident of the
Fukushima Daiichi Nuclear Power Plant. Chikyukagaku (Geochemistry). 2012; 46:99–111.https://doi.
org/10.14934/chikyukagaku.46.99[in Japanese with English abstract].
12. Ishida M and Yamazaki H. Radioactive contamination in the Tokyo metropolitan area in the early stage
of the Fukushima Daiichi Nuclear Power Plant (FDNPP) accident and its fluctuation over five years.
PLOS ONE. 2017; 12: 1–18.https://doi.org/10.1371/journal.pone.0187687PMID:29136641.
13. USNRC (US Nuclear Regulatory Commision). Programmatic Environmental Impact Statement related
to decontamination and disposal of radioactive wastes resulting from March 28, 1979 accident Three
Mile Island Nuclear Station, Unit 2. 1989. Available from:https://ntrl.ntis.gov/NTRL/dashboard/
searchResults/titleDetail/NUREG0683SUPN3.xhtml.
14. NSAC (Nuclear Science Advisory Committee). Analysis of Three Mile Island-Unit 2 Accident.
NSAC-80-1. 1980. Available from:http://www.iaea.org/inis/collection/NCLCollectionStore/_Public/13/677/
13677904.pdf
15. IAEA (International Atomic Energy Agency). Environmental Consequences of the Chernobyl Accident
and their Remediation: Twenty Years of Experience, Report of Chernobyl Forum Expert Group ‘Envi-ronment’. IAEA Radiological Assessment Reports Series. 2006.
16. Saito-Kokubu Y, Yasuda K, Magara M, Miyamoto Y, Sakurai S, Usuda S, et al. Geographical
distribu-tion of plutonium derived from the atomic bomb in the eastern area of Nagasaki. J. Radioanal. Nucl.
Chem. 2007; 273: 183–186.https://doi.org/10.1007/s10967-007-0733-9
17. Saito-Kokubu Y, Esaka F, Yasuda K, Magara M, Miyamoto Y, Sakurai S, et al. Plutonium isotopes
derived from Nagasaki atomic bomb in the sediment of Nishiyama reservoir at Nagasaki, Japan. Int. J.
Appl. Radiat. Is. 2007; 65: 465–468.https://doi.org/10.1016/j.apradiso.2006.10.010PMID:17150366.
18. Saito-Kokubu Y, Yasuda K, Magara M, Miyamoto Y, Sakurai S, Usuda S, et al. Depositional records of
plutonium and137Cs released from Nagasaki atomic bomb in sediment of Nishiyama reservoir at
Naga-saki. J. Environ. Radioact. 2008; 99: 211–217.https://doi.org/10.1016/j.jenvrad.2007.11.010PMID:
18171596.
19. Gallego E. MUD. A model to investigate the migration of137Cs in the urban environment and drainage
and sewage treatment systems. J. Environ. Radioact. 2006; 85: 247–264.https://doi.org/10.1016/j.
jenvrad.2004.10.017PMID:16095773.
20. USGS (US Geological Survey). Distribution of radionuclides in bottom sediments of the Columbia River
estuary. Geological Survey Professional Paper 433–1. 1973. Available from:https://pubs.usgs.gov/pp/
0433l/report.pdf.
21. Bera G, Yeager KM, Shim M, Shiller AM. Anthropogenic stable cesium in water and sediment of a
shal-low estuary, St. Louis Bay, Mississippi. Estuar. Coast. Shelf Sci. 2015; 157: 32–41.https://doi.org/10. 1016/j.ecss.2015.02.004
22. NRA (Nuclear Regulation Authority, Japan). Readings of Sea Water at Tokyo Bay. 2013. Available
from:http://radioactivity.nsr.go.jp/en/list/290/list-1.html.
23. JCG (Japan Coast Guard). Report of Radioactivity Surveys, Results of Surveys in 2016 [in Japanese].
Available from:http://www1.kaiho.mlit.go.jp/KANKYO/OSEN/housha.html.
24. Koibuchi Y. Tracing fine-grained sediment transport around Tokyo Bay using 134 and
cesium-137 originating from Fukushima Daiichi Power Plant. In: Rodriguez G.R., editor. Coastal Processes III. UK, WIT press; 2013. p. 191–201.
25. Aoyama M and Hirose K. Analysis of Environmental Radionuclides In: Povinec PP, editor. Radiometric
Determination of Anthropogenic Radionuclides in Seawater. London. Elsevier. 2008. p. 137–162.
https://doi.org/10.1016/S1569-4860(07)11004-4
26. Yasuhara M and Yamazaki H. The impact of 150 years of anthropogenic pollution on the shallow marine
ostracode fauna, Osaka Bay, Japan. Mar. Micropaleontol. 2005; 55: 63–74.https://doi.org/10.1016/j.
marmicro.2005.02.005
27. Gohda S, Yamazaki H, Hirata M, Nagasawa T. XRF analysis of rock and sediment using standard rock
samples. BUNSEKI KAGAKU (Analytical Chemistry). 1987; 36:199–203. [in Japanese with English abstract].
28. Chaisan K, Smith JT, Bossew P, Kirchner G, Loptev GV. Worldwide isotope ratios of the Fukushima
release and early-phase external dose reconstruction. Sci. Rep. 2013; 3: 2520.https://doi.org/10.1038/
srep02520PMID:24018776.
29. Komori M, Shozugawa K, Nogawa N, Matsuo M. Evaluation of radioactive contamination caused by