The evolutionary analysis of the vertebrate
two-round whole genome duplications
Masatoshi Matsunami
DOCTOR OF PHYLOSOPHY
Department of Genetics,
School of Life Science,
The Graduate University for Advanced Studies
(SOKENDAI)
i
Acknowledgements
My study would not have been possible without help of others. Firstly, I would like to thank my academic supervisor, Naruya Saitou who provide me many helpful discussions, suggestions and comments. I would like to appreciate my committee for helping me to achieve this degree. I thank all the member of Saitou lab, past and present, especially Yosuke Kawai who taught me the basic of programming, Yukuto Sato who provide me helpful discussion and an opportunity to analyze the data of second generation sequencing machine, and Kiyoshi Ezawa who gave me constructive criticisms and advices. I also thank Yoichi Nakatani for giving the paralog data, Takahiko Kawasaki and Yasunori Murakami for lamprey samples, and the member of Fujiyama lab for the help of sequencing.
I appreciate Shigehiro Kuraku and the members of his lab for natural history of the genome, Axel Meyer and the members of his lab at the Universität Konstanz. They allowed me short stay and gave valuable advises for my research.
Lastly, I would also like to express my gratitude to my family and friends for their moral and financial support and warm encouragement.
ii
TABLE OF CONTENTS
Acknowledgements ... i
List of Figures ... vii
List of Tables ... ix
Abbreviations ... xi
ABSTRACT ... xii
CHAPTER 1: General Introduction ... 1
1.1 Mode of duplication ... 1
1.2 History of genome duplication study ... 2
1.3 Genome duplications of vertebrates ... 4
1.4 Hox clusters are the hallmarks of the 2R WGD ... 5
1.5 Vertebrate genome evolution after the 2R WGD ... 7
1.6 Questions of this study ... 10
CHAPTER 2: Evolution of Conserved Non-Coding Sequences Within the Vertebrate Hox Clusters Through the Two-Round Whole Genome Duplications . 14 2.1 Introduction ... 14
iii
2.2 Materials and Methods ... 18
2.2.1 Identification of vertebrate Hox CNSs ... 18
2.2.2 Analysis of paralogous CNSs ... 20
2.2.3 Comparison with amphioxus Hox CNSs ... 20
2.3 Results ... 23
2.3.1 Orthologous CNSs within vertebrate Hox clusters ... 23
2.3.2 Paralogous CNSs among Hox clusters ... 29
2.3.3 Comparison between vertebrate CNSs and amphioxus CNSs within Hox clusters ... 31
2.4 Discussion ... 32
CHAPTER 3: Phylogenetic Network Analysis of Vertebrate Hox Genes ... 40
3.1 Introduction ... 40
3.2 Materials and Methods ... 43
3.3 Results ... 46
3.3.1 Ortholog/Paralog relation of posterior Hox genes ... 46
3.3.2 Phylogenetic analysis of vertebrate Hox genes ... 47
iv
3.4 Discussion ... 54
CHAPTER 4: Paralogous Conserved Non-coding Sequences in Vertebrates Derived from the Ancient Whole Genome Duplications ... 58
4.1 Introduction ... 58
4.2 Materials and Methods ... 61
4.2.1 Identification of conserved synteny blocks after the 2R WGD ... 61
4.2.2 Identification of paralogous CNSs ... 62
4.2.3 Ontology analysis of paralogous CNS-harboring genes ... 68
4.2.4 Estimation of genes and CNSs loss rate after the 2R WGD ... 69
4.3 Results ... 71
4.3.1 Identification of orthologous CNSs... 71
4.3.2 Highly conserved synteny blocks ... 72
4.3.3 Paralogous CNSs ... 74
4.3.4 Location of CNSs and paralogous CNS-harboring genes ... 75
4.3.5 Gene loss rate after the 2R WGD ... 81
4.4 Discussion ... 84
v
CHAPTER 5: De novo transcriptome sequencing of Japanese brook lamprey ... 90
5.1 Introduction ... 90
5.2 Materials and Methods ... 92
5.2.1 Sample preparation ... 92
5.2.2 Sequencing and assembly... 95
5.2.3 Phylogenetic analysis ... 96
5.3 Results ... 97
5.3.1 Contigs ... 97
5.3.2 Orthologous gene clustering... 99
5.3.3 Phylogenetic reconciliation ... 108
5.4 Discussion ... 110
CHAPTER6: Inferring the timing of the 2R WGD from lamprey genome data .. 117
6.1 Introduction ... 117
6.2 Materials and Methods ... 119
6.2.1 Homologous gene clustering ... 119
6.2.2 Calculation of branch length ... 122
vi
6.3 Results ... 122
6.4 Discussion ... 127
CHAPTER 7 ... 129
General Discussions and Conclusions ... 129
References ... 134
Appendices ... 150
vii
List of Figures
Figure 1.1: Morphological novelty of vertebrate lineages ... 13
Figure 2.1: The schematic diagram of orthologous CNSs and paralogous CNSs among human Hox clusters ... 21
Figure 2.2: Multiple alignments of three TP CNS sequences ... 27
Figure 2.3: The scheme of paralogous conserved bidirectional promoters ... 28
Figure 2.4: The phylogenetic footprinting analysis within chordates ... 33
Figure 2.5: The loss and gain of Hox CNSs during the chordate evolution ... 34
Figure 3.1: The evolution of deuterostome Hox clusters ... 44
Figure 3.2: The phylogenetic network of deuterostome posterior Hox genes ... 48
Figure 3.3: Possible orthology of posterior Hox genes ... 49
Figure 3.4: Reconstruction of the Hox cluster duplication history ... 56
Figure 4.1: Paralogous synteny blocks within human genome ... 64
Figure 4.2: Phylogeny of vertebrate species used in this study ... 66
Figure 4.3: Scheme of Hox-linked paralogous block ... 73
Figure 4.4: Paralogous CNSs shared between POU3F2 and POU3F3 genes ... 80
Figure 4.5: Estimation of loss rate after the 2R WGD ... 82
viii
Figure 5.1: The profile of the Japanese brook lamprey (Lethenteron reissneri) ... 93
Figure 5.2: Distribution of 454 read length ... 102
Figure 5.3: Venn diagram of BLASTX hit of each lamprey against human sequences 105 Figure 5.4: Possible topology of unrooted phylogenetic tree among human, chicken, lamprey and amphioxus ... 106
Figure 5.5: The phylogenetic relationship of species used in this study with the possible timing of the WGD event ... 111
Figure 5.6: Representative Pre-Pre duplicated gene family phylogenetic tree ... 112
Figure 5.7: Representative Post-Post duplicated gene family phylogenetic tree ... 113
Figure 6.1: Three possible scenarios for timings of 2R genome duplications ... 118
Figure 6.2: Pipeline of analysis ... 121
Figure 6.3: Possible topologies of one agnathan and two gnathostome phylogenetic tree ... 123
Figure 6.4: Distribution of internal branch length ... 124
Figure 7.1: Comparison of gene families used for the estimation of relative timing of the 2R WGD ... 132
ix
List of Tables
Table 2.1: Conservation depth of each CNS ... 22
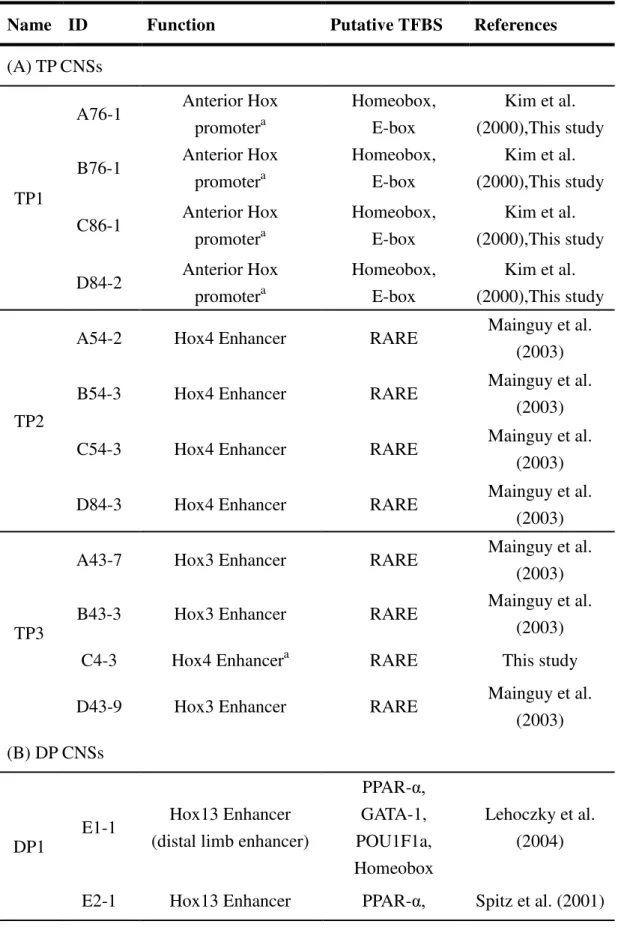
Table 2.2: Possible functions of Tetra (TP) and Di (DP) paralogous CNSs ... 25
Table 3.1: Species used in this study ... 45
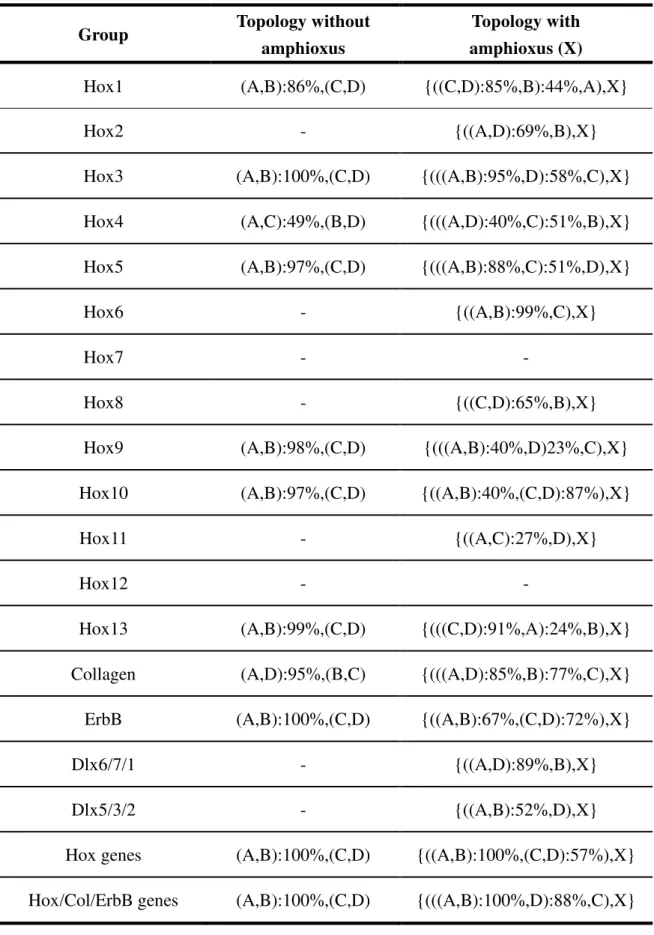
Table 3.2: Topology of each paralogous Hox gene NJ tree ... 51
Table 3.3: Topology of each paralogous Hox gene ML tree ... 52
Table 3.4: Topology of each paralogous Hox gene tree based on networks ... 53
Table 4.1: The number of paralogous CVL ... 64
Table 4.2: Gene and CNS loss pattern of paralogs derived from the 2R WGD ... 70
Table 4.3: List of paralogous CNSs harboring genes ... 77
Table 4.4: Overrepresented gene functions of host genes ... 79
Table 5.1: Status of Sea lamprey data in the SRA database ... 100
Table 5.2: Summary of read assembles ... 101
Table 5.3: The results of BLASTX homology search ... 104
Table 5.4: Summary of orthlogous gene tree topology ... 107
Table 5.5: The results of phylogenetic reconciliation analysis ... 114
Table 6.1: Sequences used in this study ... 120
x
Table 6.2: The results of gene clustering ... 125
xi
Abbreviations
WGD: whole genome duplication SSD: small scale duplication
2R WGD: two-round whole genome duplications CNS: conserved non-coding sequences TFBS: transcription factor binding site TP: tetra-paralogous
DP : di-paralogous
RARE: retinoic acid response element FCS : four cluster sequence
UCE: ultra-conserved element CNE: conserved non-coding element
DDC model: duplication - degeneration – complementation model NGS: next-generation sequencing
xii
ABSTRACT
Two-rounds whole genome duplications (2R WGD) occurred in the vertebrate ancestors, and they generated large numbers of duplicated protein-coding genes and their regulatory elements. These events could contribute to the emergence of vertebrate-specific features. However, the evolutionary impact of the 2R WGD is still unclear. To address this issue, I conducted comprehensive studies on both protein-coding and non-coding sequences found in the conserved synteny blocks generated by the 2R WGD. Such conserved synteny blocks are expected to retain duplicated protein-coding and gene regulatory sequences. Consequently, evolutionary changes or some constraints relating to these blocks would have played important roles in the evolution and diversification of vertebrates. On the basis of this view, I focused on evolution of both protein-coding and non-coding sequences of the vertebrate genomes, especially Hox clusters.
Because a part of gene regulatory elements are expected to be conserved according to their functional importance, evolutionarily conserved non-coding sequences (CNSs) might be good candidates of gene regulatory elements. In addition, portion of the paralogous protein-coding genes retained after the 2R WGD show
xiii
overlapping expression pattern. Therefore, paralogous genes might share gene expression regulatory mechanisms. Paralogous CNSs have possibility to control overlapping expression patterns of those paralogs. Thus, detecting paralogous CNSs and inferring the relation between paralogous gene and CNSs is important to understand evolution after the 2R WGD.
Four or more paralogous Hox clusters exist in vertebrate genomes because of the 2R WGD. The paralogous genes in the Hox clusters show similar expression patterns, implying shared regulatory mechanisms for expression of these genes. Previous studies partly revealed the expression mechanisms of Hox genes. However, cis-regulatory elements that control these paralogous gene expression are still poorly
understood. Toward solving this problem, I searched CNSs within vertebrate Hox clusters. I compared orthologous Hox clusters of 19 vertebrate species, and found 208 intergenic conserved regions. I then searched for CNSs that were conserved not only between orthologous clusters but also among the four paralogous Hox clusters. I found three regions that are conserved among the all four clusters and eight regions that are conserved between intergenic regions of two paralogous Hox clusters. In total, 28 CNSs were identified in the paralogous Hox clusters, and nine of them were newly found in this study. One of these novel regions bears a RARE motif. These CNSs are candidates
xiv
for gene expression regulatory regions among paralogous Hox clusters. I also compared vertebrate CNSs with amphioxus CNSs within the Hox cluster, and found that two CNSs in the HoxA and HoxB clusters retain homology with amphioxus CNSs through the 2R WGD.
The duplication histories of vertebrate Hox clusters are controversial. Under the assumption of the 2R WGD, phylogenies of Hox gene should show a symmetrical topology. However, some previous studies did not support this symmetrical topology. I thus carried out exhaustive phylogenetic analysis of deuterostome Hox genes. First, to identify outgroup genes of each vertebrate Hox paralog group, I inferred the correct ortholog/paralog relationships among deuterostome posterior Hox genes by comparing available Hox genes. Amphioxus Hox9-11 were generated by amphioxus specific tandem duplications. Because vertebrate Hox10-12, and Hox14-15 genes have no counter parts in amphioxus Hox genes, they were probably lost in the amphioxus lineage. Secondly, the duplication histories of vertebrate Hox genes were inferred by constructing phylogenetic trees and phylogenetic networks. My analysis suggested that the ((A,B), (C,D)) topology is most suitable explanation of Hox cluster duplications.
I then carried out genome-wide identification of paralogous CNSs. A sensitive BLAST search of each synteny block revealed 7,924 orthologous CNSs and 309
xv
paralogous CNSs conserved among 8 high quality vertebrate genomes. I newly detected 194 paralogous CNSs. Their locations are biased nearby the transcription factors coding regions shown expression in brain and neural system. The existence of these paralogous CNSs is difficult to explain by previous duplication models. Because these sequences have same transcription factor binding motifs, they might be backup of paralogous gene expression and/or contribute to the interaction between paralogs.
The 2R WGD occurred after the split of the urochordate ancestors but before the diversification of extant gnathostomes (jawed vertebrates). However, there is no clear evidence whether the timing of the 2R WGD is before or after the split of agnathans (jawless vertebrates including lamprey) and gnathostomes. To clarify this problem is highly important for study of vertebrate evolution and development. The lamprey gene data are also useful for molecular function and developmental studies. Thus, I analyzed the mRNA sequences of Japanese brook lamprey (Lethenteron reissneri) and estimated the relative timing of the 2R WGD by combining newly
obtained sequence data from Japanese brook lamprey and sea lamprey (Petromyzon marinus) data in the database.
The Japanese brook lamprey cDNAs were synthesized from the mRNAs of ammocoetes larva and were sequenced by Roche 454 GS FLX titanium system. After
xvi
the assembly of 426,476 sequence reads, I obtained 7,708 contigs with 336 bp length on average. Additionally, I also analyzed the sea lamprey mRNA sequencing data in the SRA database. Including 119,412,170 reads, they were assembled to 78,947 contigs. Based on these lamprey data, I analyzed putative orthologous and paralogous gnathostome sequences corresponding to the lamprey contigs to estimate the relative timing of the 2R WGD. From the homologous gene clustering, phylogenetic trees of 358 gene families are reconstructed. However, if I restrict trees which contain two duplication events and have high statistical supports, only 55 trees were left. The majority (49) of them showed the pattern that two genome duplications both occurred before the lamprey divergence
Recently, the sea lamprey (Petromyzon marinus) genome sequences appeared in the public database including 11,429 genes. I also investigated the possibility that gene losses caused misunderstanding of true ortholog/paralog relationships by using these newly released sea lamprey data, as well as with 13 gnathostomes and 6 nonvertebrate species genome data. I reconstructed phylogenetic trees of 545 gene families, and there were 127 trees with one agnathan (A) and two gnathostomes (G) clusters. Although 69 trees showed topology ((A,G),G) suggesting two duplications before the agnathans/gnathostomes divergence, the remaining 58 trees had topology
xvii
((G,G),A). I compared the branch lengths connecting the gnathan common ancestor and the agnathan/gnathostomes common ancestor, and found that ((G,G),A)-topology trees had the significantly longer branch than ((A,G),G)-topology trees. This suggests that agnathan genes were lost in the lamprey lineage in ((G,G),A)-topology trees, and the occurrence of duplications erroneously looked like after the agnathans/gnathostomes divergence. I thus conclude that 2R WGD occurred before agnathans/gnathostomes divergence.
1
CHAPTER 1
General Introduction
1.1 Mode of duplication
Darwin (1859) argued for natural selection as a creative force of new functions in his “The Origin of Species”. Although the power of natural selection in removing disadvantageous variants was clear, many biologists doubted whether it could build wholly new structures. The canonical work on the subject is Ohno's (1970) "Evolution by Gene Duplication", in which he stressed the importance of gene duplication and
considered the various types of duplications and their potential for yielding novel functions.
There are two types of duplications. These are whole-genome duplication (WGD) and small-scale duplication (SSD). Both WGD and SSD can produce different kinds of adaptations (Wapinski et al. 2007). Previous studies found a pattern of negative correlation between genes fixed in duplicate after SSD events and those surviving from WGDs (Maere et al. 2005; Wapinski et al. 2007). Duplicates produced by WGD also seem to share more protein interactions after duplication than do genes duplicated by SSD (Guan et al. 2007; Hakes et al. 2007). Moreover, products of WGD are often
2
highly expressed (Seoighe et al. 1999) and are more likely to show an overexpression phenotype or haploinsufficiency than other duplicates (Wapinski et al. 2007). Strangely, although SSDs tend to be created from genes with smaller than average knockout fitness defects, enzymes that are retained in duplicate after WGD seem to have fitness defects at least as large as those for the genes that are not retained (DeLuna et al. 2008). The WGD can lead to the retention of duplicates of genes whose dosage balance is potentially important (such as transcription factors), whereas this class of gene is rarely duplicated by SSD. This idea implies that WGD events might allow certain evolutionary novelties to appear and be selected for that would have been unlikely to arise otherwise.
1.2 History of genome duplication study
While genome duplications in animals are now well documented, the existence of a polypoid vertebrate that is a salamander (Ambystoma jeffersonianum) was accepted in 1960s (Uzzell 1964), much later than studies of plant polyploidization. The first polyploid frogs (Odontophrynus americanus and Ceratophrys ornata) were described in 1966 (Saez et al. 1966). Although they provided clear figures showing multiple sets of chromosomes and multivalent formation during meiosis, their conclusion did not suggest the existence of WGD event. Bogart (1967) later confirmed that these were both
3
octoploid species that reproduced bisexually. Earlier research on fish also suggested that polyploidy played a major role in the speciation and the diversification of the Salmonidae (Svärdson 1945) and the genus Coregonus (Kupka 1948). However, these were discounted by some researchers.
After these reports, Ohno (1970) addressed the importance of the ancient genome duplications. The possibility that the genome duplication has played an important role in animal evolution has received much attention since the discovery of them (Donoghue et al. 2005; Volff 2005). In contrast to the animals, genome duplications in plants are the focus of modern genomic research not only due to their economic importance, but also due to the much larger than expected genomic signatures of ancient WGD events. A large fraction of plant genomes is generated by duplication, partly because of the frequent occurrence of genomic segmental duplications and polyploidization events in plants. For example, in the Arabidopsis thaliana and rice genomes up to 90% and 62% of loci are duplicated, respectively, and it is estimated that 70–80% of angiosperm species have undergone polyploidization at some point in their evolutionary history (Moore et al. 2005). However, even in plants, we still do not have a complete understanding of the factors that promote the formation and establishment of WGD in the wild, the role ecology plays in polyploid speciation, and whether
4
polyploidy accelerates diversification rates or is an evolutionary dead end (Levin 2002; Soltis et al. 2010).
1.3 Genome duplications of vertebrates
In the vertebrate evolution, WGDs sometimes occurred (Lewis 1980; Otto and Whitton 2000; Le Comber and Smith 2004; Gregory 2005). However, WGDs are most common in organisms that do not regulate their internal temperature like plants and ectothermic animals (Gregory 2005). Why do some groups are polyploid and others not? Although it is possible that intrinsic mechanisms regulating genome integrity constrain WGD establishment, it may also be possible that ecological factors (living in habitats or conditions that favor polypoidy), in combination with the inherently stochastic nature of establishment of polyploid lineages. Formation in the midst of diploid progenitor (Husband 2000) and producing balanced chromosome sets are some of these inherently stochastic natures.
The WGDs occurred in the vertebrate genomes are divided into ‘ancient’ (i.e. paleopolyploid) WGDs and ‘recent’ WGDs. The ‘recent’ polyploid species usually have twice chromosome number of close relatives. Those ‘recent’ polyploid events are often
5
occurred in amphibian and fish lineages (Mable et al. 2011). One lineage specific WGD event in mammal is reported (Gallardo et al. 1999). However, this WGD remains unresolved, because to ascertain polyploidy is technically very difficult (Gallardo et al. 2004; Svartman et al. 2005; Gallardo et al. 2006). By contrast, the ‘ancient’ WGD are known as the two-rounds whole genome duplications (2R WGD) and fish specific genome duplication (FSGD). In this study, I focused on the 2R WGD from these genome duplication events, because these events might generate the vertebrate specific features (Lundin et al. 2003).
1.4 Hox clusters are the hallmarks of the 2R WGD
The Hox genes regulate animal body plans. They were discovered from fruit fly. The mutations of these homeobox (Hox) genes have powerful and interpretable effects on morphology, the most conspicuous being the homeotic transformation in Drosophila melanogaster (Lewis 1978; Kaufman et al. 1990). Hox genes are present and expressed
in similar patterns in nearly every bilateral animal that has been analyzed, so their roles in morphological diversification probably evolved before the appearance of the first bilateral animal. Indeed, the initial glimpses into the conservation of metazoan developmental control genes came during the study of D. melanogaster Hox gene
6
clusters (McGinnis et al. 1992).
The Hox clusters are also the hallmark of the 2R WGD study. The all deuterostome invertebrates so far studied has only one Hox cluster (Lemons et al. 2006). Major tetrapod species have four Hox clusters in their genome. The identification of Hox quadrupled regions strongly supported the existence of the 2R hypothsis (Lundin 1993; Ruddle et al. 1994). The teleosts have approximately twice number of the Hox clusters, compared with tetrapod species. Additional Hox clusters have been identified in teleost fish occupying different taxonomic positions. The mapping of Hox clusters and many duplicated genes in several fish suggested an extra WGD in ray-finned fish (Amores et al. 1998; Woods et al. 2000; Amores et al. 2004; Naruse et al. 2004). After the finding of duplicated Hox clusters in teleost genomes, genome-wide gene comparison was done (Vandepoele et al 2004; Christoffels et al. 2004). The result indicated a fish-specific large-scale duplication event (called fish specific WGD or 3rd WGD). The definitive proof that a more recent WGD occurred in teleost fish has important consequences for the 2R hypothesis because it indicates that WGD and not segmental duplication was the duplication mechanism responsible for the origin of the additional Hox clusters in this clade. Therefore, people could accept that the Hox clusters are reliable markers of WGDs. However, proofing the existence of the 2R
7
WGD by genome-wide comparison was difficult at that time, because syntenic outgroup genomes were unavailable.
1.5 Vertebrate genome evolution after the 2R WGD
The 2R hypothesis was proven after the amphioxus genome was sequenced (Putnam et al. 2008). Before the amphioxus genome was reported by Putnam et al. (2008), the 2R hypothesis was extensively debated (e.g., Holland et al. 1994; Gibson and Spring 2000; Hughes et al. 2001; Dehal and Boore 2005). Because gene synteny comparison between amphioxus and tetrapod species shows 1:4 ratio in almost genomic regions, the existence of the 2R WGD is now widely accepted. However, we have unsolved problems about the evolution after the 2R WGD.
First, the duplication history of paralogs derived from the 2R WGD is unclear. If the 2R WGD events occurred, the tree topology of the paralogous genes, say A, B, C, and D, should show a symmetrical ((A,B)(C,D)) topology. However, many gene families show not symmetrical but asymmetrical topology, including Hox genes (Hughes et al. 2001). There is a possibility of homogenization such as recombinations, crossovers and conversions.
Second, the impact of the 2R WGD about the gene expression is unknown.
8
Genome duplications generated paralogous genes and complex gene regulatory mechanisms in vertebrate evolution. These paralogous genes often share the same expression patterns, but some might have acquired new expression patterns. The changes of gene expression mainly resulted from changes in cis-regulatory elements (Carroll 2001). Because gene regulatory elements are expected to be conserved due to their functional importance, searching for evolutionarily conserved non-coding sequences (CNSs) would be an effective strategy for finding candidates of functional elements. Previous studies have already shown that CNSs are abundant in vertebrate genomes (Bejerano et al. 2004; Woolfe et al. 2005). Genome-wide comparative approaches have also reported the existence of paralogous CNSs (Bejerano et al. 2004; Woolfe et al. 2005; McEwen et al. 2006), and most of them are located in paralogous gene clusters that code for transcriptional factors. These results imply that paralogous CNSs contribute to cluster organization and/or their neighboring gene expression patterns. However, paralogous CNSs derived from the 2R WGD are still unclear.
Third, the relative timing of the 2R WGD is not determined yet. Jawless vertebrates (i.e. hagfish and lamprey) branched off at the early timing of the vertebrate evolution. Ohno (1970) speculated that all vertebrate share the 2R WGD events. Force et al. (2002) suggested that at least one duplication of Hox cluster occurred before the
9
divergence of gnathostome and jawless vertebrates, whereas an independent cluster duplication occurred in the lamprey lineage, after it diverged from the gnathostome lineage. Fried et al. (2003) argued for an independent duplications of these Hox clusters and suggested that the common ancestor of agnathans and gnathostomes had a single Hox cluster. Recently, Kuraku et al. (2008) estimated that gnathostome and jawless vertebrates shared the 2R WGD events by using 55 gene family data. These results are contradictory with each other. We need more reliable genome-wide analysis to clarify the relative timing of the 2R WGD events.
There are some reasons to explain why the relative timing of the 2R WGD is so important. First, the 2R WGD events are deeply related to the acquirement of vertebrate novel structures (listed in Figure1.1), especially neural crest cells. The vertebrate novel structures are derived mainly from the neural crest cells. Hall (2000) considers vertebrates to be not merely usual triploblastic animals, but quadroblastic, with the neural crest constituting a fourth germ layer. Holland and Chen (2001) have even proposed calling vertebrates and their fossilized precursors "cristozoa", the
"crest-animals". However, it is unclear that how these unique neural crest cells arose. This is critically important question in evolutionary developmental biology, because it goes to the heart of evolutionary novelty and the origin of vertebrate. The 2R WGD may
10
contribute to the emergence of this new type cells. Holland et al. (1996) suggested that the origin of the neural crest cells involves the genome duplications. If the 2R WGD events occurred before agnathan divergence and vertebrate share these events, the origin of the neural crest cells is clearly related to the 2R WGD. Otherwise, if vertebrate share only one genome duplication event, the origin of the neural crest cells is related to only the 1st-round WGD. The 2nd-round WGD may generate other vertebrate features, such as jaws, bones and limbs. If vertebrate share no genome duplication events, there is no relation between genome duplications and the origin of neural crest cells. In this case, we should reconsider the origin of neural crest cells. We, thus, can show the genomic change that contributes to the emergence of vertebrate novel structures, if the relative timing of the 2R WGD are identified. Second, developmental biologist use homologous lamprey genes as makers of orhologous structures, in spite of their uncertain orthologies. Because the definition of orthologous structure is difficult, especially evolutionary separated species, these definition sometimes cause misinterpretations. The identification of timing of the 2R WGD will help to show true orthologous structures.
1.6 Questions of this study
Previous studies show the evidence of the 2R WGD events. In this study, I
11
dissected the unsolved problems of the 2R WGD in different pieces. I focused on especially non-coding region, Hox clusters, and lamprey genome evolution.
In chapter 2, I discussed paralogous conserved gene regulatory elements within the vertebrate Hox clusters. These elements are conserved through the vertebrate evolution and may play important roles in Hox gene expressions. I then concentrate on the Hox gene phylogeny in chapter 3. In this chapter, possible gene duplication history of the vertebrate Hox clusters is reconstructed by using not only phylogenetic tree, but also phylogenetic networks. In chapter 4, I will focus on the genome-wide survey of paralogous non-coding sequences derived from the 2R WGD. These highly conserved sequences are very important when we infer the gene regulatory evolution after the 2R WGD. I will show the challenge of de novo RNA sequencing of Japanese brook lamprey in chapter 5. The next generation sequencers are recent cutting edge techniques. These equipments make it possible to read massive sequence data by low cost. By using these data, the relative timing of the 2R WGD is inferred. I continue to discuss the relative timing of the 2R WGD events in chapter 6. The sea lamprey genome data are recently released, and these data provide us the genome-wide comparison between jawless vertebrates and jawed vertebrates. The timing of the 2R WGD is estimated with a high confidence for the first time. These studies will help a further understanding of
12
the 2R WGD events.
13
Figure 1.1: Morphological novelty of vertebrate lineages
14
CHAPTER 2
Evolution of Conserved Non-Coding Sequences Within the
Vertebrate Hox Clusters Through the Two-Round Whole
Genome Duplications
2.1 Introduction
Vertebrate genomes show evidence of widespread gene duplications compared to invertebrate genomes. Ohno (1970) proposed the existence of two-round whole genome duplications (2R WGD) during the early vertebrate evolution, now known as the 2R hypothesis. Before the amphioxus genome was reported by Putnam et al. (2008), this hypothesis was extensively debated (e.g., Holland et al. 1994; Gibson and Spring 2000; Hughes et al. 2001). Genome duplications generated paralogous genes and complex gene regulatory mechanisms in vertebrate evolution (e.g., Dehal and Boore 2005). These paralogous genes often share the same expression patterns, but some may acquire new expression patterns. The changes of gene expression are mainly resulted from changes in cis-regulatory elements (Carroll 2001).
Identifying the cis-regulatory sequences that control spatial and temporal gene expression is a challenging issue. Because gene regulatory elements are expected to be
15
conserved due to their functional importance, searching for evolutionarily conserved non-coding sequences (CNSs) would be an effective strategy for finding candidates of functional elements. We should note that the gene regulatory elements which are not conserved are very rare (Weirauch and Hughes 2010). Previous studies have already shown that CNSs are abundant in vertebrate genomes (Bejerano et al. 2004; Woolfe et al. 2005). Genome-wide comparative approaches have also reported the existence of paralogous CNSs (Bejerano et al. 2004; Woolfe et al. 2005; McEwen et al. 2006), and most of them are located in paralogous gene clusters that code for transcriptional factors. These results imply that paralogous CNSs contribute to cluster organization and/or their neighboring gene expression patterns. I therefore focused on the vertebrate Hox clusters because they contain abundant CNSs.
The Hox genes orchestrate the development of animal body plans. They consist of more than four physically linked clusters in different chromosomes in vertebrate genomes (Pearson et al. 2005; Lemons and McGinnis 2006). Hox genes of each cluster are expressed along the anterior-posterior body axis in the same order as lining up on the chromosome, a feature called “colinearity” (Garcia- Fernàndez 2005). Paralogous genes of the Hox clusters show the similar expression pattern, which suggests that there might be shared gene expression regulatory mechanisms among paralogous Hox
16
clusters.
The duplication of Hox clusters influences cluster architecture and patterns of non-coding sequence evolution. The duplicated non-coding regions within the Hox clusters are mainly studied for teleost fish (e.g., Chiu et al. 2002; Santini et al. 2003; Prohaska et al. 2004). The third round whole genome duplication occurred after the 2R WGD in the teleost lineage. Chiu et al. (2002) and Prohaska et al. (2004) found massive loss of sequence conservation in teleost HoxA cluster non-coding regions after the 3R WGD. Therefore, teleosts are not suitable for analyzing duplicated Hox cluster non-coding sequences.
In the case of 2R WGD, Kim et al. (2000) described one paralogous CNS within the four Hox clusters. However, analysis of non-coding sequences of the Hox clusters within vertebrates, especially mammalian species, is not sufficient. There are probably two reasons for this. First, the functional paralogous conservation cannot be detected easily. This is because the 2R WGD were very ancient events which occurred approximately half a billion years ago and the non-coding sequences experienced higher evolutionary rates compared to protein coding sequences. This is probably because cis-regulatory elements are redundant and may be changed by binding site turnover (Hancock et al. 1999). Secondly, only a few invertebrate sequences that are more
17
closely related to vertebrates and that still retain cluster structure are available. With the recent abundance in vertebrate genomes sequences, we can now analyze the evolution of non-coding sequences within the Hox clusters after 2R WGD. However, identifying CNSs within Hox clusters before 2R WGD remains a challenge.
Recently, Hox cluster sequences of two different amphioxus species, Branchiostoma floridae and B. lanceolatum were reported by Amemiya et al. (2008)
and Pascual-Anaya et al. (2008), respectively. Because amphioxus is the chordate bearing a syntenic Hox cluster which is most closely-related to vertebrates, these data would be very informative for inferring the evolution of non-coding regions within Hox clusters before 2R WGD.
Detection of the functional turnover of transcription factor binding site (TFBS) is one interesting problem. In the Drosophila genome, the TFBS turnover frequently occurred (Ludwig et al. 2005). Ray et al. (2008) developed a program to find the functional turnover motifs by using experimental results as training data. Some cis-regulatory regions showed the TFBS turnovers also in vertebrates (Weirauch et al.
2010). But these data are difficult to utilize for finding other functional turnover events for various reasons such as insufficient experimental data, short alignment length, and low mutation rate. Therefore I did not examine the functional turnover of the TFBS in
18
this study.
In this study, I identified orthologous CNSs within the vertebrate Hox clusters, and found conserved loci among paralogous Hox clusters. I compared these CNSs with amphioxus-human CNSs reported by Pascual-Anaya et al. (2008) by using phylogenetic footprinting to find CNSs that can be dated back to amphioxus. This study identified and mapped vertebrate CNSs within the four vertebrate Hox clusters by using comprehensive genome comparisons.
2.2 Materials and Methods
2.2.1 Identification of vertebrate Hox CNSs
Genomic sequences of Hox clusters were obtained for the following 18 vertebrate species from UCSC Genome Bioinformatics (http://genome.ucsc.edu/): Human (Homo sapiens), mouse (Mus musculus), chimpanzee (Pan troglodytes), orangutan (Pongo pygmaeus abelii), rhesus macaque (Macaca mulatta), marmoset (Callithrix jacchus), rat (Rattus norvegicus), guinea pig (Cavia porcellus), cat (Felis catus), dog (Canis familiaris), horse (Equus caballus), cow (Bos taurus), opossum (Monodelphis domestica), platypus (Ornithorhynchus anatinus), chicken (Gallus gallus), zebra finch (Taeniopygia guttata), lizard (Anolis carolinensis), and frog (Xenopus
19
tropicalis). Partial sequences of the horn shark (Heterodontus francisci) that included
Hox clusters (DDBJ/EMBL/GenBank accession numbers are AF224262 and AF224263) were also used for this study. I excluded teleost fishes, which have undergone the additional genome duplication in their lineages. Protein coding regions were filtered based on the RefSeq project (http://www.ncbi.nlm.nih.gov/RefSeq/) annotation. Alternative exons were not considered in this analysis. BLAST homology search (Altschul et al, 1997) was performed on this data set with default parameter setting and cutoff scores of >200.
Orthologous CNSs were systematically named based on their genomic locations and BLAST scores. For example, the CNS that is located at the intergenic region between HoxA7 and HoxA6 with the highest BLAST score was named “A76-1”.
These CNSs were aligned by using CLASTALW (Thompson et al. 1994), and divided into three categories to investigate the depth of conservation: placental mammals, amniotes, and vertebrates. I then searched for conserved sequences that were conserved not only between orthologous clusters but also among paralogous four Hox clusters by using BLAST search with the cutoff score of less than 30. Annotations of TFBS motifs were mainly based on the TRANSFAC database (http://www.biobase-international.com/pages/index.php?id= transfac).
20
2.2.2 Analysis of paralogous CNSs
To investigate the non-coding transcribed regions of the Hox clusters, transcriptional information of mRNAs and ESTs within the human and mouse Hox clusters were obtained from the UCSC Genome Bioinformatics database and these transcripts were mapped on the region.
Phylogenetic footprinting analysis was carried out for each orthologous CNSs that also have paralogous conservation. Each vertebrate CNS was aligned by using CLASTALW. The substitution number of each aligned site was estimated parsimoniously by using Fitch’s (1971) algorithm. The guide phylogenetic tree (Figure A2.1) necessary for this analysis was taken from Murphy et al. (2004). In parallel, the likelihood estimation of ancestral sequence of each vertebrate CNS was inferred by using PAML 4 (Yang 2007).
2.2.3 Comparison with amphioxus Hox CNSs
Pascual-Anaya et al. (2008) compared Hox clusters of two different amphioxus species (Branchistoma floridae and B. lanceolatum) to each human Hox cluster and defined 75 human-amphioxus CNSs (amphiCNS). These amphiCNSs were obtained and
21
Figure 2.1: The schematic diagram of orthologous CNSs and paralogous CNSs among human Hox clusters
Exons of protein coding genes are represented by light green boxes. The orange ovals are orthologous CNSs. The blue and red ovals indicate locations of paralogous CNSs conserved also among the two clusters and the four clusters, respectively. The blue dotted lines show either microRNA (DP4) or non-syntenic DP (DP6). The paralogous CNSs whose name enclosed by blue rectangle is newly detected. Especially the newly detected HoxC CNS of TP3 is highlighted by blue circle. The light blue circled HoxA CNSs were not identified by Prohaska et al. (2004). Abbreviations are TP; tetra-paralog, DP; di-paralog.
22
Table 2.1: Conservation depth of each CNS
HoxA HoxB HoxC HoxD
Placental mammals 4 5 33 2
Above + Marsupials 2 11 0 1
Above + Monotremes 8 6 3 6
Amniotes 17 7 8 7
Tetrapods 17 14 16 9
Vertebrates 16 - - 16
Total 64 (48) 43 (43) 60 (60) 41 (25)
Note. There is no genomic sequence data for horn shark HoxB and HoxC clusters, so
“Vertebrates” depth CNSs are not determined, as shown with hyphens. Because of this, values in parentheses in “Total” are those excluding CNSs shared in all vertebrates.
23
were sorted by identity. I named amphiCNSs by the order of their identity. The amphiCNSs were compared with vertebrate CNSs to identify significant conserved region among chordates.
2.3 Results
2.3.1 Orthologous CNSs within vertebrate Hox clusters
I defined 208 CNSs in total: 64, 43, 60, and 41 for HoxA, B, C, and D clusters, respectively. Genomic locations of these CNSs are graphically shown in Figure 2.1, and detailed information of all these CNSs is shown in Table A2.1. Many of these orthologous CNSs overlap microRNAs and cis-regulatory elements which are previously described (Mainguy et al. 2003; Yekta et al. 2004). Because sequence information is not complete or homologous sequence is lacking, some CNSs were not found in several species (see Table A2.2). As an example of a cis-regulatory element, C98-1 corresponds to the HoxC8 early enhancer which is necessary for proper HoxC8 expression (Juan and Ruddle 2003). Other CNSs might bear similar enhancer functions. Our findings are consistent with previous observations (Prohaska et al. 2004; Chiu et al. 2002), confirming that orthologous CNSs were detected effectively. Moreover, by using our criteria, I also detected 160 new CNSs (see Figure 2.1 and
24
Table A2.1).
I detected a larger number of CNSs in Hox5-Hox3 (corresponding to Drosophila Antp and Ubx/abdA) intergenic sequences than in other intergenic
sequences (Figure 2.1). This region has abundant alternatively spliced coding RNAs and long non-coding RNAs (Mainguy et al. 2007). This observation suggests that functionally unknown CNSs in this region contribute to these alternative splicing events. In contrast, posterior regions of Hox clusters have poor conservation except for upstream regions of Evx1 and Evx2.
The 208 CNSs were divided into six categories: placental mammals, placental mammals + marsupials, placental mammals + marsupials + monotremes, amniotes, tetrapods, and vertebrates, based on the depth of conservation (Table 1.1). The level of conservation of orthologous CNSs varies among the four Hox clusters; HoxA has the highest number (64) of CNSs in total, while HoxD has the smallest number (41) of CNSs due to the small numbers of CNSs conserved among amniotes and tetrapods. The HoxC cluster has the highest number (33) of CNSs conserved only among placental mammals, while the HoxB cluster has the highest number (11) of CNSs in placental mammals + marsupials. This result, however, does not mean that the HoxC cluster is the least conserved (see Discussion).
25
Table 2.2: Possible functions of Tetra (TP) and Di (DP) paralogous CNSs Name ID Function Putative TFBS References (A) TP CNSs
TP1
A76-1 Anterior Hox promotera
Homeobox, E-box
Kim et al. (2000),This study B76-1 Anterior Hox
promotera
Homeobox, E-box
Kim et al. (2000),This study C86-1 Anterior Hox
promotera
Homeobox, E-box
Kim et al. (2000),This study D84-2 Anterior Hox
promotera
Homeobox, E-box
Kim et al. (2000),This study
TP2
A54-2 Hox4 Enhancer RARE Mainguy et al.
(2003)
B54-3 Hox4 Enhancer RARE Mainguy et al.
(2003)
C54-3 Hox4 Enhancer RARE Mainguy et al.
(2003)
D84-3 Hox4 Enhancer RARE Mainguy et al.
(2003)
TP3
A43-7 Hox3 Enhancer RARE Mainguy et al.
(2003)
B43-3 Hox3 Enhancer RARE Mainguy et al.
(2003)
C4-3 Hox4 Enhancera RARE This study
D43-9 Hox3 Enhancer RARE Mainguy et al.
(2003) (B) DP CNSs
DP1
E1-1 Hox13 Enhancer (distal limb enhancer)
PPAR-α, GATA-1, POU1F1a, Homeobox
Lehoczky et al. (2004)
E2-1 Hox13 Enhancer PPAR-α, Spitz et al. (2001)
26
(distal limb enhancer) GATA-1, POU1F1a, Homeobox
DP2
E1-2 Hox13 Enhancer (distal limb enhancer)
C-Myb, Homeobox, YY1
Lehoczky et al. (2004) E2-3 Hox13 Enhancer
(distal limb enhancer)
C-Myb,
Homeobox, YY1 Spitz et al. (2001)
DP3
C1110-2 Hox10 enhancera SF1, CP1,
Homeobox This study D1110-3 Hox10 enhancera SF1, CP1,
Homeobox This study
DP4
A109-2 MicroRNA
(mir-196 family) -
Yekta et al. (2004)
C109-2 MicroRNA
(mir-196 family) -
Yekta et al. (2004)
DP5
C109-4 Hox9 enhancera GR, E-box,
CAT-box This study D109-1 Hox9 enhancera GR, E-box,
CAT-box This study DP6
B43-1 Hox3 enhancera GR This study
D84-1 Hox3 enhancera GR This study
DP7
A54-1 Bidirectional promotera
E-box, NF-1, E-box, CAT-box,
TATA-box
This study
B54-1 Bidirectional promoter
E-box, NF-1, E-box, CAT-box,
TATA-box
Dinger et al. (2008)
DP8
A43-12 Hox3 enhancera USF, Homeobox This study B43-5 Hox3 enhancera USF, Homeobox This study
aPutative function
27
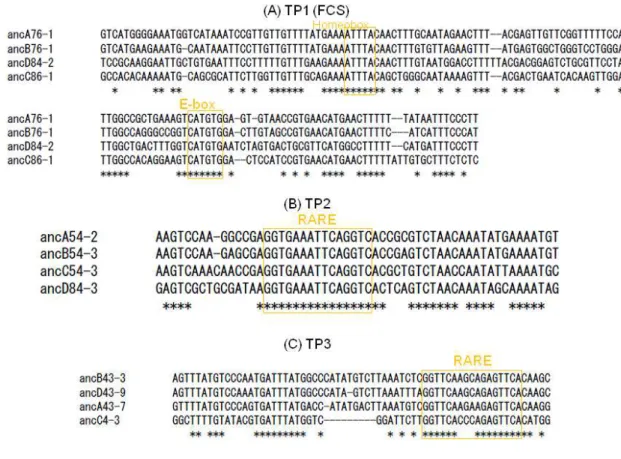
Figure 2.2: Multiple alignments of three TP CNS sequences
(A) - (C) are results of multiple alignments of paralogous conserved regions derived from each TP CNS. Aligned sequences are ancestral sequences estimated from each CNS using PAML4 program (Yang 2007). Alignments are generated by using CLUSTALW (Thompson et al. 1994). The putative TFBS are highlighted by orange.
28
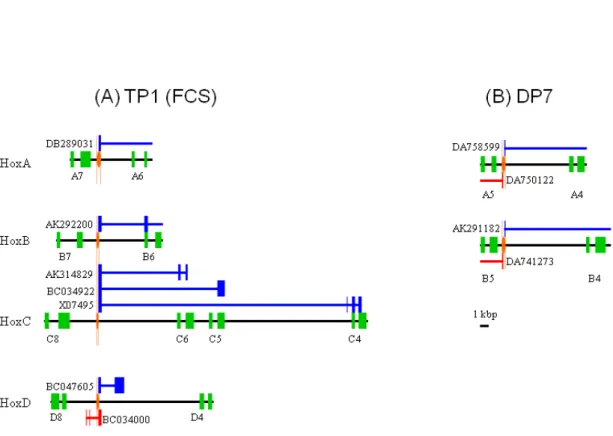
Figure 2.3: The scheme of paralogous conserved bidirectional promoters
We mapped the paralogous CNSs on bidirectional transcript start sites which code alternative splicing RNAs of Hox genes and antisense RNAs. Paralogous CNSs are (A) TP1 and (B) DP7. The blue and red lines are sense RNAs and antisense RNAs, respectively. DDBJ/EMBL/GenBank accession numbers of these RNA sequences are also shown.
29
2.3.2 Paralogous CNSs among Hox clusters
I found 28 paralogous conserved elements in total (8, 6, 6 and 8 for Hox A, B, C and D clusters, respectively). Three quartets of CNSs are conserved among all four Hox clusters, and I named them TP (tetra-paralogous), as shown in Figure 2.1. I carried out the phylogenetic footprinting analysis to infer significantly conserved motifs among these three TPs. I found the highly conserved region in each CNS, and these overlap with paralogous conserved regions (see Figure A 2.2). Multiple sequence alignments of three TP CNSs are shown in Figure 2.2. It should be noted that these sequences are reconstructed ancestral ones. TP2 and TP3 contain retinoic acid response elements (RAREs). Intergenic regions of upstream or downstream of Hox4 genes are abundant with functional RAREs (Mainguy et al. 2003). Despite this, RAREs located downstream of HoxC4 has not been reported before. I found a new evolutionarily highly conserved sequence containing RARE in this region. These motifs might maintain gene expression pattern of clusters cooperatively.
The remaining TP1 was discovered by Kim et al. (2000), and they named it four cluster sequence (FCS). Though I found conserved motifs in the FCS (Figure 2.2), these motifs have no experimental corroboration. Then I mapped transcripts within Hox
30
clusters. As a result, 136 CNSs overlap with transcribed regions (see Table A2.1). FCS corresponds to the bidirectional transcript start sites (TSS) which encode alternative spliced RNAs of Hox genes and antisense non-coding RNAs (Figure 2.3A). These CNSs might play important roles in the colinear expression pattern of the Hox cluster. Another paralogous CNS between Hox5 and Hox4 overlapped the region of TSS and alternative exons (Figure 2.3B), suggesting that CNSs function as cis and trans regulatory elements.
Eight pairs of CNSs are conserved between two paralogous Hox clusters, and I named them DP (di-paralogous), as shown in Figure 2.1. Results of phylogenetic footprinting analysis and pairwise sequence alignment are shown in Figure A2.2 and Figures A2.3, respectively. The DP6 CNS is not located at syntenic region and the conservation is poor. Other DP CNSs are located at the syntenic region of each cluster and include functional elements (Table 2.2). DP1 and DP2 which are located at the upstream of Evx1 and Evx2 have cis-regulatory functions (Lehoczky et al. 2004). The region called “distal limb enhancer” in the HoxD cluster is essential for the posterior HoxD gene expression of appendicle (Spitz et al. 2001). The DP4 pair corresponds to microRNAs mir-196b and mir-196a-2. They belong to the mir-196 family. This family is composed of three members, which are mapped between Hox10 and Hox9 of HoxA,
31
HoxB and HoxC clusters (Yekta et al. 2004). However, another member, mir-196a-1, was difficult to detect because of poor conservation. I thus defined only two microRNA members as CNS.
2.3.3 Comparison between vertebrate CNSs and amphioxus CNSs within Hox clusters
Phylogenetic footprinting can be used to detect significantly conserved sequences between vertebrates and the amphioxus Hox cluster. Because the conservation of non-coding region between amphioxus and vertebrates is poor, Pascual-Anaya et al. (2008) defined CNS in the case of human-amphioxus comparison as approximately 60 % identity and 50 bp length region. They reported 75 amphiCNSs. However, this might include CNSs which are not conserved among all vertebrates, but conserved only between human and amphioxus.
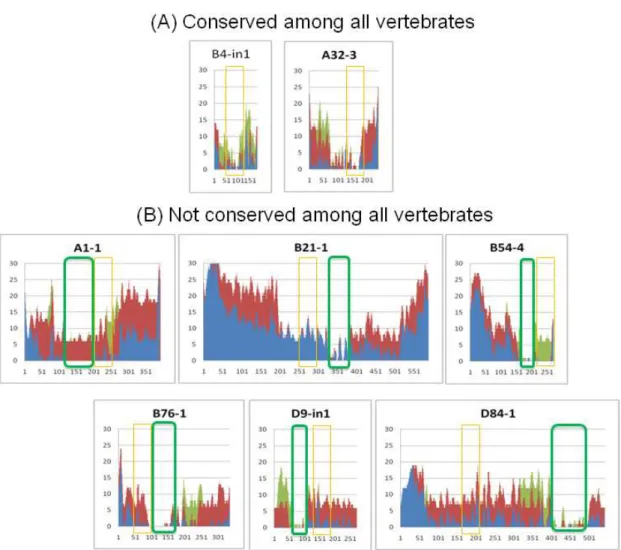
To remove these CNSs and to identify CNSs conserved among all vertebrates, I collected multiple orthologous vertebrate sequences and carried out phylogenetic footprinting analysis. I then identified the highly conserved “core region” of each vertebrate CNS. By comparing amphiCNSs with the vertebrate CNSs, I found that only 16 out of 75 amphiCNSs overlap with the vertebrate CNSs. Eight of them show deep
32
conservation; they are conserved among all vertebrates used in this study (see vertebrate CNSs information shown in Table A2.2). Two of eight amphiCNSs were aligned with the “core region” of the vertebrate CNSs; they are conserved among all chordates used in this study (Figure 2.4A). These are located at the HoxA and HoxB anterior regions, and supported a previous observation that the posterior region is more divergent than the anterior region (Ferrier et al. 2000).
The remaining six amphiCNSs did not correspond to the “core region” of the vertebrate CNSs (Figure 2.4B and Figure A2.4). Interestingly, the “core region” of the vertebrate CNSs is often adjacent to the amphioxus-human conserved regions. At last, only 2 out of 75 amphiCNSs are significantly highly conserved among chordates.
2.4 Discussion
I defined 208 CNSs within the vertebrate Hox clusters. To infer the depth of sequence conservation, I investigated the existence of orthologous CNSs from vertebrate species. The depth of conservation is different with each cluster. The HoxC cluster shows the shallowest conservation. Despite this result, the HoxC cluster retains some paralogous CNSs. Shallow conservation of the HoxC cluster could be an artifact. Because the intergenic sequence data of HoxC cluster is the poorest, I cannot detect the
33
Figure 2.4: The phylogenetic footprinting analysis within chordates
We compared the vertebrate CNSs with amphioxus-human CNSs (amphiCNSs). The results of phylogenetic footprinting are described. Each orange box corresponds to amphiCNS. (A) CNSs conserved among all vertebrates. (B) CNSs not conserved among all vertebrates. Each green box represents highly conserved region among vertebrates identified by phylogenetic footprinting. Each axis and color is the same as Figure A2.2.
34
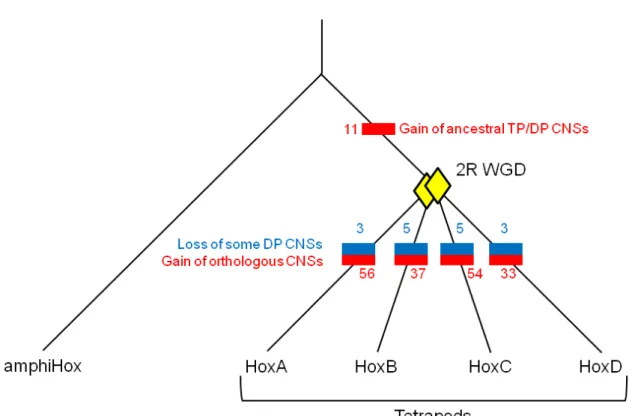
Figure 2.5: The loss and gain of Hox CNSs during the chordate evolution
The numbers of gain and loss of CNSs, shown in red and blue colors, respectively, are apportioned to the known Hox gene tree.
35
intergenic conservation from several species accurately. If the sequence data of Hox clusters are complete, the abundance of CNS of each Hox cluster may not be so different.
The number of the CNSs located at anterior region is higher than that of CNSs located at posterior region. The divergence of posterior paralogous Hox genes are more rapid compared with other paralogous Hox genes, called “posterior flexibility” (Ferrier et al. 2000). For example, because posterior genes of the HoxD cluster are regulated not only by each gene regulatory element but also by the global control regulatory element located 240 kb upstream of the cluster (Spitz et al. 2003), the intergenic region of the posterior HoxD cluster might have poor conservation. The posterior HoxA genes show similar expression pattern with the posterior HoxD genes. Therefore, this tendency applies to the HoxA cluster. The HoxA cluster also have global control enhancers located at upstream of the cluster (Lehoczky and Innis 2008).
The DP CNSs have many putative TFBSs (Table 2.2 and Figure A2.3). The homeobox binding motifs are especially abundant. This suggests that DP CNSs are important for the auto regulatory mechanism of the four vertebrate Hox clusters. Each Hox protein may bind to cis-regulatory regions of other Hox genes and controls the expression patterns. E-box is the motif related to the HLH (helix-loop-helix)
36
transcription factor. HLH and homeobox proteins mainly regulate the expression pattern of Hox genes. The DP7 CNSs bear the conserved TATA-box. This suggests that the DP7 CNSs have promoter function as I described.
I identified three paralogous regions conserved among the four Hox clusters. One of them, FCS, was previously reported (Kim et al. 2000). Surprisingly, many RNAs are transcribed in this area. Different directional transcripts are started in the HoxA cluster. FCS of the HoxB cluster corresponds with TSS of the HoxB6 gene. In the HoxC cluster, FCS is the TSS of HoxC6, HoxC5 and HoxC4 coding transcripts. In the HoxD cluster, FCS might control different directional transcripts. Not only FCS but also other paralogous CNSs (DP7) between HoxA and HoxB clusters overlap with TSS and alternative exons (Figure 2.3). Experimental approach revealed long non-coding antisense RNA started from this HoxB cluster region (Dinger et al. 2008). Because RNA data are insufficient to detect all cluster transcripts, some of these transcripts are partial and were found only in human and/or mouse. It is probable that these paralogous CNSs play important roles in alternative transcription in other tetrapod species.
The other two TP CNSs (TP2 and TP3) include the RARE (Mainguy et al. 2003). Their functions are experimentally confirmed (Morrison et al. 1997). Retinoids are thought to exert their activities at the transcriptional level, acting as ligands to
37
activate nuclear receptors. These nuclear receptors recognize DNA sequences closely related to 5’-(A/G)G(G/T)TCA-3’. Previous studies suggested that retinoic acids contribute to the expressions of Hox genes (Dubrulle and Pourquié 2004). TP2 and TP3 have type11 and type3 RAREs, respectively. A conserved sequence, TP3, downstream of HoxC4 gene was newly detected in this study. This sequence is located more than 20 kb away of the HoxC4 gene and corresponds to type3 RAREs. Amphioxus also has RARE in this intergenic region (Wada et al. 2006). However, I could not detect this element in this study. Only one motif conservation is difficult to detect by using this method. Other motifs of those paralogous CNSs might function as cis-regulatory element that cooperates with RAREs.
It is possible that these TP CNSs are key components of cluster organization. The motifs within them might have already existed in the ancestor of vertebrates who had only one Hox cluster. Because other motifs are not conserved within the orthologous region of invertebrates but conserved in the paralogous region of vertebrates, they were acquired after the emergence of vertebrates.
Pascual-Anaya J et al. (2008) reported 75 amphiCNSs which might include CNSs that are not conserved among all vertebrates but conserved only between human and amphioxus. To remove these CNSs and to increase statistical significance, I
38
compared multiple orthologous vertebrate sequences. I found that two amphiCNSs are overlapped and conserved in vertebrate CNSs. Ancestral DNA sequences of these CNSs have probably been under strong selective constraint throughout the chordate evolution, though their conservation is detected in only one Hox cluster. Other amphiCNSs might not be conserved among all vertebrates. However, we should deal with this problem carefully, for only two amphioxus genomes were used to detect CNSs conserved among chordates. More information of the Hox cluster from non-vertebrate chordate genome is necessary to obtain the complete picture of chordate CNSs.
The loss and gain of Hox CNSs are shown in the Figure 2.5. After the 2R WGD, the massive gains of CNSs were occurred. In contrast, the conservation of non-coding regions in the invertebrate genomes is low. This difference on the Hox clusters may be related with the evolution of various unique features of vertebrates. When vertebrates acquired the more complex morphogenesis, the Hox clusters may become more conservative. To solve why these highly conserved CNS were appeared, we have to consider the relationship between the non-coding functions and evolutionary conservations.
In summary, I efficiently detected orthologous CNSs of vertebrates. I identified three paralogous CNSs, and one of them bears a newly detected RARE motif. These
39
CNSs are conserved among all paralogous Hox clusters, and might contribute to Hox cluster organization and gene expression patterns.
40
CHAPTER 3
Phylogenetic Network Analysis of Vertebrate Hox Genes
3.1 Introduction
The Hox genes orchestrate animal body plans in deuterostomes. The Hox genes are originally identified from the mutant of Drosophila melanogaster (Lewis 1979; Kaufman et al. 1990), called homeotic transformation. These Hox genes are organized as a cluster on same chromosome in many animal phyla, suggesting that they are generated by series of tandem duplications occurred before their common ancestor of animals. Hox genes of each cluster are expressed along the anterior-posterior body axis in the same order as lining up on the chromosome, called “colinearity” (Pearson et al. 2005; Lemons et al. 2006). However, recent genome sequencing of deuterostomes revealed that Hox genes are not always colinear. They are scattered in different chromosomes (Seo et al. 2004) or translocated (Cameron et al. 2006) in specific deuterostomes. In vertebrate genomes, the two-round whole genome duplications (2R WGD) generated paralogous four Hox clusters (Ruddle et al. 1994). They consist of approximately 40 members that are physically linked on chromosomes and made four clusters. Each paralogous gene of the Hox clusters shows the colinear expression pattern.
41
There might be shared gene expression regulatory mechanisms among paralogous Hox clusters. However, Hox14 genes are the exception of this colinearity (Kuraku et al. 2008).
The posterior Hox genes are rapidly evolving, and this phenomenon has been termed "posterior flexibility" (Ferrier et al. 2000), so that it is difficult to assign clear ortholog/paralog relationships among deuterostomes. Especially, the orthologies between vertebrate posterior Hox genes (Hox9-Hox14) and amphioxus posterior Hox genes (Hox9-Hox15) are ambiguous. The cephalochordate amphioxus possesses a single Hox cluster, which is regarded as the ancestral state of vertebrate Hox clusters (Amemiya et al. 2008). The clear assignment of 1-to-1 orthologies between amphioxus and vertebrate posterior Hox genes cannot be established without further data (Ferrier 2004; Amemiya et al. 2008; Hueber et al. 2010). For instance, the non-orthology between the amphioxus Hox14 gene and the vertebrate Hox14 genes has been supported by phylogenetic analysis (Kuraku et al. 2008; Feiner et al. 2011) as well as a non-tree-based study (Thomas-Chollier et al. 2010). The identical name of the amphioxus and vertebrate Hox genes is simply derived from the same relative location in the cluster, but does not reflect true orthology. Interestingly, orthology between amphioxus Hox15 and vertebrate Hox13 was previously suggested (Holland et al. 2008;
42
Thomas-Chollier et al. 2010), despite their non-syntenic location in the cluster. However, the support for this grouping is poor.
Duplication history of Hox cluster is also controversial. Under the assumption of the 2R WGD, phylogenies of Hox gene should show a symmetrical topology, such as ((A,B),(C,D)). However, Lynch et al. (2009) reconstructed phylogeny of paralogous Hox genes that showed (B,(A,(C,D))) topology. This result is contradictory to some of other reports. Kappen et al. (1993) found a single best tree with the topology ((A,B),(C,D)). However, the next best tree with the topology (B,(A,(C,D))) was only a single step away. The (B,(A,(C,D))) topology was also proposed by Zhang et al. (1996) using distance methods, but they could not reject an ((A,B),(C,D)) because of low internal branch support. Recently, it was shown that elephant shark Hox genes support the ((A,B),(C,D)) topology with high statistical significance (Ravi et al. 2009). These results suggest that the phylogeny of Hox clusters is not yet solved. The phylogenetic network study of each paralogous Hox gene family may shed a light on this conundrum.
In this study, I carried out an exhaustive phylogenetic analysis of deuterostome Hox genes. First, to identify outgroup genes of each vertebrate Hox paralog group, I inferred the correct ortholog/paralog relationships between amphioxus and vertebrate posterior Hox genes. Second, the duplication histories of vertebrate Hox genes were
43
inferred by not only phylogenetic tree, but also phylogenetic network with and without outgroups. My analysis demonstrated that the ((A,B),(C,D)) topology is the most suitable explanation of Hox cluster duplications.
3.2 Materials and Methods
The homeodomain sequences of deuterostome posterior Hox genes were manually downloaded from the GenBank database. Hox amino acid sequences for human (Homo sapiens), coelacanth (Latimeria menadoensis), horn shark (Heterodontus francisci), elephant shark (Callorhinchus milii), ascidian (Ciona intestinalis), larvacean
(Oikopleura dioica), two amphioxus (Branchiostoma floridae; Branchiostoma lanceolatum), two acorn worms (Ptychodera flava; Saccoglossus kowalevskii), and sea
urchin (Strongylocentrotus purpuratus) were used to infer the orthologies between vertebrate and other chordates. Vertebrate amino acid sequences for Dlx, Collagen (Col), Hox and ErbB were downloaded from GenBank or identified from BLAST searches of amino acid databases. The sequences of all paralog members for each Hox cluster were aligned with and without outgroups. Amino acid sequences for all genes were aligned by using CLUSTALW (Thompson et al. 1994) and adjusted by visual inspection. Regions with large gaps, ambiguous alignment or repetitive sequences were removed
44
Figure 3.1: The evolution of deuterostome Hox clusters
For each taxon, Hox clusters are illustrated. In vertebrate, HoxA, HoxB, HoxC, and HoxD are shown from top to bottom. Genes are colored to differentiate between Hox family members, and genes that are orthologous between clusters and species are labeled in the same color. In some cases, orthologous relationships are not clear.
45
Table 3.1: Species used in this study
phyla Species name Common
name Reference
Hs Vertebrate Homo sapiens Human GenBank
Lm Vertebrate Latimeria
menadoensis Coelacanth Amemiya et al. 2010 Hf Vertebrate Heterodontus
francisci Horn shark Kim et al. 2000 Ci Chordate Ciona intestinalis Ascidians Spagnuolo et
al. 2003 Od Chordate Oikopleura dioica Larvaceans Seo et al. 2004
Bf Chordate Branchiostoma
floridae Amphioxus
Amemiya et al. 2008 Pf Hemichordate Ptychodera flava Acorn worm Peterson 2004 Sk Hemichordate Saccoglossus
kowalevskii Acorn worm Aronowicz et al. 2006 Sp Echinodermata Strongylocentrotus
purpuratus Sea urchin Cameron et al. 2006
46
from all genes. Phylogenetic trees were reconstructed using neighbor-joining (NJ) JTT distance, and maximum likelihood (ML) algorithms implemented in the MEGA5 (Tamura et al. 2011) package of programs. Branch support was assessed with 500 and 100 bootstrap resamplings for NJ distance and ML, respectively. A phylogenetic network based on a distance matrix was reconstructed by using the neighbor-net method (Bryant et al. 2004; Huson et al. 2006),
3.3 Results
3.3.1 Ortholog/paralog relation of posterior Hox genes
Because the phylogenetic relationships of deuterostome posterior Hox genes, especially between amphioxus and vertebrates, are still unclear, these relations were inferred by phylogenetic networks. The already known homeodomain sequences of deuterostome posterior Hox genes were collected from the database (Figure 3.1 and Table 3.1) and reconstructed the possible evolutionary history. Although the statistical significance is very low because of the short alignment length (Figure A3.1), amphioxus Hox9-11, and Hox15 are clustered with vertebrate Hox9, and Hox13 paralogous groups, respectively (Figure 3.2). The vertebrate Hox12 paralog group is not clustered with any other amphioxus Hox genes. This result may imply Hox12