Edinburgh Project on Extensive Reading
(EPER) Reading Comprehension Tests:
Scoring and setting cutoff scores
Kiyomi Yoshizawa
多読クラスでは、学習者が自分の英語力にあった教材を選び、読み進めるように指導する。 多読をリーデイングプログラムに取り入れるにあたり、学習者の英語力に適した教材選択、 学習者のリーデイング力またその伸びを測定するためのテストなどが必要となる。エジンバ ラ大学多読プロジェクト(Edinburgh Project on Extensive Reading)では、学習者が易しい 読み物から徐々に難しい読み物を読むように多読用教材を 8 レベルに分け、指導する。また、 学習者のリーデイング力またその伸びを測るテストとして、EPER 読解テストを開発した。 本研究では、EPER 読解テストに関して、二つの点を検証した。第一に、EPER 読解テスト を採点する際、部分点採点法は機能するのかどうか。第二に、エジンバラ大学多読プロジェ クトによってあらかじめ決められている各レベルの到達基準は正答数によるものであるが、 これが日本人英語学習者を対象とした場合にどの程度機能するのかを検証した。120 名の日 本人英語学習者のデータのラッシュ分析を行った。
Key words
extensive reading(多読)、EPER reading comprehension tests(EPER 読解テスト)、 scoring(採点法)、cutoff scores(分割点)
INTRODUCTION
One of the materials often used by the teachers and institutions who integrated ER into their reading program was developed by The Edinburgh Project on Extensive Reading (e.g., Yamashita, 2008; Yoshizawa, Takase, & Otsuki, 2013). The Edinburgh Project on Extensive Reading (henceforth, EPER) is a research and development project started in 1981. The aim of the project is “to promote a systematic use of graded readers within an extensive reading programme” (English Language Teaching Centre, The University of Edinburgh). Learners start with easy readers at the beginning stage and develop their abilities to read unsimplified text. To achieve its goal, the project classified all the graded readers published in the UK and some 研究論文
published in Europe and USA into eight levels of difficulty (G, F, E, D, C, B, A, and X). G is an elementary level and X is an advanced level. The beginning reading level of a learner is deter- mined by the result of the EPER Placement/Progress Test, a 141-item cloze test.
In the early 1990s, the Hong Kong Department of Education purchased the EPER materials for providing English input to the learners in secondary school systems. At the time when the EPER materials were purchased by the Hong Kong Department of Education, they requested the Institute of Applied Language Studies at the University of Edinburgh to develop tests of comprehension of extensive reading so that those tests would be used to measure learners’ progress. The construction of reading comprehension tests was completed by the end of March 1992. A comprehension test was constructed for each of the eight levels (Davies & Irvine, 1996) and two versions became available: Version 1 and Version 2. The following sections describe EPER Reading Comprehension Tests Level E and Level D, focusing on items, test administra- tion and scoring, and the information on cut-off scores for deciding learners’ mastery of each level.
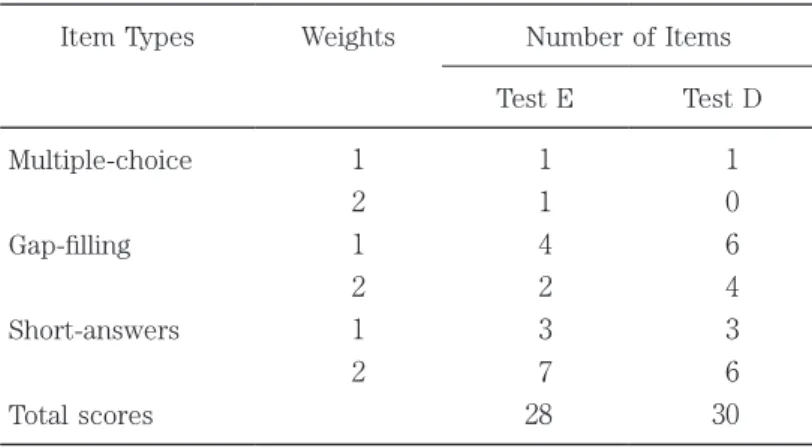
EPER Reading Comprehension Test items (Version 2 Level E and Level D tests) Each test contains both selected-response items and constructed-response items; however, most of the Level E and D test items are constructed-response items. Items 9 – 14 on Level E test are gap-filling items and test-takers are asked to fill in each blank with one or more words. Items 7 and 8 are multiple-choice items. The rest of the items are short-answer questions. Similarly, items 1 to 10 on Level D test are gap-filling items and Item 14 is a multiple-choice question and the rest of the items are short-answer questions. In both tests, two points are
Table 1 EPER Reading Comprehension Test items
Item Types Weights Number of Items
Test E Test D
Multiple-choice
Gap-filling
Short-answers
Total scores
1 2 1 2 1 2
1 1 4 2 3 7 28
1 0 6 4 3 6 30
assigned to about half of the items, which are mainly in gap-filling or short-answer format. Table 1 presents the item types, weights, and the number of items in each level.
Test Administration and Scoring
There are eight tests appropriate for each of the eight EPER reading levels ranging from low or most simplified level to high or unsimplified levels: G, F, E, D, C, B, A, X. These eight tests are paired (G/F, E/D, C/B, A/X) and each pair is administered together. Scorers are provided with a scoring rubric for each level and they mark learners’ responses following the rubric. The scoring rubric also indicates the weight of each item. However, it does not provide any description about giving credits to partially correct answers. A scorer has to decide whether partial points can be assigned for each of the two-point items.
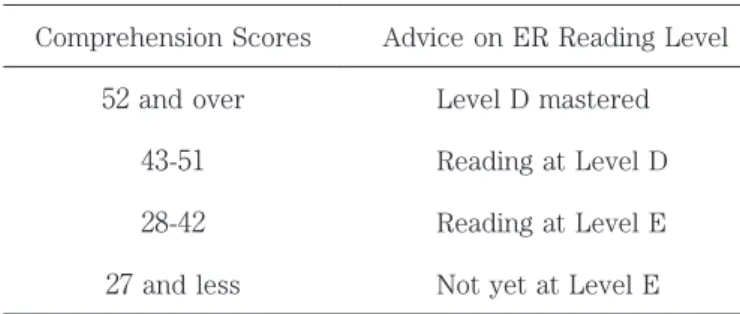
According to Davies and Irvine (1996), “a 75%+ correct response on a neighbouring test pair is taken as mastery at the higher level test of the pair, and a 50%+ correct response as adequacy; a 25%+ correct response is taken as mastery and 25%- as non-adequacy at the lower level test of the pair” (p. 169). Based on the percent of correct responses, a separate Score Guide for each version (i.e., Version 1 and Version 2) is provided so that the test results are used for placing learners on the EPER program or to assess their reading levels. Table 2 shows the score guide for Version Two Level E and D tests.
Table 2 EPER Score Guide for Version Two Level E and D
Comprehension Scores Advice on ER Reading Level
52 and over Level D mastered
43-51 Reading at Level D
28-42 Reading at Level E
27 and less Not yet at Level E
Since no information is available as to how cutoff scores were decided for the EPER reading comprehension tests, the current cutoff scores are based on the number-correct scoring method. A cutoff score (or cut score) is defined as “a point on a score scale, usually identified via a standard-setting procedure, which creates categories representing two or more states or degrees of performance” (Cizek & Bunch, 2007, p. 335). A cutoff score is a point on a score scale which indicates whether a learner’s performance has reached the standard set by a teacher or an institution.
Research Questions
The present study has two aims. The first aim is to examine whether partial credit method is plausible for scoring EPER reading comprehension tests. As indicated above, the scoring key does not provide any instructions about giving credits to partially correct responses. In practice, it is more likely that some responses of constructed-response items are not quite correct, but not quite incorrect, either. In those cases, giving partial credits can be applied to score those items. The present study aims to examine to what extent giving partial credits to partially correct responses would function. The second aim of the study is to determine whether the cutoff points based on the current scoring method adequately classify Japanese EFL learners at university level. Currently, number-correct method is used to score EPER reading comprehen- sion tests. That is, the number of correctly responded items is used to decide whether a learner is at the mastery level of a specific reading level on an EPER program. According to Davies and Irvine (1996), 75% or higher correct response is taken as mastery of the higher level test of paired tests; 50%, as adequacy of the higher level test; a 25%+, as mastery of the lower level test; and 25%-, as non-adequacy of the lower level test. Does the classification of the learners based on the number-correct scoring method function as it is intended?
METHOD
Participants
A total of 120 EFL students participated in the present study. They were the first- and second-year students at a four-year university located in the western part of Japan. Two thirds of the students read extensive reading materials for two semesters; the remaining students read a 318-page book in English. Class met once a week, 15 weeks each semester. The students’ majors were commerce, economics, and letters.
Instrument and Procedure
Levels E and D of EPER Reading Comprehension Tests were administered at the beginning of one-year reading classes. While reading each story, students were instructed as to which items they should answer. Test-taking time was 30 minutes for each level. Once the time assigned for taking one test was over, students were not allowed to go back to it, even though he or she finished the following test within the time.
Scoring
Although the scoring rubric does not provide any description about giving credits to partially correct answers in gap-filling and short-answer formats, one point was given to partially correct responses for the items with two points. One-point items are scored either 0 or 1: 0 is assigned for incorrect answers, and 1 for correct answers. Two-point items are scored either 0, 1, or 2: 0 is assigned for incorrect answers, 1 for partially correct answers, and 2 for correct answers. The present author and a specialist in applied linguistics examined partially correct answers and consensus was obtained between the two.
RESULTS
The responses to the items on Level E and D tests were analyzed together using Rasch Unidementional Measurement Model software (RUMM Laboratory). The Rasch model is a prob- abilistic model, which provides “the necessary objectivity for the construction of a scale” (Bond
& Fox, 2007, p. 7) and item difficulties are calibrated independently of the attributes of the people who take them. Similarly, person abilities are calibrated independently of the item diffi- culties. The application of the program requires that each item on a test contributes to the measure of a single trait. The main purpose of conducting Rasch analysis was to convert the data into an interval scale and place items and person on the same scale. The Partial Credit Model was used.
In order to confirm that the data fit the Partial Credit model, the following aspects were examined prior to obtaining the participants’ ability scores and item difficulties in logits: the item–total statistics, fit of items and persons to the model, the assumption of the local item independence, unidimensionality, threshold orders, targeting of the scale, and reliability. The Rasch analyses showed that two pairs of items were dependent on each other: items 12 and 13, and items 19 and 20. The latter item in each pair was deleted.
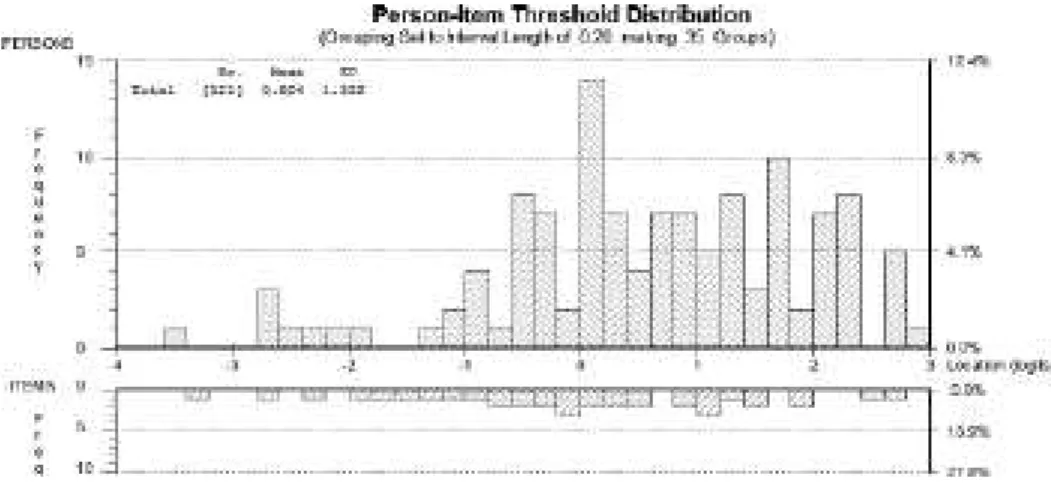
Table 3 shows the summary of the final analysis. When the data fits the model, the mean of the fit residuals becomes close to zero and the standard deviation becomes close to one. The results show a fairly good fit to the model. However, the means of the items and persons indi- cate that the mean of item logits is smaller than the mean of person logits, meaning that items were slightly easier for the participants. Also, the person separation index, a reliability index, was .89. Figure 1 shows the person-item distribution. Items are suitable to measure the ability ranges in general; however, for some ability ranges, more items suitable to measure those ability ranges are needed.
Disordered Thresholds
In order to answer Research Question 1, threshold analyses were conducted. 19 items have three response categories: those scored 0, 1, and 2. The initial analysis indicated that no respondent chose the middle category, category 1 (i.e., the score of 1), of six items (e5, e8, e12, e16, e17, d31). Further, the rest of the items with three categories show disordered thresholds. A threshold is a point at which the probability of selecting two adjacent categories is the same. As a person’s ability increases, it is more likely that he or she would score higher. Disordered thresholds mean that categories are not working as they are intended. Figure 2 shows the category probability curves for e15 and illustrates the disordered thresholds. The x-axis shows person location (ability) in logits. The y-axis shows the probability of a person with a given ability would respond correctly to the item with a certain level of difficulty. Figure 2 shows a curve with 0 on the left-hand side. This indicates that as the ability of a person increases, the probability of obtaining a score of 0 decreases. Similarly, there is a curve with 2 on the right.
Table 3 Summary statistics of the final Rasch analysis
Items Persons
Location Fit residuals Location Fit residuals
Mean 0 -0.106 0.604 -0.175
SD 1.416 1.138 1.322 0.75
Figure 1. The distribution of the persons and items
score (i.e., 2) increases. However, the middle curve (curve 1) is lower than other curves and does not indicate any specific point on the person ability continuum, x-axis. Also, the point on the x-axis where curves 0 and 1 meet is called Threshold 1; similarly, the point on the x-axis
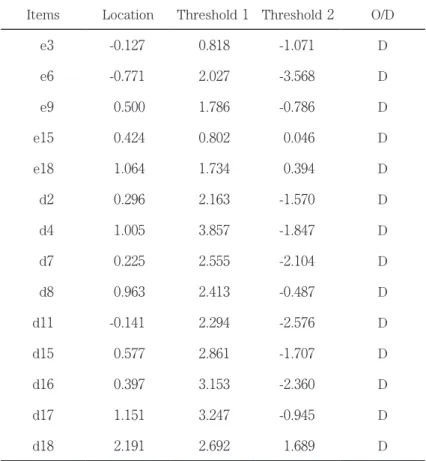
Table 4 Thresholds of items with three categories
Items Location Threshold 1 Threshold 2 O/D
e3 -0.127 0.818 -1.071 D
e6 -0.771 2.027 -3.568 D
e9 0.500 1.786 -0.786 D
e15 0.424 0.802 0.046 D
e18 1.064 1.734 0.394 D
d2 0.296 2.163 -1.570 D
d4 1.005 3.857 -1.847 D
d7 0.225 2.555 -2.104 D
d8 0.963 2.413 -0.487 D
d11 -0.141 2.294 -2.576 D
d15 0.577 2.861 -1.707 D
d16 0.397 3.153 -2.360 D
d17 1.151 3.247 -0.945 D
d18 2.191 2.692 1.689 D
Note: O/D = ordered (O) or; disordered (D) thresholds.
Figure 2. Category Probability Curves: Item e15
where curves 1 and 2 meet is called Threshold 2. If thresholds are ordered, Threshold 1 comes before Threshold 2. This means that a person needs more ability to obtain 1 than the ability needed to obtain 0. Similarly, he or she needs more ability to obtain 2 than the ability needed to obtain 1. Table 4 shows thresholds of the items which have three categories. All the items on Table 4 indicate that Threshold 2 is smaller than Thresholds 0 or Threshold 1. This means that a person needs more ability to obtain 0 or 1 than the ability needed to obtain 2. This is counterintuitive.
Classification of the participants based on the number-correct scoring method
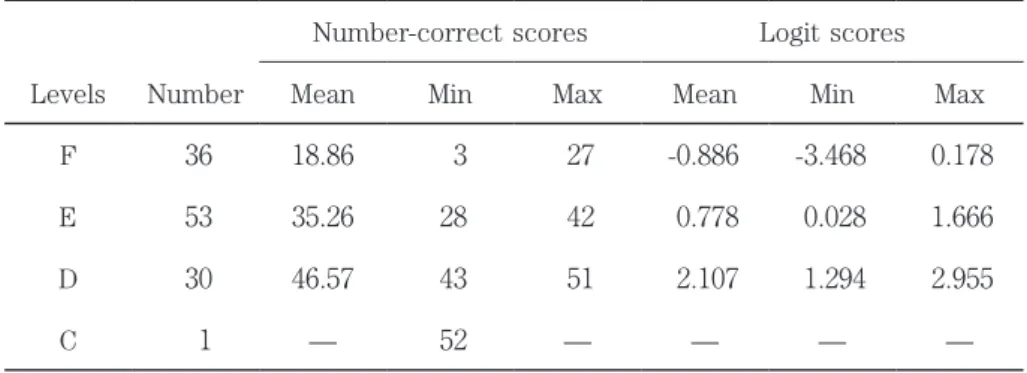
In order to answer Research Question 2, person abilities were obtained based on the final Rasch analysis. Also, the participants were classified into four levels, Level F, E, D, and C, based on their total scores of the EPER reading comprehension tests, the number of correct responses. Then, the ability range of each level was examined. Table 5 shows the score ranges of each level both in number-correct and logits scores.
Table 5 shows that the means of the four levels increase as a level increases whether it is in number-correct scores or in logits. However, the ranges show a different picture. In number- correct scores, Level F ranges from 3 to 27; Level E, from 28 to 42, and Level D, from 43 to 51. On the other hand, the abilities of Level F learners range from -3.468 to 0.178 in logits; those of Level E learners range from 0.028 to 1.666; and those of Level D learners range from 1.294 to 2.955. The maximum logit of Level F learners, 0.178, is higher than that of the minimum logit of Level E learners, 0.028, which is supposed to be higher than the most proficient Level F read- er’s ability, i.e., 0.178. 14 learners have logits ranging from 0.028 to 0.178. If we use the raw scores to classify learners, four of these 14 learners are classified as Level F and ten are classi-
Table 5 Descriptive Statistics in raw scores and logits
Number-correct scores Logit scores
Levels Number Mean Min Max Mean Min Max
F 36 18.86 3 27 -0.886 -3.468 0.178
E 53 35.26 28 42 0.778 0.028 1.666
D 30 46.57 43 51 2.107 1.294 2.955
C 1 — 52 — — — —
fied as Level E. Similarly, the maximum logit of Level E learners, 1.666, is higher than that of the minimum logit of Level D learners, 1.294, which is supposed to be higher than the most proficient Level E reader’s ability, i.e., 1.666. 21 learners have logits ranging from 1.294 to 1.666. If we use the raw scores to classify learners, 13 of these 21 learners are classified as Level E and eight are classified as Level D. Combining the borderline cases between F and E and between E and D, it is highly likely that 35 out of 120 learners are classified into inadequate levels, if raw scores are used for classification.
DISCUSSION
The present study aims to answer two research questions. The first question is to examine whether partial credit method is plausible for scoring EPER reading comprehension tests. Half of the items are given two points and it is likely that one point can be given to partially correct responses of those two-point items. Each of those items is treated as an item with three cate- gories; 0, 1, and 2. The result of the present study shows that crediting partially correct answers does not provide ordered thresholds for the items with three categories. In the present study, the number of the respondents who were given partial credits is small, ranging from 2 persons for item e3 to 24 persons for item e15. This might have been one of the causes for the disordered thresholds.
The second research question is whether the classification of the learners based on the number-correct scoring method functions as it is intended. The results show that about 30% of the students can be classified inadequately if the number-correct scoring method is applied. The consequence of misclassification may be serious if these tests are used for assessing learners’ achievement or entry to special reading programs.
Deciding whether a learner’s reading ability has reached a specific level in the EPER reading materials is equivalent to deciding whether a particular learners has reached a mastery or adequacy level on a reading ability continuum: it is a form of standard-setting. Cizek and Bunch (2007) define standard-setting as “the process of establishing one or more cut scores on exami- nations” (p. 5). Different standard-setting methods have been proposed and practiced. One of the often-practiced standard-setting procedures is called the Bookmark Method (Cizek & Bunch, 2007). The method uses the item response theory analyses in standard-setting. Prior to standard-setting sessions, an ordered item booklet (henceforth, OIB) is prepared. Each page of an OIB contains the information about each of test items such as an item difficulty, item type, and content. Those pages are ordered from easy to difficult according to item difficulty levels.
Participants, those who are involved in setting cutoff scores, read all the pages in the OIB and decide an item which “a minimally qualified or borderline examinee” is likely to answer correctly. (p. 162). Participants use a certain criterion when they judge the likelihood that a minimally qualified examinee can answer a particular item correctly (Cizek & Bunch, 2007). A 67% likeli- hood is often used (RP= .67). However, a 50% likelihood is argued as a preferred decision rule by those who conduct Rasch analysis (Wang, 2003).
If the cutoff scores set by the EPER score guide do not function properly for the learners in our context due to the fact that the current cutoff scores are based on number-correct scores, we need to set new cutoff scores for them. The Bookmark method is one of the proce- dures for setting cutoff scores. According to Cizek and Bunch (2007) and Ohtomo et al. (2009), the Bookmark method has several advantages over other standard-setting procedures. It is beyond the scope of this paper to list all the advantages of the Bookmark method in details. The primary advantage is that the Bookmark method has its basis in item response theory (IRT) analyses. IRT enables us to examine item difficulties independent of test takers and person abilities independent of item difficulties. Also, the Bookmark method enables the partici- pants to use all the information about test content and items. Further, the Bookmark method makes the tasks of participants rather simple and less subjective.
Educational implication
For the instructors who use the EPER reading tests, the results of the present study has two educational implications. First, even if partial credits are given to partially correct responses, thresholds are not ordered, that is, scoring categories are not progressing in a logical order. When disordered thresholds are observed, they need to be rescored. Alternatively, dichotomous scoring may be a solution. Second, when number-correct scoring method is used, the cutoff scores provided by the EPER score guide do not result in accurate classification. Teachers know the students in their classes well. They know a borderline examinee who is likely to pass each level of the EPER test with a 67% or a 50% likelihood. Or they can set the cutoff scores which would suit their needs.
ACKNOWLEDGEMENT This work was supported by JSPS KAKENHI Grant Number 24520678.
REFERENCE
Bond, T., & Fox, C. (2007). Applyng the Rasch Model: Fundamental Measurement in the Human Sciences. Mahwah, N.J.: Lawrence Erlbaum Associates.
Cizek, G., & Bunch, M. (2007). Standard Setting: A Guide to Establishing and Evaluating Performance Standards on Tests. Thousand Oaks: Sage Publications.
Davies, A., & Irvine, Aileen. (1996). Comparing test difficulty and text readability in the evaluation of an extensive reading programme. In M. Milanovic & N. Saville (Eds), Studies in Language Testing 3 (pp. 165-183). Cambridge: Cambridge University Press.
Nation, P., & Waring, R. (2013). Extensive Reading and Graded Readers. South Korea: Compass Publishing.
Ohtomo, K., Nakamura, Y., Koizumi, R., Yanagida, E., Watanabe, M., & Iimura, H. (2009). Gengo tesuto: mokuhyono toutatsu to mitotatsu [Setting Performance Standards on Language Tests]. Tokyo: ELPA. The University of Edinburgh English Language Teaching Centre. (n.d.). The Edinburgh Project on
Extensive Reading (EPER). Retrieved from http://www.ed.ac.uk/polopoly_fs/1.67916!/fileManager/ EPER.pdf
Yamashita, J. (2008). Extensive reading and development of different aspects of L2 proficiency. System 36, 661-672.
Yoshizawa, K, Takase, A, & Otsuki, K. (2013, August). The Effect of a Teacher’s Guidance on Japanese University EFL Learners’ Voluntary Reading Outside Class. Paper presented at the 52nd JACET International Convention, Kyoto University, Japan.