地球と生命 第 3 回 惑星大気の起源と進化
担当:黒川 宏之 (ELSI)
今日の資料は以下に掲載されています
https://members.elsi.jp/~hiro.kurokawa/lecture_files/EPS_EarthLife_Atmospheres.pdf
大気組成の多様性
2
N 2 , O 2 CO 2
CO 2
地球 火星
金星
岩石惑星
3
巨大ガス惑星・氷惑星 H 2 , He
氷天体 (タイタン・冥王星・トリトン)
N 2
惑星形成の場:原始惑星系円盤
アルマ望遠鏡によるHL tauのミリ波観測 Image credit: ALMA (ESO/NAOJ/NRAO)
4
5
組成:水素・ヘリウムガス主成分、質量比1%程度のダスト(塵) スノーライン(雪線):2-3 au?
を境に水蒸気が氷になる
惑星形成の場:原始惑星系円盤
巨大ガス惑星・巨大氷惑星:
円盤ガスを捕獲した大気
氷天体:
スノーライン以遠で形成し 揮発性物質をたくさん含む
岩石惑星:
スノーライン以遠の物質が
“少しだけ”もたらされた
彗星
6
太陽の影響で塵やガスを放出する, 氷と岩石のかたまり 岩石惑星に水や有機物をもたらした?
(否定的な意見もある)ヘールボップ彗星(1997年)
https://commons.wikimedia.org/wiki/File:Halebopp031197.jpg
ダストテイル
イオンテイル
流星群のメカニズム
小惑星帯
7
小惑星帯
木星
火星
探査機 Dawn が撮影
火星と木星の間にある小惑星群
1km以上のものは約100万体。総質量は地球の約 3000 分の1 水や有機物を含むものもいる
岩石惑星への揮発性元素(水・大気・有機物のもと)供給?
9
サンプル採取
着陸候補地域 約100 m
半径約 3 mのタッチダウン地点周辺
http://www.hayabusa2.jaxa.jp/topics/20190220_TDPoint/
リュウグウ表面は岩だらけ
安全性を重視した候補地点選定
半径 100 m → 3 m に予定変更
2月サンプル採取, 2020年末期間
火星:冷たく乾燥した惑星
Credit: NASA/JPL-Caltech/MSSS
INTRODUCTION
Water has long been recognized as a major morphological agent on Mars (Baker this issue), but its present abundance and location remain enigmatic. A possible reservoir for a substantial amount of water is surface and subsurface ice at the poles and mid-latitudes. Recent observations have sub- stantially improved our knowledge of this reservoir, but major questions remain as to its volume, age, and history.
Oscillations in the axial tilt, eccentricity, and timing of clos- est approach to the Sun cause major changes in surface heating, which produce cyclic changes in Martian climate on timescales of 105to 106 years (e.g. Pollack and Toon 1982). These changes redistribute polar ice, transferring it to lower latitudes as snow and ice during Martian “ice ages”
(e.g. Jakosky et al. 1995). Today the major ice-bearing fea- tures are the polar ice caps, the layered units that surround them at both poles, and the mid-latitude permafrost zones that present morphologies strongly suggestive of subsurface ice. Each of these has unique properties, water abundances, and histories, and contributes to the water cycle in varying ways.
POLAR CAPS
The polar caps of Mars (FIG. 1) have been observed since the 17th century and are assumed to be composed of some combination of H2O and CO2 ice. The Martian atmosphere is composed of >95% CO2 with a pressure of only a few millibars. This fact led to the prediction that CO2 would accumulate at the poles during winter (Leighton and Murray 1966). This prediction was confirmed by orbital tempera- ture measurements (e.g. Kieffer 1979), and global mapping has shown that seasonal CO2caps grow well into the mid- latitudes during winter, with perennial ice caps surviving
the summer at both poles. The thickness of the seasonal CO2 ice caps has been estimated from Mars Global Surveyor (MGS) Mars Orbiter Laser Altimeter (MOLA) observa- tions to reach approximately 1.5 m near the pole in both hemispheres (Smith et al. 2001), corresponding to ~25% of the total mass of the Martian atmosphere.
As the seasonal caps condense, they incorporate minor amounts of dust and H2O ice, which signifi- cantly affect the sublimation rates the following spring. Assuming a water vapor mass fraction of 1 × 10⁻⁵ in the condensing atmosphere, the amount of water stored in the seasonal caps is estimated at ~3 ×10¹⁰kg (~3 × 10⁻² km3) (the Martian atmosphere contains ~10-1 km3 of water). Overall, however, the water within the sea- sonal caps plays a relatively minor role in the global inven- tory or annual cycle of water on Mars.
151 JUNE 2006
151
Philip R. Christensen
11 Department of Geological Sciences Arizona State University
Box 871404, Tempe, AZ 85287-1404, USA E-mail: [email protected]
T
he poles and mid-latitudes of Mars contain abundant water in ice caps,thick sequences of ice-rich layers, and mantles of snow. The volume of the known reservoir is ≥≥5 x 10
6km
3, corresponding to a layer ~35 m thick over the planet. Hydrogen in subsurface H
2O ice has been detected at latitudes poleward of 50°. Morphological features show downslope flow of ice-rich sediment, and recent gullies have been produced from subsurface aquifers or melting snowpacks. Variations in Mars’ orbit on timescales of 50,000 to 2,000,000 years produce significant changes in climate, which result in the transport of water from the poles, where it currently resides, to the lower latitudes, where it may play a critical role in surface geology, mineralogy, and geochemistry.
KEYWORDS: Mars, ice, water, polar caps
Water at the Poles
and in Permafrost Regions of Mars
EL E M E N T S, VO L. 2 , P P. 1 5 1 – 1 5 5
The north polar cap of Mars as seen by Viking. This mosaic of images was acquired during northern summer when the ice had retreated to its perennial size. The relatively bright material is H2O ice. The cap has shrunk to essentially the same location every year that it has been imaged by spacecraft (1971 to present) (James and Cantor 2001). Image width is ~900 km. IMAGE CREDITNASA/JPL
FIGURE1
平均気温 約-60℃ 地球 約15℃
希薄なCO 2 大気 約 0.006 気圧 → 温室効果小 乾燥した地表, 北極・南極に僅かな氷があるのみ 全球平均 20 mの海に相当 地球 約 3 km
10
金星:乾燥した灼熱の惑星
平均気温 約470℃ 地球 約15℃
ぶ厚いCO 2 大気 約 90 気圧 → 温室効果 濃硫酸の雲に覆われている
乾燥した地表 水蒸気を水換算すると深さ 数 cm
11
探査機ベネラ13号が
撮影した金星の地表
(credit: NASA)
大
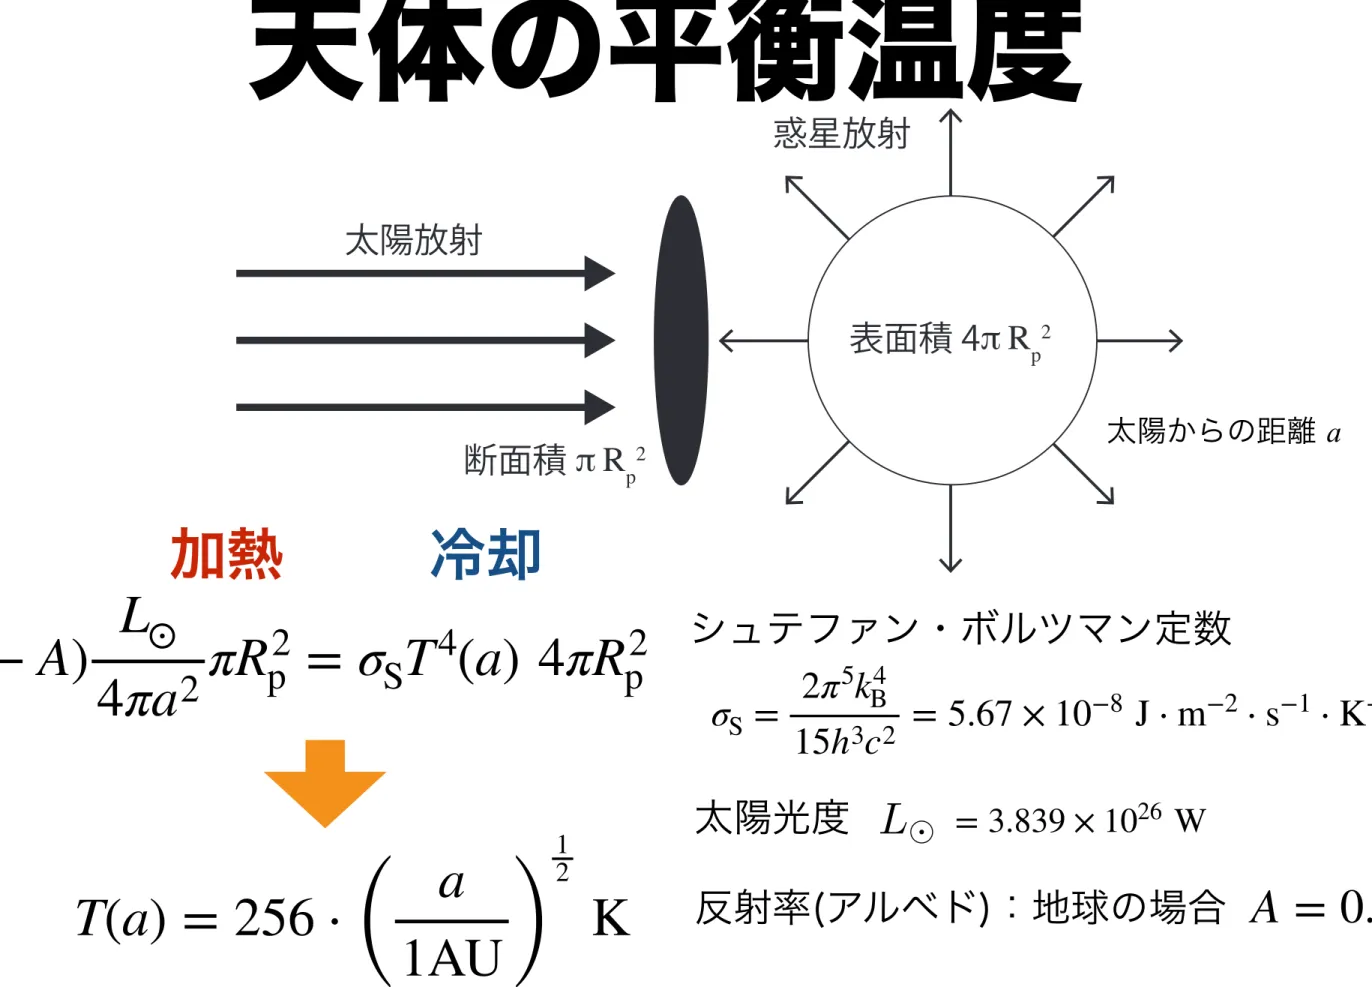
天体の平衡温度
12
33
第 3 章 惑星間空間
3.1
太陽輻射場3.1.1
惑星の平衡温度太陽系内の天体の温度はおおよそ太陽放射による加熱と放射冷却が釣り合うエネルギー平 衡にある。天体を黒体であるとした時、天体の平衡温度は第
1
章で原始惑星系円盤の温度構 造を求めた時と同様にして求めることができる。球形の天体(
図3-1)
における太陽放射の吸 収と再放射のつり合いの式は、L !
4πa 2 πR 2 p = σ S T (a) 4 4πR p 2 , (3.1)
ここで、R p
は惑星半径、a
は太陽からの距離、L !
は太陽光度、σ S
はStefan-Boltzmann
定 数、T (a)
は天体の平衡温度である。式変形して、T (r ) = 280 ! a 1 AU
" − 1/2
K, (3.2)
のように平衡温度
T (a)
を求めることができる。惑星が大気をもっている場合、大気の温室効果により、惑星の表面温度は平衡温度より高 くなる
(
第4
章にて後述)
。このような場合、平衡温度は惑星放射に対して大気が光学的に厚 くなる高度における温度におおよそ対応している。太陽放射
断面積
π R
p 2
表面積 4
π R
p 2
惑星放射
図
3-1
.太陽放射と惑星放射の釣り合い。3.1.2
輻射圧光子は運動量を持っているため、太陽からの放射を吸収した物質は輻射圧と呼ばれる力を 受ける。エネルギー
hν
の光子の運動量はhν /c
である。光を吸収する物体として、一様密度加熱 冷却
(1 − A) L ⊙
4πa 2 πR p 2 = σ S T 4 (a) 4πR p 2
T(a) = 256 ⋅ ( a
1AU )
1 2
K
33
第 3 章 惑星間空間
3.1 太陽輻射場
3.1.1
惑星の平衡温度太陽系内の天体の温度はおおよそ太陽放射による加熱と放射冷却が釣り合うエネルギー平 衡にある。天体を黒体であるとした時、天体の平衡温度は第
1
章で原始惑星系円盤の温度構 造を求めた時と同様にして求めることができる。球形の天体(
図3-1)
における太陽放射の吸 収と再放射のつり合いの式は、L !
4π a 2 πR 2 p = σ S T (a) 4 4πR 2 p , (3.1)
ここで、R p
は惑星半径、a
は太陽からの距離、L !
は太陽光度、σ S
はStefan-Boltzmann
定 数、T (a)
は天体の平衡温度である。式変形して、T (r) = 280 ! a 1 AU
" − 1/2
K, (3.2)
のように平衡温度
T (a)
を求めることができる。惑星が大気をもっている場合、大気の温室効果により、惑星の表面温度は平衡温度より高 くなる
(
第4
章にて後述)
。このような場合、平衡温度は惑星放射に対して大気が光学的に厚 くなる高度における温度におおよそ対応している。太陽放射
断面積
π R
p 2
表面積 4
π R
p 2
惑星放射
図
3-1
.太陽放射と惑星放射の釣り合い。3.1.2
輻射圧光子は運動量を持っているため、太陽からの放射を吸収した物質は輻射圧と呼ばれる力を 受ける。エネルギー
hν
の光子の運動量はhν /c
である。光を吸収する物体として、一様密度σ S = 2π 5 k B 4
15h 3 c 2 = 5.67 × 10 −8 J ⋅ m −2 ⋅ s −1 ⋅ K −4
シュテファン・ボルツマン定数太陽光度
= 3.839 × 10 26 W
反射率(アルベド):地球の場合
A = 0.3
太陽からの距離
a
液体の水の存在可能領域:ハビタブルゾーン(HZ)
13
門屋他(2012)
日本惑星科学会誌, Vol. 21, No. 3.
78
第7
章 惑星表層環境進化7.3 ハビタブル・ゾーン
大気の温室効果がなくても 液体の水が存在できる領域
ハビタブルゾーン 暴走温室
状態
全球凍結
30 0 W /m
状態2
)1= 陽 太 ( 度 光 の 星 心 中
中心星からの距離 ( 天文単位 )
地球 2.0
1.5
1.0 0.5
00 0.5 1.0 1.5 2.0 2.5 3.0
温室効果の低下 によって全球凍結
図
7-1.
地球型惑星の気候状態とハビタブル・ゾーン。門屋他(2012),
日本惑星科学会誌Vol.
21, No. 3
より。惑星の表面において
H 2 O
が液体として存在できるかは、第一には惑星の受け取る中心星 放射の量に依存する。惑星系において液体のH 2 O
を保持するのに適した領域をハビタブル・ゾーン
(Habitable Zone,
生命居住可能領域)
と呼ぶ(
図7-1)
。液体のH 2 O
の存在は地球生命 の居住の必要条件に過ぎず、ハビタブルという言葉の本来の意味と同じではないが、アスト ロバイオロジーの分野においては惑星の表層環境と生命の存在を議論する上で、便宜的にこ のような定義を置いている。惑星表面に
H 2 O
以外に温室効果ガスとなり得る物質が存在しない場合、ハビタブル・ゾー ンは極めて狭い。これは受け取る中心星放射量が増加(
減少)
すると、地表温度の上昇(
下降)
に伴い、H 2 O
のうち温室効果ガスである水蒸気として存在する量が増加(
減少)
するためで ある。このフィードバック機構は受け取る中心星放射量の変化に対する地表温度の変化を増 幅する働きがある(
図7-2)
。受け取る中心星放射量がある閾値(
約300 Wm − 2 )
を超えると、このフィードバック機構が暴走的に作用し、
H 2 O
はすべて蒸発してしまう。このような状態 を暴走温室状態と呼ぶ。逆に受け取る中心星放射量が小さく、惑星表面のH 2 O
がすべて氷と なった状態を全球凍結状態と呼ぶ。一方で、ハビタブル・ゾーンの外側境界の位置は
H 2 O
以外の温室効果ガスの種類や存在量 に依存する。現在の太陽系の地球型惑星において、この温室効果ガスとして重要となるのはCO 2
である。CO 2
の量が多いほどハビタブル・ゾーンの外側境界は遠方に位置するが、あま りに受け取る中心星放射が小さいとCO 2
が凝結して気体ではなく固体として存在してしま う。この位置がCO 2
の温室効果によるハビタブル・ゾーンの最外縁である。また、太陽系に は存在しないが、系外惑星においてはH 2
大気の温室効果によって表面に海を持つ惑星の存 在可能性も議論されている。現在の金星はハビタブル・ゾーンの内縁より太陽に近く、暴走温室状態にあると考えるこ とができる。現在の地球は
CO 2
の温室効果によるハビタブル・ゾーンの中にある。CO 2
の 温室効果によるハビタブル・ゾーンがどこまで広がっているかはよくわかっていないが、火温室効果ガスなしで
液体の水が存在できる領域
14
入射量⬆→温度高⬆→水蒸気(温室効果ガス)⬆
ある上限値を超えると暴走温室状態 → 海が全て蒸発
HZの内側境界:暴走温室状態
成層圏の水蒸気混合比 (破線)
太陽光フラックス [地球=1]
地表面温度 [K] (実線)
水の
臨界温度
暴走温室状態 湿潤温室状態
Catling & Kasting (2017)
15
宇宙空間に流出する惑星大気
真空紫外線で撮像された地球 (100-200 nm)
• 太陽光 (Lyman-α) を地球大気を取り囲んで広がる水素が散乱
→ 地球大気起源の水素が流出している
• 大気散逸は惑星大気と表層環境進化の要因の一つ
• 湿潤温室状態にあった金星から大量の水 ( 水素 ) が失われた
Rairden et al. (1986)
火星の水の痕跡
LETTERS NATURE GEOSCIENCE DOI: 10.1038/NGEO891
MOLA elevation (km)
¬2.5 ¬1.8
B
A
1 km
¬2.0
A B
¬2.2
¬2.4
Elev ation (km)
¬2.6 0 3 6
Distance (km)
Apex
(Max) Front
(Mean)
Bottom (Min) A
B Apex
Front
Max
Min Bottom
9 N
Mean
Figure 1 | Data and methodology used for the analysis of the martian deltaic deposits. Left: Context image of a sedimentary deposit in Nepenthes Mensae (No 14 of Supplementary Table S1). The dots indicate the location of the available MOLA-shot measurements. Right: The topographic profile AB shows the morphometry of the deposit (left panel for location). The bottom schematic diagram illustrates the morphometric indicators used for the extraction of the elevation values for each delta. The error bar defines the maximum water level excursion; the black square corresponds to the delta front (mean water highstand). See the Methods section for explanations.
complete closure within and along the margins of the northern lowlands (Fig. 2 and Supplementary Fig. S2), delineating the boundary of the basin within which the deposits formed. The standard deviation (177 m) of S is remarkably small if spread across the entire length of the global contour, comparable to the total variation of the terrestrial geoid ( ⇠ 200 m), and significantly smaller (up to one order of magnitude) than the dispersed values previously obtained for the elevations of Contact 1 (Arabia shoreline, Fig. 2c) and Contact 2 (Deuteronilus shoreline)
3. Therefore, the deposits topographically connected to the site occupied by the putative ocean define the closest approximation of an equipotential surface as would be expected if they formed in a single large body of standing water encompassing the northern hemisphere of Mars.
Moreover, the S level is consistent with large portions of the
‘Arabia shoreline’ previously identified from geomorphologic and topographic analyses
1,4(Fig. 2c) and is also close to its average value ( 2 , 499 m, compare the trendline of this contact with S in Fig. 2c). In particular, S is consistent with the previous observational evidence at (1) Terra Sirenum, (2) in the northern part of Tempe Terra, (3) along the circum-Chryse Planitia region, (4) within northern Arabia Terra and the fretted terrain regions of Deuteronilus Mensae and finally (5) across the crustal dichotomy along the Nepenthes and Aeolis Mensae regions and the surroundings of Gale crater (Fig. 2).
Notably, a further twelve deltas that formed in closed basins (green triangles in Fig. 2) fall within the error bars of the S level.
However, to include these deposits in the same group of the S level, thus totalling ⇠ 55% of the present global database, it must be assumed that a water table should have intersected the surface at this base level all over the planet. Indeed, the S level ( 2,540 ± 177 m) is virtually the same as the 2,550 m elevation suggested by theoretical calculations for the global distribution of water during the Noachian
4. Moreover, the latter value was derived from thermophysical properties of Mars with the assumption that water was saturating the crust and ponding in hydrostatic equilibrium on the surface of the planet
4. Therefore, the analysis
of 29 sedimentary deposits ( ⇠ 55% of total deltas) supports this thermal-hydraulic reconstruction, implying that a vast ocean and large seas were present in the northern hemisphere and in Argyre and Hellas basins, respectively. Several groundwater-fed palaeolakes would have contemporarily emerged within a region of a few hundreds of kilometres wide upslope from the S ocean boundary and the crustal dichotomy and around the rim of Argyre and Hellas within craters deep enough to reach the S level (Fig. 2a and Supplementary Fig. S2). The palaeolakes would have been almost entirely concentrated in the topographically gradational zone of Arabia Terra, a province where sedimentary and morphological studies support the occurrence of palaeolakes
19,20and indicate that putative spring deposits exist within craters
21. Furthermore, an anomalous concentration of craters with extensive exposures of eroded layered sedimentary deposits
19–22and other distinguishable spectral and elemental properties (including also an elevated hydrogen content) have been reported for Arabia Terra and interpreted to be the results of a past volatile-rich history
19–22. Similar layered sequences and other evidence suggestive of past lacustrine activity have also been suggested for Hellas and Argyre
4,22,23and increasingly reported during the past years also for craters along the rim of the main Hellas basin
24,25, thus making the case for the occurrence of a Noachian basin-wide sea within Hellas
23and a series of surrounding palaeolakes within a range of elevations compatible with the S level
24,25. Finally, although the analysis of deltas cannot uniquely confirm the occurrence of large seas in Hellas and Argyre, if there was an ocean on the northern plains as a component of a martian global hydrosphere, water must have ponded also in these two basins
4.
The reconstructed equipotential surface is also generally con- sistent with the distribution and terminations of martian valley networks
8excluding the region between 30 W and 60 E, that is, the topographically gradational zone of Arabia Terra (Fig. 2).
Arabia Terra is characterized by smooth elevation variations
5and it is possible that the S surface may mark a different level of the same ocean previously mapped here at slightly higher elevations
460
NATURE GEOSCIENCE| VOL 3|JULY 2010| www.nature.com/naturegeoscience2014/11/12 Google
https:// .google.co.jp/maps/@34.6466597,136.5251989,7524m/data=!3m1!1e3 1/1
2014 Google, Da a SIO, NOAA, U.S. Na , NGA, GEBCO, Te aMe ic , 2014 Google, ZENRIN 500 m :
火星 地球
Di Achille & Hynek (2010) Nature
cemented and made up of rounded to subangular rock fragments larger than 2 mm in diameter in a finer-grained matrix of sand or silt).
Additional evidence for a fluvial interpreta- tion is the stratification at Hottah. Alternating pebble-rich and sand layers (Fig. 3C) indicate fluctuations within sediment transport that result in size sorting of the deposits. In bedload trans- port, the presence of sand mixed with fine peb- bles leads to a sorting instability within flows that produces shallow migrating bedforms (bedload sheets), resulting in fine-scale vertical variations in grain sorting (23), as observed at Hottah.
Alternative sediment transport mechanisms to water flows are inconsistent with the observed rock characteristics. For example, the well-developed rounding of the pebbles together with clast fabric, specifically the grain-to-grain contact and local imbrication, make mass transport as a debris flow unlikely. Likewise, pebble clusters and the rela- tively wide size range of pebbles within the de- posit are inconsistent with transport and deposition by wind. The largest grains mobilized by wind will move via creep driven by impacts from abun- dant saltating finer grains. On Mars, 1- to 2-mm grains are driven by creep, leading to formation of megaripples observed at both Mars Explora- tion Rover landing sites [e.g., (24)]. The result of this process is a relatively thin surface layer of uniformly sized clasts due to size-dependent down- wind (creep) migration rates, which differs in both geometry and the coarse grain size range (2 to 40 mm) within the martian conglomerates described here. The higher density of liquid fluids relative to air results in higher bed shear stress (and a buoyancy force on the particle), which can mobilize coarse sediment.
A number of factors influence the develop- ment of rounded clast perimeters in fluvial trans- port, including the original clast size, shape, and lithology, as well as the grain size of the bed material (21, 25). Sand commonly acts as an abrasive agent when transported with pebbles in fluvial systems, causing the coarser particles to round more rapidly (21, 22). The presence of coarse sand and rounded pebbles in the martian rocks is consistent with a highly abrasive flow.
For clasts of the same size, lithology is the major factor affecting the rate of downstream rounding [e.g., (25–27)]. On the basis of published data for pebbles in natural streams and fluvial abrasion experiments for a range of compositions [e.g., (25–27)], and assuming an initial angular pebble, we estimate a minimum transport distance of a few kilometers to produce a rounded pebble surface.
On Mars, the elastic collisions within the flow may have had lower energy due to the reduced gravity, resulting in lower abrasion rates and lon- ger transport distances to achieve similarly rounded pebbles. Overall, the rounded pebbles of apparently diverse lithology within the martian conglomerates are strong evidence for sustained fluvial transport.
The grain size distribution can be used to es- timate the critical shear stress for sediment mo- bility, and in turn the flow depth and mean velocity
assuming a water surface slope between 0.1 and 1% (17, 28–30) (tables S3 to S5). This range of slope values corresponds to the nearby alluvial fan slope (1%) and an approximate lower value (0.1%) for gravel-bedded streams [e.g., (31, 32)].
For the clast size distributions observed in the three conglomerates, the minimal flow depth (suffi- cient to initiate motion) is 0.03 to 0.9 m and the corresponding average flow velocity is estimated to be 0.20 to 0.75 m/s. In all cases, the estimated Fig. 2. Comparison of pebbles at Link and a terrestrial analog site. (A) Link was imaged with the 100-mm Mastcam on sol 27 (17). (B) Rounded clasts of similar size and shape are observed in comparably sized distal alluvial fan deposits on Earth, such as this example from the Atacama Desert, Chile.
Fig. 3. Examples of sedimentary texture and fabric in the Hottah outcrop. (A) The Hottah outcrop has fractured and gently tilted (~30°) blocks, as seen in this mosaic of Mastcam images taken on sol 39 (17). (B) The perimeter of a well-rounded pebble protruding from the outcrop (upper black arrow, long axis ~3 cm) is smooth. White arrow points to parallel stratification. (C) In places, there are alternating protruding, pebble-rich layers (black arrows) and recessive layers. An example of a clast-supported pebble cluster is marked by the yellow circle. (D) Example of imbricated clasts.
31 MAY 2013 VOL 340 SCIENCE www.sciencemag.org 1070
RESEARCH ARTICLES
on May 7, 2019 http://science.sciencemag.org/ Downloaded from
火星
Williams et al. (2013) Science
地球数多くの火星探査
- Mars Global Surveyor, Curiosity, …
水に関連した地形の発見
- 渓谷, 三角州
- 角の取れた小石, 堆積岩 現在の火星は寒冷
平均気温 >0℃とするには 数気圧のCO 2 大気が必要
16
火星の三角州地形の分布
17
NATURE GEOSCIENCE DOI: 10.1038/NGEO891 LETTERS
60° S
Terra Sirenum Tempe Terra
Chryse Planitia
Arabia Terra
Denteronilus Mensae Nepenthes/Aeolis Mensae Tharsis
rise 30 ° S
0 ° 30 ° N 60 ° N
150 ° W
180 ° 120 ° W 90 ° W 60 ° W 30 ° W Xanthe Terra
Tharsis rise S
S
S
S S
Argyre Planitia
Arabia Terra
¬8,208 21,249
Ocean Land
S
S
MOLA elevation (m)
Hellas Planitia
0 ° 30 ° E 60 ° E
Amazonian Hesperian Noachian
90 ° E 120 ° E 150 ° E 180 °
150 ° W
180 ° 120 ° W 90 ° W 60 ° W 30 ° W 0 ° 30 ° E 60 ° E 90 ° E 120 ° E 150 ° E 180 °
MOLA elev ation (km)
3 2
S0 S
S0
S 1
0
¬1 –2 –3 –4
–5 –180 –120 –60 0
Longitude ( ° )
60 120 180
a
b
c
60 ° S 30 ° S 0 ° 30 ° N 60 ° N
Figure 2 | Topography, geology and distribution of valleys and deltas on Mars. a, Topography of Mars with superimposed deltas connected to the
northern plains (red squares) and in closed basins (green triangles and blue diamonds, see the Methods section). Some of the 52 deposits are located too close to each other and thus overlap at this map scale (see Supplementary Table S1 for the complete list of deposits); the white contour indicates the
equipotential surface S . b, Martian valley networks (black lines) 8 in relation to the three main geological epochs 30,31 (main craters in yellow). c, Elevation of the deltas as a function of longitude and the equipotential surface S (red line) inferred by considering only open deltas (S0, red dashed line, indicates the mean highstand level of all of the 52 deltas); the error bars indicate the maximum water excursion for each delta. The grey dots represent elevation values extracted from the ‘Arabia shoreline’ 4 and the black dashed line the linear trendline of these values.
NATURE GEOSCIENCE | VOL 3 | JULY 2010 | www.nature.com/naturegeoscience 461
Di Achille & Hynek (2010)
赤:北部低地に流入 青, 緑:盆地に流入
三角州は北部低地を取り囲むように存在 かつての海?
太陽活動による大気散逸
磁場のある惑星 磁場のない惑星
極端紫外線放射, 太陽風によって上層大気が流出
磁場がある(地球) 太陽風が侵入しない磁気圏を持つ 磁場がない(火星, 金星) 太陽風が大気に影響
地球磁気圏:地球半径の約 11 倍
金星・火星の電離圏界面:惑星半径の1/10以下(数100 km)
19
火星の水の行方
20 REPORT
◥MARTIAN GEOLOGY
Exposed subsurface ice sheets in the Martian mid-latitudes
Colin M. Dundas,
1* Ali M. Bramson,
2Lujendra Ojha,
3James J. Wray,
4Michael T. Mellon,
5Shane Byrne,
2Alfred S. McEwen,
2Nathaniel E. Putzig,
6Donna Viola,
2Sarah Sutton,
2Erin Clark,
2John W. Holt
7Thick deposits cover broad regions of the Martian mid-latitudes with a smooth mantle; erosion in these regions creates scarps that expose the internal structure of the mantle. We
investigated eight of these locations and found that they expose deposits of water ice that can be >100 meters thick, extending downward from depths as shallow as 1 to 2 meters below the surface. The scarps are actively retreating because of sublimation of the exposed water ice. The ice deposits likely originated as snowfall during Mars ’ high-obliquity periods and have now compacted into massive, fractured, and layered ice. We expect the vertical structure of Martian ice-rich deposits to preserve a record of ice deposition and past climate.
O ne-third of the Martian surface contains shallow ground ice. This ice is a critical target for science and exploration: it affects modern geomorphology, is expected to pre- serve a record of climate history, influences the planet’s habitability, and may be a potential resource for future exploration. The extent of Martian ground ice and the depth to the ice table have been predicted in theory (1–3) and have been tested both in situ (4) and from orbital ob- servations (5–11). However, the vertical structure of subsurface ice remains poorly known, includ- ing its layering, thickness, and purity, which record its emplacement and subsequent modifi- cation processes. Information about the structure, depth, and purity of shallow ice is also required to plan possible in situ resource utilization (ISRU) on future missions (12).
Early theoretical predictions suggested that Martian subsurface ice would be ice-cemented ground (2). Orbital neutron-spectrometer data have revealed ice contents greater than the likely pore space volume in the upper few centimeters of the ice table in many locations (5–7). Shallow ice (<1 to 2 m) exposed by fresh impacts remains distinct for months or years, also indicating a low rock or dust content, although possibly modified by the impact process (9, 10, 13). The Phoenix lander on the northern plains uncovered both ice- cemented regolith and deposits of pure (~99 vol-
ume %) ice (4, 14) at a few centimeters depth.
The ice at that site likely extends to 9 to 66 m depth on the basis of shallow radar reflections (15), but geomorphic interpretations suggest that ice-cemented ground is dominant there (16).
However, ice-loss landforms indicate that several regions on Mars have high ice volume fractions extending through substantial subsurface depths (17, 18), and radar echo power data have sug- gested high ice contents beneath areas of the northern plains (8). Subsurface radar reflections indicate the presence of debris-covered glaciers (19, 20) as well as buried regional ice sheets in the Utopia and Arcadia Planitiae regions that are up to 170 m thick and nearly pure ice (21, 22).
Because the radar did not resolve the top of the ice, it is likely to be within ~20 m of the surface, the limit of the radar instrument’s ability to iden-
tify shallow signals (15). The smaller-scale structure of the ice sheets and rocky cover are unresolvable with current radar data. It remains unknown whether the ice within a few meters of the sur- face has the same origin and age as the deeper ice because the upper ice is most readily modi- fied and best coupled to the recent climate.
We describe observations of the vertical struc- ture of ground ice using the Mars Reconnaissance Orbiter (MRO). The observations target eight loca- tions that have steep, pole-facing scarps created by erosion (Figs. 1 and 2 and figs. S1 to S3) in images from the High-Resolution Imaging Science Exper- iment (HiRISE); seven are located in the southern hemisphere, and the eighth location is a cluster of scarps in Milankovič Crater in the north (table S1).
Each of the scarps is relatively blue (compared with surrounding terrain) in enhanced-color HiRISE images, and three locations have water-ice signa- tures in mid-summer spectral data (Fig. 3 and figs. S4 and S5) taken by MRO’s Compact Recon- naissance Imaging Spectrometer for Mars (CRISM) (23). CRISM spectra show an H
2O ice absorption feature at 1-mm wavelength (fig. S6), which can be masked by as little as 1% soil (14). Tens of micro- meters of dust are needed to make an opaque cover ( 24), so the dust content is low and/or wind re- moves dust.
Several lines of evidence indicate that the scarps are exposures of subsurface ice rather than per- sistent seasonal frost. First, they remain distinct from the surrounding terrain in color in all HiRISE images, including many observations acquired long after seasonal frost has sublimed from steep pole-facing slopes at higher latitudes. Second, Mars Odyssey Thermal Emission Imaging System (THEMIS) observations indicate late-afternoon scarp temperatures above the likely atmospheric frost point (23). Last, nearby pits lack relatively blue material that would be expected for topo- graphically controlled frost (fig. S7).
The units hosting the scarps drape the terrain, with some meter-scale boulders on the surface RESEARCH
Dundaset al.,Science359, 199–201 (2018) 12 January 2018
1 of 3
1Astrogeology Science Center, U.S. Geological Survey, 2255 N.
Gemini Drive, Flagstaff, AZ 86001, USA.2Lunar and Planetary Laboratory, University of Arizona, Tucson, AZ, USA.
3Department of Earth and Planetary Sciences, The Johns Hopkins University, Baltimore, MD, USA.4School of Earth and Atmospheric Sciences, Georgia Institute of Technology, Atlanta, GA, USA.5The Johns Hopkins University/Applied Physics Laboratory, Laurel, MD, USA.6Planetary Science Institute, 1546 Cole Boulevard, Suite 120, Lakewood, CO 80401, USA.7Institute for Geophysics, Jackson School of Geosciences, University of Texas at Austin, Austin, TX 78758, USA.
*Corresponding author. Email: [email protected]
Fig. 1. Pits with scarps exposing ice. (A and B) Scarps 1 and 2. Both (A) and (B) show HiRISE red-filter data merged with the center color strip (23) in early-summer observations. Parallel ridges indicate retreat of scarps (fig. S1). North is up and light is from the left in all figures.
on January 17, 2018 http://science.sciencemag.org/ Downloaded from
春夏に現れる流水(?)地形
100 m
急斜面に露出した地下氷
and few impact craters. The surface textures show some fracturing (fig. S8), probably due to thermal contraction. Ice is expected to be stable near 10 cm depth under level ground at these locations (3).
The scarps are sharply defined and nearly straight, up to ~6 km long, and face slightly east of pole- ward. Each scarp constitutes the equatorward side of a few-kilometer-scale pit with a rugged and sometimes boulder-rich floor, except in Milankovič Crater, where they are part of the ragged edge of a smooth plateau (fig. S2). In several cases, ridge structures parallel the scarp within the pit and merge with cusps along the margin.
The base of the exposed ice appears to be covered by colluvium (Fig. 2). In several cases, surface expressions of long fractures with surrounding depressions occur on the terrain above the scarp (fig. S8).
Topographic data (figs. S9 and S10) for Scarp 1 (numbering is provided in table S1) indicates that the ice exposure has a slope of ~45° (up to 55° in some locations), transitioning to a shal- lower slope for the regolith-covered lower scarp.
We estimate the scarp-hosting material to be at least 130 m thick after correcting for the regional slope, although the exposed ice has≤100 m of relief because the lower slope is buried. The former value provides a better estimate of the ice-rich thickness if all of the relief is due to ice loss.
These scarps reveal the vertical structure of the ice. At several locations, ice reaches close to the top of the scarp (Fig. 2), indicating that massive ice begins at shallow depths (≤1 m). Banded patterns or variations in color or slope at some sites suggest subunits within the ice. At Scarps 6 and 7, the banded patterns show unconformities where layers cut across each other (fig. S3). The uppermost section of the scarp at each site ap- pears steeper and less blue than the remainder.
Like the Martian polar deposits (25), the color and brightness of the surface may be partially controlled by a thin coating of dust (likely a sub- limation lag) and thus not representative of the bulk properties. Because lags and contaminants
will reduce the visibility of ice, it is likely that clean ice near the surface is more extensive than the limited locations where it is exposed (Fig. 2).
At Scarp 2, a lens-shaped section of the ex- posure lacks relatively blue coloration (Fig. 4A) and contains a concentration of boulders. Repeat images taken 3 Mars years apart show that meter- scale blocks fell from within or below this lens- shaped section (Fig. 4, B and C), providing evidence of active slope retreat. Because these blocks did not disappear after they fell [unlike ice blocks excavated by craters (10)] and originated as pro- trusions from the icy layer, they must be rocks that were embedded within the deposit, not chunks of ice broken off the scarp. Other sites have not shown similar blockfalls, but mottled shifts in tone and texture are common, and dark mark- ings a few meters across appeared and disappeared at the base of some scarps (fig. S11).
The Shallow Radar (SHARAD) on MRO has detected radar contacts (reflectors) that have been interpreted as the base of ice layers in the northern plains of Mars (15,19–22). Similar features occur near several of the scarps (fig. S12) but are dif- ficult to distinguish from radar clutter caused by local rugged topography. Candidate reflectors in the three SHARAD tracks closest to Scarp 1 do not appear in clutter simulations by using topo- graphy derived from either Mars Orbiter Laser Altimeter (MOLA) or High-Resolution Stereo Camera (HRSC) data (23), suggesting that they could be due to the bottom of the massive ice layer. However, candidate reflectors near Scarp 5 have possible counterparts in the HRSC-based clutter simulations, suggesting that they are not subsurface features. Only these two sites have topographic data available at suitable resolu- tion, and given the rough terrain, we cannot currently rule out unresolved clutter as the cause of candidate reflectors. Nondetections may be due to surface roughness or stratigraphic con- tacts that are gradual or otherwise do not pro- duce a sharp dielectric contrast on the scale of the radar footprint.
We interpret these scarps as exposures of sub- surface ice originating as dusty snow or frost (26–29) and subsequently compacted and recrys- tallized. This interpretation is consistent with the high ice content and the mantling appearance of the host unit. Alternative explanations, such as growth of ice lenses (30) or enhanced vapor dif- fusion (31), are expected to be slow and operate at shallow depths. They should also produce layer- ing parallel to the ground surface, unlike the layers at Scarps 6 and 7 (fig. S3). The latest ice deposition could have been geologically recent because there are few craters on the surface. The fractures and steep slopes indicate that the ice is cohesive and strong. The presence of banding and color varia- tions suggest layers, possibly deposited with changes in the proportion of ice and dust under varying climate conditions, similar to the Martian polar-layered deposits (25). The lens-like body of lower ice content at Scarp 2 (Fig. 4A) may be a buried moraine transported by ice flow because subtle arcuate surface topography suggests gla- cial flow at this location (fig. S13). Alternatively, it could be a former sublimation lag; that would require some additional process to explain the presence of boulders, but some are found on the surface of the mantling deposit elsewhere (23), so this cannot be ruled out.
It is likely that the scarps are currently re- treating owing to sublimation. Slope retreat caused by sublimation would explain rocks falling from Scarp 2, although the proximate cause could be seasonal frost processes or thermal cycles. Be- cause the boulders that fell from the scarp are meter-scale, with a few percent of the boulders present having fallen over an interval of 3 Mars years, the likely retreat rate is on the order of a few millimeters each summer (unresolvable with remote imagery). This estimated retreat rate indicates that the pits may have formed over a time scale on an order of 106years; however, the retreat rate is probably not constant. Ridges and bands paral- leling the scarps may indicate former positions (Fig. 1).
Dundaset al.,Science359, 199–201 (2018) 12 January 2018 2 of 3
Fig. 2. Enhanced-color transverse sections of icy scarps in late spring/
early summer.(AtoF) Arrows indicate locations where relatively blue material is particularly close to the surface. Downhill is to the bottom in (A) to
(E) (Scarps 1 to 5, respectively) and to the top in (F) (MilankovičCrater).
Banding or layering is visible in several scarps, and (E) shows a distinct change in color as well as multiple fractures cutting the ice.
RESEARCH | REPORT
on January 17, 2018 http://science.sciencemag.org/Downloaded from
火星の水の一部は宇宙空間へ流出
極冠に加えて, 低中緯度に地下氷層があるかもしれない
McEwen et al. (2014)
Dundas et al. (2018)
40 30 20 10 0
( )
1.0 0.9
0.8 0.7
( 1 )
-50 -25
0 25
( )
20 !?
( ) !
( )
暗い太陽のパラドックス
40億年前の太陽光度は現在の70%
大気組成が現在と同じ場合、20億年以上前は全球凍結
田近英一氏2011年フロンティアセミナー資料より
21
炭素循環による気候安定化
門屋他 (2012) 日本惑星科学会誌, Vol. 21, No. 3.
295
《フロンティアセミナー・テキスト》地球惑星環境進化論 第1回/門屋 他
の太陽系では2.4 AU付近)までハビタブルゾーンを広 げる可能性もある[4](ハビタブルゾーンの境界につい ての詳細は,阿部(2009)[5]を参照のこと).
以上の議論でも分かるとおり,ハビタブルゾーンと いうのは液体の水が物理的に存在できる条件を満たす 領域のことであって,実際に水が液体として存在して いることを保証するものではない.ハビタブルゾーン
に軌道を持つ惑星表面に,実際に水が液体状態で存在 するためには,十分な量の水が存在しなければならな いほか,大気の(通常はCO
2
による)温室効果が必要で ある.上述の議論では,これらの条件が暗に仮定され ている.もし温室効果ガス(例えばCO2
)が大気中に十 分存在しなければ,たとえ惑星の軌道がハビタブルゾ ーンにあったとしても,H2
Oは凍ってしまう.このことは,太陽放射と地球放射のつり合いで決ま る地球の有効温度が−18 ℃であり,もし大気の温室 効果がなければ液体の水は安定に存在できないことや,
実際,過去において地球は繰り返し全球凍結したとい う事実からも理解できるであろう.大気中にCO
2
等の 温室効果気体が含まれないとした場合,惑星表面に液 体のH2
Oが存在できる軌道領域はきわめて限られる(暴走温室限界より外側でかつ有効温度が273 K以上 の領域)[6](図1).
つまり,惑星が水惑星として存在できるためには,
ハビタブルゾーン内部に軌道を持つことに加え,大気 中に十分な量の温室効果ガスを有していること,また その温室効果が長期にわたって安定的に維持されるこ とが本質的に重要な条件となる.
地球の長期的な表層環境進化において二酸化炭素
(CO
2
)は重要な役割を担ってきたものと考えられてい る.CO2
は温室効果を持つこと,表層に多量に存在す ること,そして光化学的にも安定であることがその理 大気の温室効果がなくても液体の水が存在できる領域
ハビタブルゾーン 暴走温室
状態
全球凍結
300 W/m
状態2
中心星の光度 (太陽=1)
中心星からの距離 ( 天文単位 )
地球 2.0
1.5
1.0 0.5
00 0.5 1.0 1.5 2.0 2.5 3.0
温室効果の低下 によって全球凍結
火山活動
脱ガス
マントル
CO 2
風化・侵食
熱水交換反応 Ca2+
HCO-3
ガス成分の還流 変成作用
付加
CaCO3
CaCO3
大陸 脱ガス
沈殿
気温上昇で風化率増大 → CO
2
減 気温下降で風化率減少 → CO2
増太陽が暗い時代は大気中のCO 2 が多くなり地表を温暖に HZの外側境界:CO 2 が氷になる軌道位置
22
大酸化イベント
23
酸素発生型光合成生物の活動により、
約25億年前に酸素分圧が上昇
Before or After GOE ?
A) (detrital pyrite)
C) (BIF)
B) (Red Bed)
D)
( )
BIF
( )
20
: (Paleosol)
: (MIF)
2.2Ga Hekpoort paleosol! (Beukes et al., 2002)! Fe
Before or After GOE ?
A) (detrital pyrite)
C) (BIF)
B) (Red Bed)
D)
( )
BIF
( )
20
: (Paleosol)
: (MIF)
2.2Ga Hekpoort paleosol!
(Beukes et al., 2002)! Fe
還元的
Fe 2 S
酸化的
Fe 2 O 3
東京大学出版会『宇宙生命論』
まとめ
24
大気の多様性は惑星の形成・進化を反映
巨大ガス惑星・巨大氷惑星 H 2 ・He大気:原始惑星系円盤ガス 氷天体(タイタン・冥王星・トリトン) N 2 大気:
スノーライン以遠で形成し揮発性元素を大量に含む
岩石惑星:雪線以遠で形成した小天体が少しだけ集積 金星・地球・火星の進化を隔てたもの
HZの内側境界:暴走温室, 外側境界:CO 2 の凍結 金星の暴走温室状態 → 水の大気散逸
地球の海形成と炭素循環による気候安定化 → N 2 , O 2 大気 太陽風による大気散逸