厚生労働科学研究費補助金(循環器疾患・糖尿病等生活習慣病対策総合研究事業) 研究報告書 健康寿命の国際的な指標化に関する検討 研究協力者 尾島 俊之 浜松医科大学健康社会医学講座教授 研究分担者 橋本 修二 藤田保健衛生大学医学部衛生学講座教授 研究協力者 川戸美由紀 藤田保健衛生大学医学部衛生学講座講師 研究要旨 JA EHLEIS(健康・平均寿命情報システムに関する欧州共同事業)に参画して、国際的 な指標化に関する検討を行うことが本研究の主目的である。併せて、日本における健康寿命の状 況を海外に報告するとともに、国際的な健康寿命に関する動向を情報収集し、健康寿命の算定、 活用に関する国際的ハーモナイゼーションを図ることを目的とした。2013 年 4 月に開催された会 合において、健康日本21(第二次)、健康寿命の将来予測の結果、欧州で算定されている健康 寿命指標についての日本における値の推定結果、日本における所得及び学歴による平均寿命格差 の推定結果についての報告を行った。また、新しい指標の開発に向けて提案を行うなど、議論に 参画した。さらに、日本の健康寿命に関する情報について英語による発信をして欲しい旨の要望 を得たため、健康日本21(第二次)参考資料の健康寿命に関する部分について英語訳を行った。 A.研究目的 健康寿命は、健康日本21(第二次)におい て、最も代表的な健康指標として採用されてお り、日本国内における都道府県別の比較や、ま た年次による推移が検討されている。健康寿命 はもともと国際的に開発された指標であること から、国際的な比較を行うことにより、諸外国 と比較した日本の特徴を明らかにすることがで きる。その結果は、これからの日本の保健施策 を検討する上でも有用であると考えられる。 一方、健康寿命は、健康日本21(第二次) で使用されている「日常生活に制限のない期間 の平均」や、「自分が健康であると自覚してい る期間の平均」の他にも、何を健康/不健康と 定義するかによって、さまざまな指標の算定が 可能である。どのような健康寿命が有用である かについては、保健医療状況の変化など時代の 変遷にともなって変わってくる可能性がある。 そこで、JA EHLEIS(Joint Action European Health and Life Expectancies Information System、 健康・平均寿命情報システムに関する欧州共同 事業)では、国際的な連携によって、健康寿命 をベースとした新しい総合健康指標の開発に取 り組んでいる。 このJA EHLEIS に参画して、国際的な指標 化に関する検討を行うことが本研究の主目的で ある。併せて、日本における健康寿命の状況を 海外に報告するとともに、国際的な健康寿命に 関する動向を情報収集し、健康寿命の算定、活 用に関する国際的ハーモナイゼーションを図る ことを目的とした。 B.研究方法 2013 年 4 月 17~19 日に、フランス・パリに おいて開催された、JA EHLEIS(健康・平均寿 命情報システムに関する欧州共同事業)に、参 加の招聘に応えて参画した。日本の状況を報告 するとともに、欧州及び米国での状況について 情報収集し、新しい総合健康指標の開発に向け ての検討を行った。さらに、プロジェクトリー ダーであるDr. Jean-Marie Robine(Institut national de la santé et de la recherché médicale,
France、フランス国立衛生医学研究所)と日本 の健康寿命の状況について個別の意見交換を行 った。 さらに、JA EHLEIS において、日本の健康 寿命に関する情報について、英語による発信を して欲しい旨の要望を得たため、健康日本21 (第二次)参考資料の健康寿命に関する部分に ついて英語訳を行った。その他の日本における 健康寿命に関する情報についても、順次、英語 による情報発信を行っていく予定にしている。 C.研究結果 2013 年 4 月に開催された会合において、日 本からの報告としては、本報告の後ろに掲載し ている "Healthy Life Expectancies in Japan" と "Concept for a new Global Disability Indicator" の2本の報告を行った。"Healthy Life Expectancies in Japan" においては、健康日本2 1(第二次)、前年度の「健康寿命における将 来予測と生活習慣病対策の費用対効果に関する 研究」班による健康寿命の将来予測の結果、欧 州で算定されている健康寿命指標についての日 本における値の推定結果、日本における所得及 び学歴による平均寿命格差の推定結果について の報告を行った。なお、JA EHLEIS では欧州 各国の健康寿命について、「日常生活に制限の ない期間の平均」(Global Activity Limitation Indicator (GALI) に基づく Life expectancy without activity limitation)、「慢性疾患の無い 期間の平均」(Life expectancy without chronic morbidity)、「自分が健康であると自覚してい る期間の平均」(Life expectancy in very good or good perceived health)の3つの指標について、 毎年算定している。
"Concept for a new Global Disability Indicator" においては、事前にメール上で意見 交換し、作成された working paper などについ ての議論を行った。事前の検討においては、 ICF (International Classification of Functioning, Disability and Health) における参加
(participation)に焦点をあてた総合健康指標 の開発が重要ではないかという議論が出たため、 それを中心とした意見を報告した。また、現在、 欧州で使用されている3つの健康寿命指標につ いて、改変の必要性の有無などについての意見 を述べた。また、参加に焦点をあてた指標とし て「閉じこもり」または「社会的孤立」の指標 化についての提案を行った。 なお、この会合には、EU 各国(20 か国+ α)、欧州委員会(Eurostat、SANCO)、OECD などの公衆衛生研究所・行政・大学関係者など が参加した。EU 域外からは、米国(CDC)と 日本が招聘されて参加した。 最後に、健康日本21(第二次)参考資料の 健康寿命に関する部分の英語訳の結果について は、本報告の後ろに掲載している通りである。 なお、この翻訳は、当分担研究班の責任におい て行ったものであり、厚生労働省による公式訳 ではない。ただし、健康日本21(第二次) (厚生労働省告示第四百三十号(平成24 年 7 月10 日)国民の健康の増進の総合的な推進を 図るための基本的な方針)の公式訳で使用され ている用語についてはそれに準拠して翻訳を行 った。 D.考察 JA EHLEIS の会合において、日本と欧州の 健康寿命の比較を報告した際に、特にスウェー デンとの比較で日本の平均寿命は長いのに対し、 健康寿命が短いことに対しては、日本における 延命治療などによる部分があるのではないかと いうコメントが寄せられた。また、所得や学歴 による平均寿命格差の状況については、欧州と 比較して驚異的に格差が小さいというコメント が寄せられた。 会合における新しい総合健康指標の検討に関 しては、狭い意味での参加だけではなく、活動 (activities)なども含めたより広い ICF の概念 を考慮した指標とするのが良いのではないかと の意見が出された。そのため、提案を行った閉
じこもりや社会的孤立などについてよりは、米 国CDC などで検討されている、activity of daily living (ADL)の要素に着目した健康寿命につい ての検討を深めてはどうかという意見などが出 された。 健康日本21(第二次)参考資料の健康寿命 に関する部分の英語訳については、その情報提 供によって、日本における健康寿命の検討状況 などについての国際的な理解が得られる一助に なると考えられた。 E.結論 JA EHLEIS(健康・平均寿命情報システム に関する欧州共同事業)に参画し、健康寿命の 国際的な指標化に関する検討を行うと共に、日 本と欧米との健康寿命の状況などについての情 報交換を行った。 F.研究発表 1.論文発表 なし 2.学会発表
1) T Ojima, S Hashimoto, I Tsuji, H Tsutsui, T Noda, M Nakamura, K Kondo, M Lagergren , H Van Oyen, JM Robine. Healthy Life Expectancy in Japan and comparison with EU. 6th European Public Health Conference. 13-16 Nov 2013, Brussels, Belgium. (Eur J Public Health 2013; 23(suppl1):44.) G.知的財産権の出願・登録状況(予定を含 む) 1.特許取得 なし。 2.実用新案登録 なし。 3.その他 なし。
Healthy Life Expectancies
in Japan
Toshiyuki OJIMA, MD, DrPH
Professor of
Department of Community Health and Preventive Medicine, Hamamatsu University School of Medicine, JAPAN
April 18, 2013
JA-EHLEIS
Contents
• Governmental actions about healthy life expectancies in Japan • Selected results of the Research
Group about Healthy Life Expectancy in Japan
• Preliminary results about healthy life expectancy in Japan
Health Japan 21 (2nd edition)
• Published as the Official Public Notice #430 ofMinister of Health, Labour and Welfare Japan in July 10, 2012
according to the Health Promotion Law
Chair of the planning committee was Prof. Ichiro TSUJI in Tohoku University
http://www.mhlw.go.jp/bunya/kenkou/kenkounippon21.html (in Japanese)
Four main concepts
of the Health Japan 21 (2nd edition)
http://www.maff.go.jp/e/ccasia/18/pdf/as18_crd08e_appendix_1_item9_japan.pdf (English chart)
Health Japan 21 (2nded) set 64 target indices
Target #1. Extend the healthy life expectancy • More than the increase of life expectancy • Healthy life expectancy without activity limitation
from the data of the Comprehensive Survey of Living Conditions
• Healthy life expectancy by self perceived health should also be used as the supplemental indices Target #2. Reduce the health inequity
• Measured by the gap of the healthy life expectancy between the 47 prefectures
Official supplemental paper for Health Japan 21 (2ndedition)
Gap between life expectancy (LE) and healthy life expectancy (HLE)
Men
Women
years
LE HLE without activity limitation Gap between LE and HLE
Source: LE (2000): The life table by the Ministry of Health, Labour and Welfare HLE (2000): The Research Group about Healthy Life Expectancy
Official supplemental paper for Health Japan 21 (2ndedition)
Men Women
LE HLE
Time trend of life expectancy (LE) and healthy life expectancy (HLE)
2000
2000 1997
1997 1994
1994 1991
1991
Source: LE (2000): The life table by the Ministry of Health, Labour and Welfare HLE (2000): The Research Group about Healthy Life Expectancy
Official supplemental paper for Health Japan 21 (2ndedition)
Healthy life expectancy without activity limitation by prefectures
Men: Top 71.74 (Aichi) Bottom 68.95 (Aomori) Gap 2.79 years Women: Top 75.32 (Shizuoka) Bottom 72.37 (Shiga) Gap 2.95 years
Source: The Research Group about Healthy Life Expectancy
Contents
• Governmental actions about healthy life expectancies in Japan
• Selected results of the Research Group about Healthy Life
Expectancy in Japan
• Preliminary results about healthy life expectancy in Japan
Healthy Life Expectancies calculated by the research group
(1) Disability free life expectancy (without activity limitation) 日常生活に制限のない期間の平均
– Used for the Health Japan 21 (2ndedition)
– Using self-administered questionnaire data (2) Life expectancy with self-perceived health
自分で健康であると自覚している期間の平均 – Using self-administered questionnaire data
(3) Disability free life expectancy (without care need) 日常生活動作が自立している期間の平均
– Using Long-term Care Insurance Data
* (1) and (2) are useful for national and prefectural level (3) is especially useful for municipality level
Principal Investigator: Prof. Shuji HASHIMOTO in Fujita Health University
Question for activity limitation
Q6 Do you have any health problem which affect daily living now?1 Yes 2 No
Q6-1 How is it affect ? Select all of applicable items. 1 Activity of daily living
2 Going out
3 Working, housekeeping, studying 4 Physical activities
5 Others
Used in the national Comprehensive Survey of Living Conditions conducted by the Ministry of Health, Labour and Welfare of Japanese government
78.2 83.2 69.9 73.3 70.4 73.6 1.5 3.2 9.7 13.1 9.2 12.8 0 20 40 60 80 Men Women Men Women Men Women Life Expectancy at age 0 and expected years in Japan Expected years Without activity limitation With activity limitation (by the national Comprehensive Survey of Living Conditions questionnaire)
in good, rather good, or ordinary perceived health
in bad or rather bad perceived health
Without care need With care need
17.2 20.5 13.7 16.5 13.1 15.3 1.6 3.4 5.2 7.4 5.7 8.6 0 5 10 15 20 25 Men Women Men Women Men Women Life Expectancy at age 65 and expected years in Japan Expected years Without activity limitation With activity limitation
(by the national Comprehensive Survey of Living Condition questionnaire)
in good, rather good, or ordinary perceived health
in bad or rather bad perceived health
Without care need With care need
(by the Long‐term care Insurance Data)
Observed data and forecasting for healthy life expectancy without activity limitation
Men Women Observed Forecasting: Forecasting: Forecasting:
continue current prevalence extrapolated
possible target
Contents
• Governmental actions about healthy life expectancies in Japan
• Selected results of the Research Group about Healthy Life Expectancy in Japan
• Preliminary results about healthy life expectancy in Japan
Methods of conversion
• Subjects: 2,700 randomly selected residents of 20+ years old in 6 municipalities in Shizuoka prefecture, Japan • Self administered mail survey
• Response: 1,774 (66.0%) • Questionnaire:
– Activity limitation, the same as the Japanese national survey – Activity limitation by GALI
– Chronic morbidity, the same as EU
– Self perceived health, the same as the Japanese national survey • Conversion table was made and applied to the national data • Limitations
– Not a nationally representative sample – Sample size might not be enough
Conversion table
Activity limitation (national Comprehensive Survey of Living Conditions qestionnaire) Age groupActivity limitation (GALI)
Total With severe With moderate Without With 20-39 17.4% 34.8% 47.8% 100.0% 40-64 22.2% 44.4% 33.3% 100.0% 65-74 23.1% 50.0% 26.9% 100.0% 75- 52.7% 35.1% 12.2% 100.0% Total 35.1% 39.9% 25.0% 100.0% Without 20-39 1.2% 5.8% 93.0% 100.0% 40-64 .7% 8.2% 91.0% 100.0% 65-74 1.1% 13.9% 85.0% 100.0% 75- 2.2% 25.0% 72.8% 100.0% Total 1.1% 10.8% 88.1% 100.0%
Results are almost same between men and women.
Conversion tables from self perceived health to chronic morbidity, and from activity limitation to chronic morbidity are also made.
France and Sweden are selected just as examples, because it is too busy if all of the EU countries are on the figure
Comments
• GALI of Japan is around the midpoint between France and Sweden.
• Duration with chronic morbidity of Japan is long as France.
• Duration with bad health of Japan is longer than France and Sweden. Majority of Japanese are with “ordinary” health.
Methods of life expectancy
inequality estimation
• Subjects: 21,047 community dwelling older people in 8 municipality in Japan
• Followed up 2 - 4.5 years
• Hazard ratios were calculated by quantile of income and education attainment • These data are from the AGES project • Applied to the national life table in 2000
Practices to reduce heath inequality and to extend the healthy life expectancy in Japan
• Community health promotion volunteers (86.8%) • Salon or café for older people (67.0%)
• Following up children by public health nurses according to their household economic situation (65.5%)
• Community bus service by public sectors (59.1%) • Providing healthy lunch and cooking education at
elementary schools (almost 100%) ( ) : proportion of active municipalities
from the preliminary results of the Research Group about Social Determinants of Health and collaborated survey
Concept for a new
Global Disability Indicator
Toshiyuki OJIMA, MD, DrPH
Professor of
Department of Community Health and Preventive Medicine, Hamamatsu University School of Medicine, JAPAN
April 19, 2013
JA-EHLEIS seminar
General comments
• Excellent working paper with
comprehensive and detailed discussion • Focusing on measuring participation of
ICF is quite reasonable
• Scoring system according to the selected criterion is very useful.
Framework of health expectancies Current set of health expectancies
1. GALI
2. Chronic morbidity 3. Perceived health
The working paper are discussing about criticism of GALI.
Problems of chronic morbidity and perceived health should also be discussed.
New framework of health expectancies
1. GALI
2. Chronic morbidity 3. Perceived health
Change to a new indicator? Then, we should focus on activitylimitation
Add a new indicator as the 4thone?
Then, focusing on participation might be meaningful challenge Measuring participationwould be important, because it is more affected by social system including interpersonal interaction and transportation than biological conditions.
Changing “chronic morbidity” to a new indicator might be another option.
Subcategories of “activities and participation” in ICF
1. Learning and applying knowledge 2. General tasks and demands 3. Communication
4. Mobility 5. Self-care 6. Domestic life
7. Interpersonal interactions and relationships 8. Major life areas
9. Community, social and civic life
Activity
Participation
Covering all of the subcategories of “activities and participation” would be quite difficult.
If we focus on “participation”, “community, social and civic life” or “interpersonal interactions and relationships” would be useful.
Conclusion
• GALI would be a good indicator, even if it has some problems.
• If we use a new indicator instead of GALI, the new indicator should be focused on activity limitation like GALI.
• If we add a new indicator or change instead of chronic morbidity, “participation” would be a key concept.
Homeboudness
• We often assess homeboudness for olderpeople in Japan.
• It is highly related to their health and life prognoses and a major risk factor
• It is a kind of objective behavioral measurement for participation
• Importance of going out might be sometimes questionable
Selected reference: Bruce ML, et al. Psychiatric status among the homebound elderly: an epidemiologic perspective. J Am Geriatr Soc 1992; 40(6): 561-566.
Questionnaire of homeboundness
• How often do you go out? (Going out include visiting neighbours, shopping, going to the hospital)
a. 4 times or more/week b. 2 or 3 times/week c. once/week d. 2 or 3 times/month e. a few times/year f. do not go out
We regard people who go out less than once/week as homebound.
Another participation indicator
• If we focus on “participation”
rather than activity, how about
to consider “social isolation” ?
Thank you!
Developing a new indicator
is a really meaningful
Extension of healthy life expectancy and reduction of health disparities
in the Reference Material for Health Japan 21 (the second term)
i. Introduction
Healthy life expectancy is defined as the length of life that an individual lives without limitation in daily activities due to health problems. Extension of healthy life expectancy is given as one of the goals presented in Health Japan 21. At the time, however, clarity was lacking in the concept of healthy life expectancy and methods of estimating it, and no specific figure or goals for healthy life expectancy were presented.
With recent developments in research, however, there is growing consensus with regard to the concept of healthy life expectancy and methods of estimating it. Health Japan 21 (the second term) shows current figures for healthy life expectancy as well as how those goals are viewed.
ii. Basic philosophy
(i) Extension of healthy life expectancy
Extension of healthy life expectancy is a core issue in Health Japan 21 (the second term), and its inclusion as an indicator is essential to the program. Showing current figures for healthy life expectancy and regularly estimating subsequent changes are beneficial in managing the progress of a national health promotion movement.
Various definitions of healthy life expectancy and ways of estimating it exist. First, with regard to the definition of healthy life expectancy, a mutually complementary evaluation is possible by taking the more objective “average period of time spent without limitation in daily activities” as the main index, and the more subjective “average period of time individual consider themselves as healthy” as a secondary index. Next, for the method of estimation, calculations based on Comprehensive Survey of Living Conditions data (disability-free life expectancy using the Sullivan method) are thought to be the most appropriate based on considerations of consistency and feasibility with current public statistics and other factors.
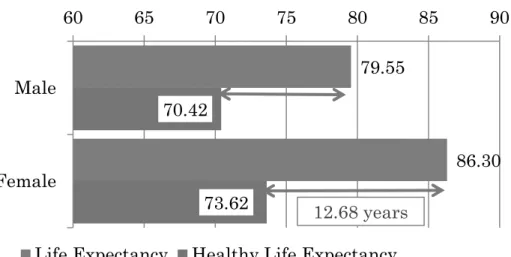
In setting target values, the focus is on the difference between life expectancy and healthy life expectancy. The difference between life expectancy and healthy life expectancy is the “unhealthy period” in which an individual spend with limitation in daily activities. The difference between life expectancy and healthy life expectancy (period of time spent without limitation in daily activities) was 9.13 years in men and 12.68 years in women in 2010 (Figure 1).
If this difference with healthy life expectancy grows as life expectancy increases, the period during which large expenditures for medical care and care benefits are consumed will become longer. If the difference between life expectancy and healthy life expectancy can be reduced by
79.55 86.30 70.42 73.62 60 65 70 75 80 85 90 Male Female
Life Expectancy Healthy Life Expectancy
years
(period of time spent without limitation in daily activities)
12.68 years
Diference between life expectancy and healthy life expectancy
preventing disease, promoting health, and avoiding the need for care, we can expect not only to prevent decreases in individuals’ quality of life, but also to reduce the social security burden. It is very important that we approach this problem from the perspective of launching a new national health promotion movement that also contributes to a sustainable social security system.
Figure 1. Difference between life expectancy and healthy life expectancy
(Sources: Life expectancy (2010): “Complete Life Table 2010” by Ministry of Health, Labour and Welfare; healthy life expectancy: Health and Labour Sciences Research Grants “Study on future predictions of healthy life expectancy and cost-effectiveness of measures to prevent lifestyle-related diseases”)
(ii) Reduction of health disparities
The health disparities are defined as differences in health status among a population due to region and socioeconomic status. Given that data on regional disparities are collected with considerable accuracy, and that effects can be expected when local governments advances their own independent efforts after identifying the gaps between themselves and other local governments, the focus in current plans is placed on regional disparities.
For each local government, identifying and analyzing factors in the healthy life expectancy gap, and thinking of strategies to extend healthy life expectancy, are important in advancing health promotion.
governments and strengthening efforts to close those gaps, but the most important is healthy life expectancy.
iii. Present status and goals
(i) Extension of healthy life expectancy
Target measure Average period of time spent without limitation in daily activities Present status Men 70.42 years, women 73.62 years (2010)
Goal To extend healthy life expectancy more than increase of life expectancy* (2022)
Data source Health and Labour Sciences Research Grants “Study on future predictions of healthy life expectancy and cost-effectiveness of measures to prevent lifestyle-related diseases”
Note: Estimations based on Comprehensive Survey of Living Conditions *To accomplish the above goals, not only the “average period of time spent without limitation” but “average period of time individuals consider themselves as healthy.”
“Average period of time spent without limitation in daily activities” was calculated using the Sullivan method, with basic data taken from Comprehensive Survey of Living Conditions and Life Table (see the latter page for the calculation method). The figures used in current values were calculated based on the Health and Labour Sciences Research Grants “Study on future predictions of healthy life expectancy and cost-effectiveness of measures to prevent lifestyle-related diseases.” A comparison of period of time spent without limitation in daily activities (healthy life expectancy) between 2001 and 2012 revealed that it rose from 69.40 years to 70.42 years in men, an increase of 1.02 years, and from 72.65 years to 73.62 years in women, an increase of 0.97 years. Meanwhile, life expectancy during the period years rose from 78.07 years to 79.55 years in men, an increase of 1.48 years, and from 84.93 years to 86.30 years in women, an increase of 1.37 years (Figure 2).
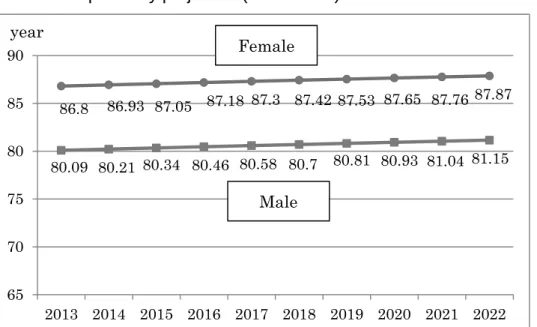
According to Population Projection of Japan (January 2012 estimates) by National Institute of Population and Social Security Research, life expectancy in the years from 2013 to 2022 is predicted to rise from 80.09 years to 81.15 years in men, an increase of 1.06 years, and from 86.80 years to 87.87 years in women, an increase of 1.07 years (Figure 3).
Figure 2. Trends in life expectancy and healthy life expectancy
(Sources: Life expectancy: Ministry of Health, Labour and Welfare’s “Abridged Life Table” in 2001, 2004, and 2007, “Complete Life Table” in 2010; healthy life expectancy: Health and Labour Sciences Research Grants “Study on future predictions of healthy life expectancy and cost-effectiveness of measures to prevent lifestyle-related diseases”)
Figure 3. Life expectancy projection (2013–2022)
(Source: “Population Projection of Japan (January 2012 estimates)” by National Institute of Population and Social Security Research)
It is predicted that in the future not only the period of health but also the period of unhealth will become longer as life expectancy increases. Therefore, greater efforts to promote the health of citizens are important, so that the healthy life expectancy is extended by more than the increase of
78.07 78.64 79.19 79.55 69.4 69.47 70.33 70.42 65 70 75 80 85 90 2001 2004 2007 2010 years Male 84.93 85.59 85.99 86.3 72.65 72.69 73.36 73.62 65 70 75 80 85 90 2001 2004 2007 2010 Life expect ancy years Female 80.09 80.21 80.34 80.46 80.58 80.7 80.81 80.93 81.04 81.15 86.8 86.93 87.05 87.18 87.3 87.42 87.53 87.65 87.76 87.87 65 70 75 80 85 90 2013 2014 2015 2016 2017 2018 2019 2020 2021 2022 year Male Female
life expectancy (delay the time when people reach an unhealthy state). In this way we can aim to shorten the unhealthy period. At present, however, there is little evidence to infer how much, and through which prevention measures, lifestyle-related diseases can be decreased, and by how much this will extend healthy life expectancy. Further advances in research are needed.
Therefore, the goal was taken to be “to extend healthy life expectancy more than the increase of life expectancy.” For healthy life expectancy, it is also important to try to extend the “period of time individuals consider themselves as healthy” together with the “period of time spent without limitation in daily activities.” The period of time individuals consider themselves as healthy was compared between 2001 and 2010, and found to rise from 69.55 years to 69.90 years in men, an increase of only 0.35 years, and from 72.94 years to 73.32 years in women, an increase of only 0.37 years. Although these amounts of increase do not reach the targeted amount of exceeding the increase of life expectancy, they are noted because in the next 10 years it will be necessary to be mindful of trying to also achieve a certain level of extension in the period of time individuals consider themselves as healthy together with extension in the period of time spent without limitation in daily activities.
(ii) Reduction of health disparities
Target measure Reduction in gap among prefectures in average period of time spent without limitation in daily activities
Current status Men 2.79 years, women 2.95 years (2010)
Target Reduction in gap among prefectures (2022)
Data source Health and Labour Sciences Research Grants “Study on future predictions of healthy life expectancy and cost-effectiveness of measures to prevent lifestyle-related diseases”
Note: Estimations based on Comprehensive Survey of Living Conditions
In 2010, the places where average period of time spent without limitation in daily activities were longest were Aichi Prefecture for men (71.74 years) and Shizuoka Prefecture for women (75.32 years). The shortest were Aomori Prefecture for men (68.95 years) and Shiga Prefecture for women (71.37 years). These are differences of 2.79 years for men and 2.95 years for women (Figure 4).
Reduction in gap among prefectures was established as a goal. In working to achieve this goal, however, we must assume that the figure for the prefecture with the longest healthy life expectancy is the goal each prefecture is working toward as it makes efforts to extend healthy life expectancy.
Figure 4. Average period of time spent without limitation in daily activities by prefecture (2010)
Difference between the longest and the shortest Difference between the longest and the shortest 2.79 years 2.95 years
(Source: Health and Labour Sciences Research Grants “Study on future predictions of healthy life expectancy and cost-effectiveness of measures to prevent lifestyle-related diseases”)
68.95 69.12 69.14 69.39 69.43 69.63 69.66 69.67 69.85 69.86 69.90 69.91 69.95 69.97 69.99 70.03 70.04 70.22 70.34 70.38 70.40 70.40 70.41 70.45 70.46 70.47 70.58 70.63 70.67 70.67 70.73 70.73 70.78 70.81 70.89 70.90 71.06 71.07 71.10 71.11 71.14 71.17 71.20 71.32 71.62 71.68 71.74 66 68 70 72 AomoriKochi Nagasaki OsakaIwate Ehime OkayamaFukuoka Oita Kagawa TokushimaNigata Hyogo FukushimaTokyo HokkaidoTottori HiroshimaSaga Nara MiyagiKyoto Wakayama ShimaneAkita YamaguchiKumamoto Toyama SaitamaShiga TochigiMie YamagataOkinawa Gifu KanagawaMiyazaki Gumma IshikawaFukui KagoshimaNagano YamanashiIbaragi Chiba ShizuokaAichi Male 72.37 72.49 72.55 72.72 72.73 72.76 72.88 72.93 73.05 73.07 73.09 73.11 73.19 73.19 73.24 73.25 73.34 73.41 73.48 73.50 73.53 73.63 73.64 73.71 73.77 73.78 73.84 73.87 73.89 73.99 74.00 74.09 74.15 74.36 74.36 74.47 74.49 74.51 74.54 74.62 74.62 74.64 74.86 74.86 74.93 75.27 75.32 70 72 74 76 Shiga Hiroshima Osaka Fukuoka TokushimaKagawa TokyoNara NagasakiSaitama HyogoKochi Hokkaido Oita TottoriIwate Aomori WakayamaOkayama Kyoto ChibaMie Saga Yamaguchi Nigata Miyagi KumamotoYamagata EhimeAkita Nagano FukushimaGifu KanagawaToyama YamanashiFukui KagoshimaIshikawa Ibaragi MiyazakiShimane Tochigi OkinawaAichi Gumma Shizuoka Female
<Method of calculating healthy life expectancy>
Method of calculating “average period of time spent without limitation in daily activities” “Average period of time spent without limitation in daily activities” is calculated using the Sullivan method (a method widely used to calculate healthy life expectancy), with information from Comprehensive Survey of Living Conditions and Life Table as basic data. Thus, a response of “No” to the question, “Do health problems currently have some effect on your daily activities?” in Comprehensive Survey of Living Conditions is taken to indicate limitation-free daily activities, and the percentages of people without limitation in daily activities were obtained for each sex and age group. Stationary population and number of survivors were obtained from Life Table. The percentage of people without limitation in daily activities was then multiplied by the stationary population for each sex and age group to obtain the stationary population without limitation in daily activities. Next, the totals for given age groups were divided by the number of survivors to obtain the “average period of time spent without limitation in daily activities.”
In prefectures, Comprehensive Survey of Living Conditions data, prefectural population, and number of deaths are used as basic data. The percentages of people without limitation in daily activities in each prefecture by sex and age group are obtained from the Comprehensive Survey of Living Conditions. Using the life table methodology of Chiang (a widely used method of calculating life tables), the stationary population and number of survivors in the prefecture are obtained. The average period of time spent without limitation in daily activities is obtained using a method similar to the above from the percentage of people without limitation in daily activities, stationary population, and number of survivors.
In municipalities, when surveys are conducted in conformance with the Comprehensive Survey of Living Conditions, the basic data are taken to be the percentages of people without limitation in daily activities by sex and age group according to those surveys, the population of the municipality, and the number of deaths. The “average period of time spent without limitation in daily activities” can be obtained using the same method as for the prefectures. When a survey is not conducted and existing data are used, care information from long-term care insurance, the population, and the number of deaths in the municipality are used as basic data. “Average period of time spent independent in daily activities” (an index like “average period of time spent without limitation in daily activities”) can then be obtained with a method similar to the above. In municipalities with small populations, the addition of a certain handling method needs to be considered in calculating the index (taking the number of deaths in multiple years, using 95% confidence intervals of the index, etc.). In municipalities with very small populations calculation of the index is difficult.
Note: Method of calculating “average period of time individuals consider themselves as healthy”
“Average period of time individuals consider themselves as healthy” is calculated using the Sullivan method with information from Comprehensive Survey of Living Conditions and Life Table as basic data. Responses of “Good,” “Rather good,” or “Ordinary” to the Comprehensive Survey of Living Conditions question of “How is your current state of health?” are taken to indicate that individuals consider themselves as healthy. Using the percentage of these responses, “average period of time individuals consider themselves as healthy” is obtained using the same method as for “average period of time spent without limitation in daily activities.” In prefectures, “average period of time individuals consider themselves as healthy” is obtained with the same method as for “average period of time spent without limitation in daily activities.”
In municipalities, similar to “average period of time spent without limitation in daily activities,” it is possible to obtain the “average period of time individuals consider themselves as healthy” in cases when a survey is conducted by taking the percentage of individuals consider themselves as healthy by sex and age group from the survey, the municipal population, and the number of deaths as basic data. In municipalities with small populations, the addition of a certain handling method needs to be considered in calculating the index. In cases when a survey is not conducted, calculation of the index is difficult. This is because municipalities have no index similar to “average period of time individuals consider themselves as healthy” in municipalities in existing data. Calculation of the index is also difficult for municipalities with very small populations. (Source: Health and Labour Sciences Research Grants “Study on future predictions of healthy life expectancy and cost-effectiveness of measures to prevent lifestyle-related diseases”)
Results of the calculation in 2010
Prefecture
Average period of time spent without limatation in daily activities
Average period of time individuals consider themselves as healthy
Male Female Male Female
Hokkaido 70.03 73.19 69.33 73.08 Aomori 68.95 73.34 68.89 73.46 Iwate 69.43 73.25 68.81 72.40 Miyagi 70.40 73.78 70.80 73.35 Akita 70.46 73.99 69.56 73.07 Yamagata 70.78 73.87 70.81 73.44 Fukushima 69.97 74.09 69.66 73.58 Ibaragi 71.32 74.62 71.09 73.99 Tochigi 70.73 74.86 69.94 74.33 Gumma 71.07 75.27 70.35 74.77 Saitama 70.67 73.07 70.62 72.98 Chiba 71.62 73.53 71.32 73.53 Tokyo 69.99 72.88 69.89 73.08 Kanagawa 70.90 74.36 70.85 74.12 Nigata 69.91 73.77 69.36 73.92 Toyama 70.63 74.36 69.42 73.72 Ishikawa 71.10 74.54 70.12 73.18 Fukui 71.11 74.49 70.23 74.34 Yamanashi 71.20 74.47 70.49 74.77 Nagano 71.17 74.00 70.76 73.56 Gifu 70.89 74.15 70.32 73.29 Shizuoka 71.68 75.32 71.01 74.86 Aichi 71.74 74.93 70.60 73.37 Mie 70.73 73.63 70.21 73.07 Shiga 70.67 72.37 70.10 73.03 Kyoto 70.40 73.50 69.56 73.31 Osaka 69.39 72.55 68.69 72.12 Hyogo 69.95 73.09 68.98 72.72 Nara 70.38 72.93 71.10 74.03 Wakayama 70.41 73.41 70.44 73.76 Tottori 70.04 73.24 69.67 72.67 Shimane 70.45 74.64 69.62 74.23 Okayama 69.66 73.48 69.20 73.73 Hiroshima 70.22 72.49 68.97 72.59 Yamaguchi 70.47 73.71 68.92 72.24 Tokushima 69.90 72.73 69.03 72.45 Kagawa 69.86 72.76 69.27 72.86 Ehime 69.63 73.89 68.70 73.45 Kochi 69.12 73.11 68.64 71.92 Fukuoka 69.67 72.72 68.89 72.14 Saga 70.34 73.64 69.80 73.28 Nagasaki 69.14 73.05 69.19 73.73 Kumamoto 70.58 73.84 69.66 73.76 Oita 69.85 73.19 69.13 72.85 Miyazaki 71.06 74.62 71.55 75.31 Kagoshima 71.14 74.51 70.77 74.70 Okinawa 70.81 74.86 70.46 73.84 All Japan 70.42 73.62 69.90 73.32
(Source: Health and Labour Sciences Research Grants “Study on future predictions of healthy life expectancy and cost-effectiveness of measures to prevent lifestyle-related diseases” http://toukei.umin.jp/kenkoujyumyou/)
iv Measures needed for the future
All of the activities presented in Health Japan 21 (the second term) are things that will contribute to extending healthy life expectancy. Monitoring the shifts in healthy life expectancy is therefore important in terms of managing the progress of this plan. Healthy life expectancy therefore should be calculated, and its trends investigated, each time a large-scale survey is conducted every three years in the Comprehensive Survey of Living Conditions.
While healthy life expectancy in each prefecture is calculated and announced, calculation of the healthy life expectancy in each municipality in the prefectures is desirable for the nation as a whole. Using each type of survey and statistic, it also would be desirable for prefectures to clarify the status of the health disparity in municipalities in their prefecture and make efforts to close those gaps. Doing this, however, requires a high level of statistical knowledge and skill in terms of the calculation procedures used in life tables and the handling of data in municipalities with small populations. Technical support for prefectures (training sessions, disclosure of calculation software, etc.) should be provided.
In approaching the issue of extending healthy life expectancy, the roles of promoting health and preventing disease are extremely important. Various other approaches are also needed, including early detection of disease, prevention of increasing disease severity with proper treatment management, prevention of the need for care, and provision of care services. Systems need to be developed for the seamless, integrated provision of these approaches matched to the health level and risks and health, welfare, and care needs of each person.
In the coming years the health disparity will also need to be monitored from perspectives other than healthy life expectancy. Aggregation of data from the various surveys carried out by the national government (Comprehensive Survey of Living Conditions, National Health and Nutrition Survey, Patient Survey, Survey of Long-term Care Benefit Expenditures) would help to enable comparisons of things such as lifestyle, health status, disease, and use of long-term care insurance in each prefecture, and is encouraged. It is also desirable that results of those comparisons be announced.