ミトコンドリア
D-Loop 領域の塩基配列分析による北大西洋およびミナミマグ
ロ漁場におけるニシネズミザメ集団構造についての検討
Population structure of Porbeagle (Lamna nasus) in the North Atlantic Ocean and SBT
fishery ground as inferred from mitochondrial DNA control region sequences.
日本エヌ・ユー・エス(株) 北村徹 遠洋水産研究所 熱帯性まぐろ資源部 松永浩昌
Toru Kitamura
Japan NUS, Co., LTD.
Hiroaki Matsunaga
National Research Institute of Far Seas Fisheries, FRA, JAPAN
Genetic population structure of porbeagle Lamna nasus in the SBT fishery ground (South Atlantic Ocean and Indian Ocean) and North Atlantic Ocean was investigated using nucleotide sequence of the mitochondrial DNA. We analyzed sequence variation of 293bp of the D-Loop region of 94 sharks, four with North Atlantic, 49 with South Atlantic and 41 with Indian Ocean. Neighbor-joining and UPGMA trees reveal that North Atlantic and SBT fishery ground populations are genetically divided. Porbeagle prefers cold water and does not occur in equatorial seas. These biological data indicate restriction of gene flow between North Atlantic Ocean and SBT fishery ground populations. Concordance between genetic and biological information is taken as robust evidence of population structure, and it is considered that two populations should be managed separately.
Molecular phylogenetic tree suggests that, in SBT fishery ground, there is not any sub-populations of porbeagles which need to be manage separately. Furthermore, no distinct factor to restrict the gene flow supports this suggestion. Genetic studies using additional samples collected from wide area of Atlantic Ocean and research with other techniques (e.g., genetic study with microsatellite marker or satellite tagging survey) are desirable to further understand the migration pattern and population structure of porbeagle in SBT fishery ground.
Finally, haplotype diversity and nucleotide diversity of porbeale in the SBT fishery ground are high, which suggests that there is no trend of decline in the porbeagle stock in the SBT fishery ground.
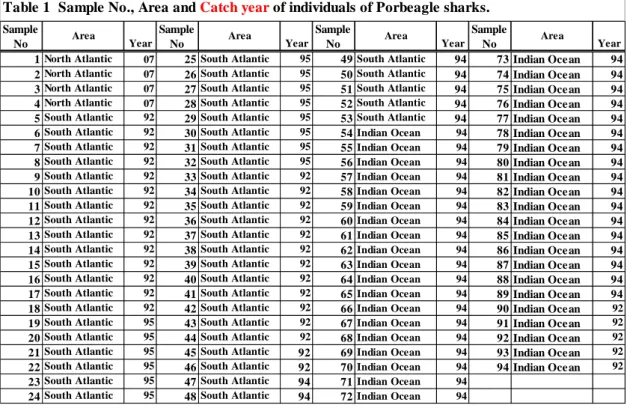
【要約】 ミナミマグロ漁場および北大西洋で漁獲された、94 個体のニシネズミザメから抽出した DNA について、ミトコンドリア D-Loop 部分領域の塩基配列分析を行なった。得られた塩 基配列から分子系統樹を作成した結果、大きく 2 つのグループに識別できる事が明らかと なった。このうちの一つは北大西洋の 4 個体のみで構成されているが、他方のグループに はインド洋と南大西洋の個体が混在していた。従って、北大西洋の個体はインド洋および 南大西洋の個体とは遺伝的に異なることが示唆された。 一方、南大西洋とインド洋の個体は、1 つのグループに混在しており、両海域の個体を識 別する事は出来なかった。両海域間には、遺伝的交流を妨げるような障壁が無い事からも、 本結果は支持されると思われる。また、南大西洋およびインド洋で漁獲された個体につい て、ハプロタイプ多様度およびヌクレオチド多様度を調べた結果、どの海域においても高 い値を示し、個体数が減少している等の兆候は確認されなかった。 【始めに】 ニシネズミザメはネズミザメ目、ネズミザメ科に属するサメ類で、北大西洋および南半 球の亜寒帯海域を分布域とし、マグロはえ縄漁業において混獲されている。本種の産仔数 は1~5 尾で、春~夏にかけて 60~75cm の仔魚が産出される(Compagno 2001)。 本種は、2007 年 6 月にオランダで行われたワシントン条約締約国会議において、ドイツ (EU 代表)により付属書Ⅱへの掲載提案が行なわれたが、多数決の結果本提案は否決され ている。しかしながら、本種の繁殖生態や集団構造など、資源管理を行なうために必要な 知見は乏しく、資源評価を科学的に行なうための情報を蓄積する事が重要である。 一方、近年非常に多くの生物について行われている遺伝学的研究は、資源管理を行う際 に重要となる系群に関する情報や、資源状態を反映すると考えられる遺伝的多様性に関す る知見を報告しており、資源評価を行う際の重要性が増してきている。 そこで本研究では、北大西洋およびミナミマグロ漁場(南大西洋、インド洋)において 漁獲したニシネズミザメについて遺伝学的研究を行い、その集団構造についての検討を行 なった。 【材料と方法】 南大西洋(南緯30°~40 度、経度 0°~東経 11°)にて漁獲した 49 個体、北大西洋で 漁獲した4 個体(北緯 41°付近、西経 55 度付近)および、インド洋(南緯 30°~40 度、 東経99°~145°)で漁獲した 41 個体の合計 94 個体について分析を行なった(表1)。分 析に用いた各個体の筋肉片は、漁獲後に船上にて切り出し、100%エタノール中に浸漬して 常温にて保管した。筋肉片からのTotal DNA の抽出は、QIAGEN 社製 DNeasy Tissue Kit
を用いて行なった。抽出したDNA については、PCR 法により DNA 断片の増幅を行った。 なお、PCR に用いたプライマーは、DDBJ/EMBL/GenBank に登録されている、ホホジロ ザメ(Carcharodon carcharias)D-Loop 領域の塩基配列(Pardini et al. 2001)を参考にして作 成した、Nishinezu-DLL (5' GAC ATG ACC CAC ATA CCT TA) および、Nishinezu-DLH (5' ATC TTG ACG CGA TCA AGG AC)である。また、PCR サイクルについては、98℃-30sec 後、98℃ -10sec、55℃-30 sec、72℃-60sec を 30 回繰り返し、最後に 72℃-2min の伸長反応を行なった。 PCR 増 幅 産 物 は 、 ア ガ ロ ー ス ゲ ル 電 気 泳 動 に て 増 幅 断 片 長 を 確 認 後 、 Amersham Biosciences 社製 GFXTM PCR DNA and Gel Band Purification Kit により精製し、Applied Biosystems 社製 BigDye Terminator v3.1 を用いてシーケンシング反応を行った。反応後 のサンプルについては、Amersham Biosciences 社製 Auto-SeqTMG-50 により精製した後、 ABI PRISM 3100 genetic Analyzer により H 鎖および L 鎖の塩基配列を決定した。 決 定 し た 塩 基 配 列 に つ い て は 、 解 析 ソ フ ト DNASIS Pro V2.2(Hitachi Software Enginnering)を用いてアライメント解析を行い、各個体のハプロタイプを決定した。さら に、MEGA 4(Tamura et al. 2007)を用いて Kimura's two parameter 法(Kimura 1980)に より遺伝距離を計算し、近隣結合法(Saitou and Nei 1987)および UPGMA 法(Sneath and Sokal 1973)により分子系統樹を作成した。また、ハプロタイプ多様度および、塩基多様度につ いては、解析プログラム DNASP version 3.14 (Rozas and Rozas 1999)を用いて計算した。
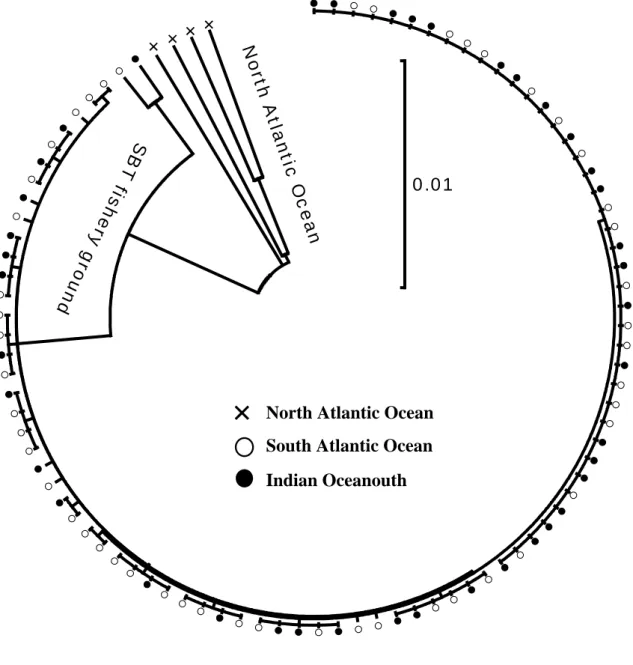
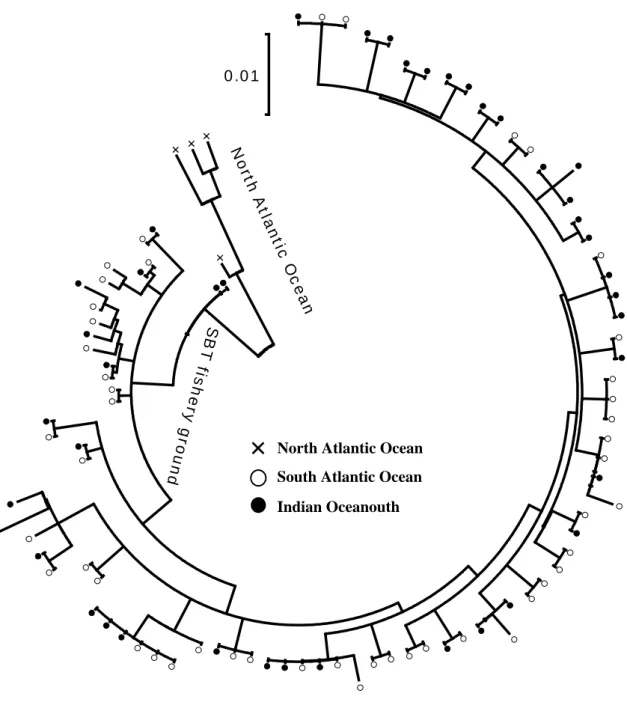
【結果と考察】 94 個体のニシネズミサンプルから抽出した DNA について、新たに設計したプライマー セットを用いてPCR を行ったところ、全てのサンプルについて目的長の増幅産物を得る事 ができた。そこで、得られた増幅産物について、塩基配列分析を行った結果、D-Loop 領域 の5'側部分について 293 塩基対の配列を決定することができた。得られた塩基配列につい て比較検討を行ったところ、25 の部位において塩基置換が検出され、26 種類のハプロタイ プが得られた。なお、欠失/挿入変異は確認されなかった。得られた配列について、近隣結 合法およびUPGMA 法による分子系統樹を作成したところ、大きく 2 つのクラスターに分 かれる樹形となった(図1、2)。このうち、一方のクラスターは北大西洋の 4 個体のみで構 成されているが、もう一方のクラスターにはインド洋と南大西洋の個体が混在しており、 北大西洋の個体は南大西洋およびインド洋の個体とは遺伝的に異なること明らかとなった。 ニシネズミザメの分布域は、地中海・北大西洋からバレンツ海まで広がる北半球の分布 域と、南緯30°~60°の幅で太平洋・大西洋・インド洋に広がる南半球の分布域とに分か れるが、Francis et al. (2008)によると、南半球では海水温 1~23℃付近に分布し、北大西 洋では-1~15℃の海水温域で多くの個体が漁獲されている。一方、赤道海域は水深 10m 付近の水温が25℃以上となるため(Weisberg and Colin 1986)、ニシネズミザメが赤道海域 を越える事は非常に稀であると思われる。従って、南北集団が距離的に非常に離れている 上、両集団を分けるようにして高温の赤道海域が存在する事が、遺伝的交流を制限してい
ると思われる。ニシネズミザメは第14 回のワシントン条約締約国会議において、付属書Ⅱ への掲載が提案されたサメ類である。この提案で指摘されたのは、主に北半球におけるニ シネズミザメ集団の資源状態であったが、本研究において両集団が遺伝的に異なることが 示された事から、南北のニシネズミザメ集団については、別々に資源管理を行っていくべ きであると思われる。 一方、南大西洋とインド洋の集団は、近隣結合法およびUPGMA 法で作成した分岐系統 樹の樹形からは識別する事が出来なかった(図1、2)。ミナミマグロ漁場において漁獲され たニシネズミザメの漁獲海域は南緯30 度以南であり、アフリカ大陸南端の希望岬は、両集 団間の遺伝的交流を妨げるような地理的障壁になるとは考えにくい。さらに、両海域間に は赤道海域のような高温域も存在せず、両集団間では遺伝的交流が行なわれている可能性 が高いと考えられる。以上の事より、インド洋と南大西洋の集団は遺伝的に区別できず、 同一の繁殖集団として資源管理を行うべきであると思われた。 また、ミナミマグロ漁場で漁獲されたニシネズミザメ90 個体については、解析プログラ ムDnaSP を用いて、遺伝的多様性についての検討を行った(表2)。南大西洋、インド洋、 および両海域を一緒にした場合について、ハプロタイプ多様度およびヌクレオチド多様度 を調べた結果、どの海域においても高い値を示した。Grant and Bowen(1998)によると、 生物集団が縮小してボトルネックの影響が出てくると、ハプロタイプ多様度で0.5 以下、ヌ クレオチド多様度で 0.005 以下になると予想される。ハプロタイプ多様度は、南大西洋で 0.816(ハプロタイプ数 11)、インド洋で 0.778(ハプロタイプ数 17)となり、両海域を一 緒にすると 0.814(ハプロタイプ数 26)の値を得ている。また、塩基多様度は、南大西洋 で0.00893、インド洋で 0.00826、両海域を一緒にすると 0.01105 であり、南大西洋および インド洋のニシネズミザメ集団では、個体数減少に伴う遺伝的多様度の減少傾向は確認さ れなかった。 本研究では、大西洋における南北のニシネズミザメ集団は、遺伝的に識別できるとの結 果を得た。しかしながら、分析を行なった北大西洋のニシネズミザメは 4 個体と非常に少 ないため、今後は更に分析数を増やして分析を行い、東西海域による違いなど北大西洋に おけるニシネズミザメの集団構造についても検討を行う必要があると思われる。また、ミ ナミマグロ漁場における集団構造についても、さらに調査海域を拡げて調査を行う事によ って、ニシネズミザメの集団構造に関する新たな知見が得られる可能性があると思われる。 また、マイクロサテライトマーカーを利用した研究や、サテライトタグを用いた行動学的 研究なども、ニシネズミザメの資源管理を行なう上で非常に重要であると思われる。 【結論】 本研究で分析を行った大西洋およびインド洋で漁獲されたニシネズミザメは、北大西洋 海域とミナミマグロ漁場との間で遺伝的に異なることが明らかとなり、両集団については 別々に資源管理を行なう必要があると考えられた。一方、南大西洋およびインド洋で漁獲 4
された個体については、遺伝的に同一である可能性が高く、1 つの集団として資源管理を行 なうべきであると考えられた。また、ミナミマグロ漁場で漁獲されたニシネズミザメにつ いて、ハプロタイプ多様度、およびヌクレオチド多様度を調べた結果、両集団とも高い値 を示し、高い遺伝的多様性が維持されていると考えられた。
【文献】
Compagno, L.J.V. (2001): FAO species catalog, Vol.4: Sharks of the world; Part 2 Bullehad, mackerel and carpet sharks. Food and Agricultural Organization of the United Nations. Rome, Italy. 269pp.
Francis, M. P., L. J. Natanson and S. E. Campana (2008): The biology and ecology of the porbeagle shark, Lamna nasus. p.105-113. In: Sharks of the Open Ocean, Biology, Fisheries and Consevation (eds. M. D. Camhi, E. K. Pikitch and E. A. Babcock). Blackwell Publishing, Oxford UK.
Felsenstein J (1985): Confidence limits on phylogenies: An approach using the bootstrap. Evolution 39:783-791.
Grant, W.S. and B.W. Bowen (1986): Shallow population histories in deep evolutionary lineages of marine fishes: insights from sardines and anchovies and lessons for conservation. Ame. Genet. Ass. 89: 415-426.
Kimura M (1980): A simple method for estimating evolutionary rate of base substitutions through comparative studies of nucleotide sequences. Journal of Molecular Evolution 16:111-120. Pardini, A., C. S. Jones, L. R. Noble, B. Kreiser, H. Malcolm, B. D. Bruce, J. D. Stevens, G. Cliff, M.
C. Scholl, M. Francis, C. A. J. Duffy, A. P. Martin. (2001): Sex-biased dispersal of great white sharks. Nature 412: 139-140.
Rozas, J. and R. Rozas (1999): DnaSP version 3: an integrated program for molecular population genetics and molecular evolution analysis. Bioinformatics 15:174-175.
Saitou N & Nei M (1987): The neighbor-joining method: A new method for reconstructing phylogenetic trees. Molecular Biology and Evolution 4:406-425.
Sneath PHA & Sokal RR (1973): Numerical Taxonomy. Freeman, San Francisco.
Tamura K, Dudley J, Nei M & Kumar S (2007): MEGA4: Molecular Evolutionary Genetics Analysis (MEGA) software version 4.0. Molecular Biology and Evolution 24:1596-1599.
Weisberg R. H. and C. Colin (1986): Equatorial Atlantic Ocean temperature and current variations during 1983 and 1984. Nature 322: 240-243.
Sample No Area Year Sample No Area Year Sample No Area Year Sample No Area Year 1North Atlantic 07 25South Atlantic 95 49South Atlantic 94 73 Indian Oce an 94 2North Atlantic 07 26South Atlantic 95 50South Atlantic 94 74 Indian Oce an 94 3North Atlantic 07 27South Atlantic 95 51South Atlantic 94 75 Indian Oce an 94 4North Atlantic 07 28South Atlantic 95 52South Atlantic 94 76 Indian Oce an 94 5South Atlantic 92 29South Atlantic 95 53South Atlantic 94 77 Indian Oce an 94 6South Atlantic 92 30South Atlantic 95 54Indian Ocean 94 78 Indian Oce an 94 7South Atlantic 92 31South Atlantic 95 55Indian Ocean 94 79 Indian Oce an 94 8South Atlantic 92 32South Atlantic 95 56Indian Ocean 94 80 Indian Oce an 94 9South Atlantic 92 33South Atlantic 92 57Indian Ocean 94 81 Indian Oce an 94 10South Atlantic 92 34South Atlantic 92 58Indian Ocean 94 82 Indian Oce an 94 11South Atlantic 92 35South Atlantic 92 59Indian Ocean 94 83 Indian Oce an 94 12South Atlantic 92 36South Atlantic 92 60Indian Ocean 94 84 Indian Oce an 94 13South Atlantic 92 37South Atlantic 92 61Indian Ocean 94 85 Indian Oce an 94 14South Atlantic 92 38South Atlantic 92 62Indian Ocean 94 86 Indian Oce an 94 15South Atlantic 92 39South Atlantic 92 63Indian Ocean 94 87 Indian Oce an 94 16South Atlantic 92 40South Atlantic 92 64Indian Ocean 94 88 Indian Oce an 94 17South Atlantic 92 41South Atlantic 92 65Indian Ocean 94 89 Indian Oce an 94 18South Atlantic 92 42South Atlantic 92 66Indian Ocean 94 90 Indian Oce an 92 19South Atlantic 95 43South Atlantic 92 67Indian Ocean 94 91 Indian Oce an 92 20South Atlantic 95 44South Atlantic 92 68Indian Ocean 94 92 Indian Oce an 92 21South Atlantic 95 45South Atlantic 92 69Indian Ocean 94 93 Indian Oce an 92 22South Atlantic 95 46South Atlantic 92 70Indian Ocean 94 94 Indian Oce an 92 23South Atlantic 95 47South Atlantic 94 71Indian Ocean 94
24South Atlantic 95 48South Atlantic 94 72Indian Ocean 94 Table 1 Sample No., Area and Catch year of individuals of Porbeagle sharks.
Area
Number of
samples
Number of
haplotypes
Haplotype
diversity
Nucleotide
Diversity
South Atlantic 49 17 0.816 0.00893 Indian Ocean 41 11 0.778 0.00826 South Atlantic Ocean + 90 22 0.797 0.0086Table 2 DNA Polymorphism of Porbeagle shark in eace a
0.01
N
or
th
A
tla
nt
ic
O
ce
an
SB
T f
is
he
ry
g
ro
un
d
South Atlantic Ocean
Indian Oceanouth
North Atlantic Ocean
×
× × × ×
Figure 1. UPGMA tree of 94 Porbeagles in the SBT fishery ground and North Atlantic Ocean.
The bootstrap consensus tree inferred from 1000 replicates is taken to represent the evolutionary history of the taxa analyzed. Branches corresponding to partitions reproduced in less than 70% bootstrap replicates are collapsed. The tree is drawn to scale, with branch lengths in the same units as those of the evolutionary distances used to infer the phylogenetic tree.
8
South Atlantic Ocean Indian Oceanouth North Atlantic Ocean N or th A tlan tic O cean S B T fis he ry g ro un d 0.01 × × × ×
×
Figure 2. Neighbor-Joining tree of 94 Porbeagles in the SBT fishery ground and North Atlantic Ocean.
The bootstrap consensus tree inferred from 1000 replicates is taken to represent the evolutionary history of the taxa analyzed. Branches corresponding to partitions reproduced in less than 70% bootstrap replicates are collapsed. The tree is drawn to scale, with branch lengths in the same units as those of the evolutionary distances used to infer the phylogenetic tree.