JQrigil1al I
Tritium Concentration of Groundwater in the Districts of Osaka, Japan
Taeko
KOGA,Hiroshige
MORISHIMA,Takeo
NIWA,Hiroshi
KAWAIand Tadao
MATSUNAMI*(Received October 30, 1991)
ABSTRACT
The tritium concentration of groundwater collected from deep wells in the southern cities of Osaka prefecture (Sakai and seven other cities) and those in the northern cities thereof (Takatsuki and five other cities) were measured.
As a result, the groundwater veins of the southern cities can be classified into two groups, 1.5"""'5 Bqj£ and 0.1"""'1 Bqj£. Those of the northern cities may also be classified in the 1.4 ...
2.6Bqj£ and 0.1 ... 0.8 Bqj£ ranges.
The tritium levels of these groundwater veins are considered to be nearly constant, except for their physical half life (12.4 years), since in these ten years the level of tritium precipi- tation is almost constant, with groundwater pumping being controlled by the Osaka prefecture authority.
KEY WORDS
groundwater, tritium concentration, Osaka districts, well INTRODUCTION
The tritium concentration of groundwater in the Osaka districts was first measured by Ochiai et al. in 1969 (Table 1)1). According to his report the concentration of ground- wa ter was 0 ... 16 TU (2.0 Bq/ £) excep t for that being pumped up at a well of the Sapporo Beer Company which measured 58 TU (6.86 Bq/£). During that period the tritium con- centration of rainwater was gradually decreasing from the high level due to the nuclear explosion experiments done in the Pacific Ocean with repeated seasonal variation and at that time pumping of groundwater was not yet controlled by the authority. Therefore, some variation in tritium concentration of groundwater was considered because of the infiltration of tritiated rainwater into the groundwater and groundwater flow due to a large amount of groundwater being pumped without control.
*
Research Institute for Advanced Science and Technology, University of Osaka (Shinkecho, Sakai City, Osaka 593, Japan)Table 1 Tritium Concentration of the Groundwater in Osaka, Japan.1>
No. Sample Location Depth of Pumping Date of
well (m) depth(m) collection TU*
63 Kobunshi-kagaku No.3 well Neyagawa city Ninnaji 75 45 - 60 1967.11.30 7.3 64 Kobunshi-kagaku No.3 well. Neyagawa city Ninnaji 75 45 - 60 1968.11.25 4.0 65 Kobunshi-kagaku No.5 well Neyagawa city Ninnaji 60 25 - 49 1969.11.27 16.5 66 Kobunshi-kagaku No.4 well Neyagawa city Ninnaji 60 25 - 49 1969.11.27 6.4 67 Kobunshi-kagaku new No.1 well Neyagawa city Ninnaji 220 182 -215 1967.11.30 0.3 68 Kobunshi-kagaku new No.1 well Neyagawa city Ninnaji 220 182 -215 1968.11.25 0.0 69 Kobunshi-kagaku new No.1 well Neyagawa city Ninnaji 220 182 -215 1969.11.27 0.0 70 Shinden-seiso-kojo No.2 well Kadoma city 200 82 -195 1967.12. 5 1.7 71 Shinden-seiso-kojo No.2 well Kadoma city 200 82 -195 1968.11.25 7.4 72 Shinden-seiso-kojo No.2 well Kadoma city 200 82 -195 1969.11.27 16.8 73 Daito-suido No.5 well Daito city Haizuka 182 60 -162 1969. 2. 7 10.7 74 Daito-suid6 No.5 well Daito city Haizuka 182 60 -162 1969.12. 8 6.7 75 Daito-suido No.7 well Daito city Haizuka 240 81 -230 1969. 2. 7 5.1 76 Daito-suido No.7 well Daito city Haizuka 240 81 -230 1969.12. 8 2.3 77 Daito-suido No.4 well Daito city Haizuka 300 178 -290 1969. 2. 7 8.0 78 Konoike-jibanchinka-kansoku Daito city Konoike 51 45 - 50 1967.12.22 12.7 79 Konoike-jibanchinka-kansoku Daito city Konoike 100 92 - 97 1968. 1.22 3.9 80 Konoike-jibanchinka-kansoku Daito city Konoike 200 170 -190 1967.12. 5 1.9 81 Niwakubo-jibanchinka-kansoku Moriguchi city 50 31.5- 45 1968. 3.11 7.3 82 Niwakubo-jibanchinka-kansoku Moriguchi city 101 56 - 64 1968. 3.15 2.7
76 - 82 98 -101
83 Niwakubo-jibanchinka-kansoku Moriguchi city 250 208 -215.5 1968. 3.30 1.2 234.5-238.5
84 Sapporo beer co. No.1 well Ibaraki city 150 45 - 50 1969. 3.13 58.1 70 - 90
108 -150
85 Sapporo beer co. No.7 well Ibaraki city 300 190 ""270 1968. 3.13 3.8 86 Higashi-osaka-suido No.13 well Higashi-Osaka city 300 161 -290 1969.11.13 7.5 87 Higashi-osaka-suido No.10 well Higashi-Osaka city 200 60 -198 1969.11.20 9.2 88 Izumiotsu-shiken well Izumiotsu city 400 282 -288 1968.11.15 13.4 89 Kishiwada-shiken well Kishiwada city 300 261 -273 1968.11.15 14.2
* 1 TU=0.118Bq/ p,
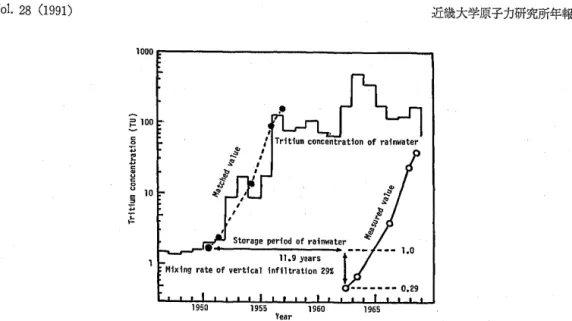
For instance, the increasing pattern of tritium concentration of rainwater around 1950 was the same pattern as that of groundwater at Komagome, Tokyo (65 m deep) (Fig. 1)2) measured by TakahashP>. From these results it was concluded that the storage period of rainwater was 11.9 years and the rate of vertical infiltration was 29%. Similar results were reported by Kimura4) for wells at Nagaoka and others.
However, for these ten years the tritium level in rainwater has been almost constant and variation in the tritium concentration of groundwater is estimated to be minor.
The tritium concentration of the groundwaters collected at the southern district of Osaka (Sakai city, Izumiotsu city, Matsubara city, Mihara-cho, Sayama city, Kashihara city, Taishi-cho and Tondabayashi city) and the northern district of Osaka (Takatsuki city, Ibaraki city, Mino city, Suita city, Settsu city and Katano city) was then measured. The depth of these wells are slightly more than 100 meters deep. The locations of the wells are shown in Fig. 2.
1000~---______________ ~
~ 100 c o ...
t
Year
Fig. 1 An Example of Analysis with "the fallen time matching" Method.
o
t
Osaka Bay
Nat U6 ' .... sUba Nl.2 ~!t\~J.
• Sa kil i city ('-'/,
w'"\.
, ;.>~'-"
\ ,,,9'....) (,' i
.. ~. • ~QI,. .,Ta shi-
"', C')~~)o \ (",0 _ .. c.... , ·~ho W10
, ;to ("~ • I '-. ...,.
~ \ Wf" Tondabayashi
\.. W5 _'\ " ,~ " , J..ci '~ll ty • I
' / ' \ ~' ", ! ( ; ' . i
._1' ...
~
' ...
\,
50 km
Fig. 2 The Locations of the Wells.
METHODS
The measurement of the tritium concentration of groundwater was made with low- background liquid scintillation counters developed by the ALOKA company and the Pack- ard company. Samples with an extremely low tritium concentration were enriched byele- ctrolysis prior to tritium measurement.
RESULTS AND DISCUSSIONS
Southern cities: The tritium concentration of the groundwater collected at the well (W-l, 145 m deep) of the Osaka Prefectural Radiation Research Institute in south Osaka, which has been investigated during these four years showed a maximum mean value of 3.59 Bq/£ from those of other southern cities (Fig. 3). The value does not significantly
Bq/~1 ________________________ ~ ________________________________________ ~
141 .W18
• W19
° 3 5 7 9 1 1 1 3 5 7 9 1 1 13
1984 1985
Fig. 3 Tritium Concentration of the Groundwater in Osaka Area.
change. The mean value of the well W-2 (7m deep) which is located near W-1 is 2.18
Bq/.e.
Other wells measured 0.1---1. 0Bq/.e.
Therefore, the groundwater veins of south Osaka can be classified into at least two groups according to tritium level.Northern cities: The tritium concentrations of the groundwater collected at the well (W-18, W-19) of Takatsuki city are 2.58Bq/£ and 1.41 Bq/£, respectively. Others mea-
Table 2 Tritium Concentration of the Groundwater in Osaka, Japan.
Depth of Pumping Date of Tritium Con-
No. Location centration
well (m) depth (m) collection (Bq/ I.)
W- 1 Sakai city, Shinke-cho 145 35 1986. 4- 3.59 ±0.37
1987. 2
W- 2 Sakai city, Mozuumemachi 7 7 1986. 1- 2.18 ±0.30
1987. 2
W-3 Sakai city, Asakayama 1 250 56 1986. 6.20 0.48 ±0.26 W-4 Sakai city, Asakayama 2 250 42 1986. 6.20 0.37 ±0.26
W-5 Izumiotsu city, Sone 124 20 1986.12. 3 1.00 ±0.11
W- 6 Matsubara city, Aocho 250 79 1987. 3.26 0.074±0.11
W- 7 Mihara-cho, Kohirao 200 60 1987. 3.26 0.41 ±0.11
W-8 Sakai city, Minaminoda 200 65 1986.12.10 0.37 ±0.11
W- 9 Kashihara city, Tamate 146 50 1987. 3.26 1.48 ±0.07
W-10 Taishi-cho, Taishi 100 15 1987. 3.26 0.74 ±0.07
W-11 Tondabayashi city, Koda 206 41 1987. 3.26 1.26 ±0.07
W-12 Suita city, Katayama 1 170 1989. 9.12 0.83 ±0.13
W-13 Suita city, Katayama 13 300 1989. 9.12 0.56 ±0.18
W-14 Settsu city, Showaen 1 150 1989. 9.12 0.48 ±0.26
W-15 Settsu city, Showaen 5 250 1989. 9.12 0.35 ±0.14
W-16 Katano city, Kisaichi 8 240 1989. 9.12 0.46 ±0.12
W-17 Katano city, Kisaichi 10 240 1989. 9.12 0.50 ±0.24
W-18 Takatsuki city, Okammuri 1 172 1989. 4.10 2.58 ±0.15 W-19 Takatsuki city, Okammuri 8 71 1989. 4.10 1.41 ±0.17
W-20 Ibaraki city, Tokaichi 1 200 1989. 4.10 0.10 ±0.11
W-21 Ibaraki city, Tokaichi 5 145 1989. 4.10 0.11 ±0.09
W-22 Mino city, Hanjo 1, 2 205 56 1989. 4.10 0.62 ±0.10 W-23 Mino city, Sakuragaoka 3 174 86 1989. 4.10 0.16 ±0.11 sured below 1 Bq/.e. The groundwater veins of north Osaka can also be divided into two groups (Table 2).
We have measured no data for long periods except for W-l. However, the facts that the level of the tritium precipitation is almost constant in these ten years and pumping of groundwater being controlled by Osaka prefecture authority would suggest the reason for the slight variation in groundwater tritium.
ACKNOWLEDGEMENT
We thank Ms. Katsuko Nunoura, Director of the Institute of Public Health Osaka Pre- fectural and Mr. Akira Taguchi, the chief clerk of the water-works department of Taka- tsuki city and those of other cities for giving us groundwater samples and for their help- ful discussions.
REFERENCES
1) T. Ochiai and H. Kawasaki: Tritium in Groundwater in Japan; Yousui and Haisui, 14, 11, p.7 (1972) (In Japanese).
2) Groundwater Handbook, Chap. 7, p. 326, Tokyo Kensetsu Sangyo Chosakai (1974) (In Japanese).
3) T Takahashi: Tritium Concentration in Wine, Rain and Ground Water; Radioisotopes, 18, (12),
32--35 (1972).
4) S. Kimura: Study of Groundwater Flow by Tritium Concentration in Water (ll); p.27--30, The Bulletin of the National Research Institute of Agricultural Engineering, Ministry of Agriculture and Forestry (Japan), No. 10, March (1972) (In Japanese).