FATIGUE STRENGTH AND RESIDUAL
STRESS IN CARBON STEEL.
(Rotary bending fatigue test)
By
Koichi MITsuNAGA & Atsusi FuKuTAKE.
Received November 1 1972)
INTRODUCTION.
Many investigators have discussed the effect of residual stress as a contributive factor to fatigue strength from various standpoints. It has been reported the compressive residual stress at the surface is usefull for the improvement of fatigue strength and that the tensile residual stress is harmful.i'2'3' In order to produce the residual stress at the surface layer of specimens, various surface treatments, such as mechanical, chemical and heat treatments, etc., have been adopted. Whe- never the residual stress is generated by the surface treatment, it is not possible to avoid the work-hardening and structural changes at the surface layer.`)5)6) It has been pointed out that the contributive factors to fatigue strength are as
followsc7)
(a) residual stress (b) structural changes, (c) work-hardening and others.
Residual stress has been thought of as equivalent to the mean stress.2'8) Ho- wever, it is shown by recent investigations that these factors themselves vary in the fatigue process.9' Some investigators have reported the variation of resi- dual stress of carbon steels in the high cycle region.iO' One of the authors has reported the variation of residual stress due to stress cycling in cast iron.ii) Accordingly, it is unsuitable to discuss the effect of residual stress on the fatigue strength based on the initial residual stress. Hence, the following investigations were conducted and are reported in this paper:
(a) The variations of residual stresses at the surface during fatigue process.
(b) The rough separation of the factors which contribute to fatigue strength into the residual stress and hardening properties at the surface layer.
In the present experiment, the rotary bending fatigue test was carried out.
It was shown that the contribution of residual stress to fatigue strength is com- parable to that of the hardening properties at the surface layer.
1. MATERIAL, SPECIMEN and TESTING MACHINE.
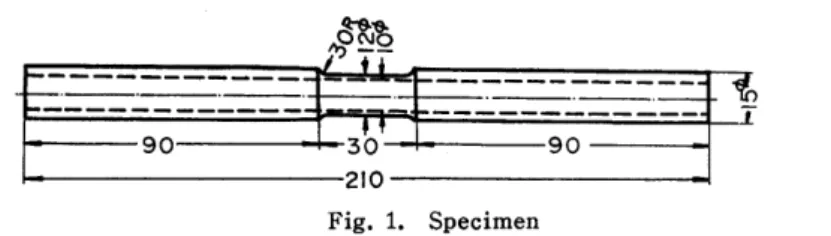
The material used was S45C carbon steel bars of 22Åë Å~5m. The material was normalized at 8500C for 30 minutes and the specimens as shown in Fig. 1
.otsN-e
210
Fig. 1. Specimen
were machined. The conditions of machining were as follows: cutting speedwas 2m per minute, feed was O.05mm per cycle and depth of cut was O.03mm. In the experiment, three kinds of specimens with different surface treatments were used.
(a) "Not annealed" specimens, which were polished with O/6 emery paper after machining, (NAS).
(b) Shot-peened specimens which were shot-peened after (a)-treatment, (SPS).
(c) Annealed specimens, which were annealed in vacuum at 6500C for 30 minutes after (a)-treatment and then a few microns of the surface layer were electropol- ished, (AN).
The mechanical properties and chemical composition of the annealed specimens are listed in Table 1, and the micro-structure of annealed, "not annealed" and shot- peened specimens are shown in PHOTO. 1, a, b, and c respectively.
Table 1. Mechanical properties and chemical composition.
Mechanical properties Yield point os
Tensile strength aB Elongation N6"
Reduction q
Real fracture strength aT
kg/mm2
38. 7
kg/mm2
62. 6 24. 0%
44. 2%
kg/mm2
90. 3
Chemical composition c
si
Mn
P s
O. 44 % O. 38 % O. 76 %
O. O21Si6
O. 022%
From PHOTO. 1, it is seen that the grain size of not annealed and shot-peened specimens is similar, but in annealed specimens the growth of grains is considerab- ly noticeable because of the heating at temperatures above recrystallization, and furnace cooling.
The machine used for fatigue test was the rotary bending fatigue test ma- chine of uniform bending. The capacity of the machine was 5 kg-m and the test- ing speed was about 3000 rpm. Micro-Vickers hardness was measured at loo g for 3o seconds. The hardnesses represent the average of the hardness of ferrite and pearlite, because the width of impression extends over ferrite and pearlite in an- nealed specimens which have larger crystals as shown in PHOTO. 2.
The residual stresses in the axial direction on the surface layer were measu- red by X-ray diffraction method: one ef the non-destructive inspections.i2)
(a) 20pt (b) 20pt (c) 20pt
PHOTO. 1. .Micro-structure of specimen:
(a) annealed specimen, (b) not annealed specimen, (c) shot-peened specimen.
PHOTO. 2. The trace of indenter of hardness.
The condditions of X-ray measurement are shown in Table 2. In order to
Table 2• . X-ray measuring conditions (Parallel
beam method)
characteristic x-ray l cr-K.
Diffraction plane i (211)
i
Tube voltage i 30 Kv
:
Tube current / 9mA
Projection area 4Å~4 mm 2e scan speed 10"/min Chart speed i 20mm/min
Time constant 4
Peak determination / Half value breath method :
Filter [ Vanadium
(67)
check the accuracy of the stress measurement by the X-ray method, the follow- ing test was performed. The not annealed plate specimen of S45C, shown in Fig.
2, was used. The strain gauge was attached at ,•point A (Fig. 2) and the stresses at point B were measured by X-ray and simultaneously at point A by the strain meter under bending. Fig. 3 shows the results of the measurement. The ordinate shows the differences between ox (the stresses by X-ray) and axo (the initial stress by X-ray), that is, it represents the relative changes of stresses at the
surface, under loading. The abscissa shows the mechanical stresses oM measured by the strain meter. Since the relation of (ax-axo)==oM is obtained, it is seen that
the relative changes of stresses by X-ray are satisfactorily accurate. It is also
n
I06
40
B
-o
ROn
Nl,i " lk-" rt)
ll 11
H II
ll II ll 11 ll ll
6.Fg-=--=:::=::e.Fg
Fig. 2. Plate specimen of bending test.
50
20
tsE
E
xv
x6
bx,10
e '
aM (kglmmb
Fig. 3. Relation between stress measured by X-ray and nominal stress.
possible to know the absolute changes of stresses by X-ray.
2. EXPERIMENTAL RESUI.,TS.
2-1. Distribution of Hardness and Residual Stress at the Surface Layer.
The axial residual stress was measured after successive electropolishings of the surface layer. The results are shown in Fig. 4 (not annealed specimen) and Fig. 5(shot-peened specimen). As shown in Fig. 4, the hardness on the initia!
surface of not annealed specimen is Hv==200N240. The hardness decreases gradual- ly to the extent of 40pt depth, and it becomes constant: Hv== 180, when the sur- face layer of 40pt is removed. Assuming that the hardness rises in the zone affected by work-hardening, Fig. 4 shows that the affected zone is about 40 pt depth.
Now, the residual stress at the initial surface is about -37kg/mm2, and after successive electropolishings to about 20pt depth, the residual stress decreases to about -5kg/mm2 which alrppst corresponds to the. annealed specimen. It was ob- served that the compressive residual stress is distributed to a very narrow region from the surface.
260
i80
E
"
([}):5 co
o
-10
-20 -30
'
-40
500 10oo l500
Depth trom surtace: p
5oo 1ooO t500
Fig. 4. Distribution of hardness and residual stress of the not annealed specimen.
Fig. 5 shows the distributions of hardness and the axial residual stress of the shot-peened specimen. The roughness of the surface due to shot-peening made it
l
300 260 220 180 140
100
... SO"'Q%Åq?6","!'iT' MT""ii/l2,/23iO[i'i.i23i:,i'2391'Ni5oO-)i7.st.g...
e OOoo
ee
0 :Mea;uring Part i,
o
ellE
E
.O-20 b"
-4O
o seo looo lsoo 2ooo 2soo 3ooo
Depth from suttace :p
o soe looo lsoo 2ooo 2soo 3ooo
Fig. 5. Distributoin of hardness and residual stress of the shot-peened specimen.
impossible to measure the hardness on the surface, so the hardness was measured on the crss-section which was electropolished in order to remove the zone aff- ected by machining and grinding. The hardness on the surface was about Hv#
280, but it decreases gradually to the extent of 450pt and becomes constant:Hv l=180. From this hardness distribution, the zone affected by shot-peening is con- sidered to be 45oth-500 pt depth. The locations of hardness measuring on part 1 and part 2 are shown in Fig. 5. In considering the distribution of residual stress, the maximum compressive residual stress is found to exist at 40nv50 pt depth from the surface. The depth of the work-hardened layer of the shot-peened specimen is about ten times its depth in the not annealed specimen, although the hardness of these matrixes are almost the same.
Now, the distributions of these axial residual stresses are very different from one another. And the depth of surface layer where the compressive residual stress exists in the shot-peened specimen is larger than the depth in the not an- nealed specimen. In corelating these difference with the micro-structures, PHOTO.
3 is used. It is evident from PHOTO. 3 that the annealed specimen has not un- dergone any structural change but the not annealed specimen has narrow plastic
(70)
2J"; kg 20 sta
i
PHOTO. :3. Micro-structure in surface layer of specimen:
('a) not annealed specimen, (b) shot-peened specimen.
fiow near the boundary and the crystals within the depth of 40 pt from the surface inclined in the same direction. The shot-peened specimen also has much plastic flow. Crystals within 50Lt depth from the surface as well as the profile of the boundary are curved. The depth of 50xt from the surface of shot-peened speci- mens were electropolished, in order to get the maximum compressive residual stress on the surface.
2-2. S-N Curves of Solid Specimens.
Fig. 6 shows the S-N curves of three kinds of solid specimens: annealed, not annealed and shot-peened specimens. These specimens have both residual stress and a hard region in the surface layer, except the annealed specimen, From
ct
E o
co
36 sc 32 50 28 26 24 an
.
e
io4 105 106 I07
N
Fig. 6. S-N curves of solid specimens.
Fig. 6, it is seen that the fatigue limit is 23.0kg/mm2 for the annealed specimen,
27.0kg/mm2 for the not annealed specimen and 27.5kg/mm2 for the shot-peened specimen. The rate of increase of the fatigue limit in comparison with the fa-
tigue limit of the annealed specimen is about 17.4 9o for the not annealed specimen and about 19.6 % for the shotpeened specimen. It is interesting that although the shot-peened specimenhas a deeper hardened layer, the fatigue limit is approximate- ly the same as that of the not annealed specimen.
2-3. Release of Axial Residual Stresses by drilling the Specimens.
The residual stresses of the three kinds of solid specimens were measured.
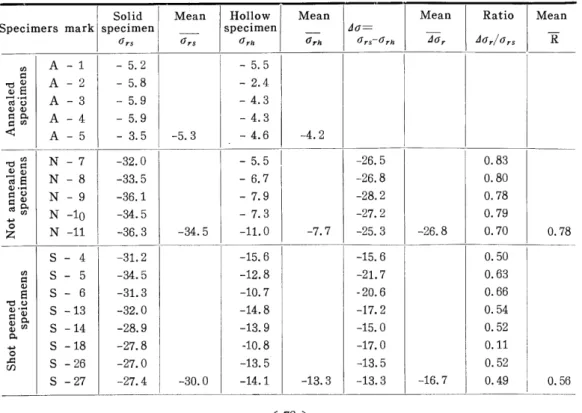
The solid specimens were drilled to a tubular form (hollow specimens) which are shown with dotted lines in Fig. 1. In the hollow specimens, the cutting speed was as slow as possible and the feed was so small that the temperature rise dur- ing drilling was very small. The residual streses of the hollow specimens were also measured. Table 3 represents the results of the measurement. A residual stress of about -5kg/mm2 exists in solid annealed specimens. By means of drilling, an average residual stress of about -4.2kg/mm2 was obtained. Considering the ex- Perimental error, however, it cannot be said that the residuallstresses change due t`o drilling in annealed specimens. However, if we regard tht. state of the an-
nealed specimen as the standard, the not annealed specimen became almost the
Table 3. Relaxation of residual stress due to the drilling of the specimens
Specimers mark
:
BeTed'8•
:9
•ct
enE.s s.E
:8es x
-'O"
z g
vEo
ge'g oa co
sv.
en
A-1A-2 A-3A-4 A-5 N-7N-8 N-9N -lo N -11
S-4S-5 S-6S -13 S -14 S -18 S -26 S -27
Solid speclmen Ors
- 5.2 - 5.8 - 5,9 - 5.9 - 3.5 -32.0 -33.5 -36.1 -34.5 -36. 3 { -31,2 -34. 5 -31.3 -32.0 -28.9 -27. 8 -27. 0 -27. 4
Mean
Ors
-5. 3
-34. 5
-30. 0
Hollow speclmen Orh
- 5.5 - 2.4 - 4.3 - 4.3 - 4.6
Mean
arh
-4. 2 - s.s 1 - 6.7 - 7.9 -- 7.3 -11.0 -15. 6 -12.8 -10. 7 -14.8 -13.9
-10. 8 -13. 5 -14.1
-7. 7
-13. 3
da= Ors-arh
-26. 5 -26, 8 -28. 2 -27. 2 -25. 3 -15. 6 -21. 7 -20. 6 -17. 2 -15. 0 -17. 0 -13. 5 -13. 3
Mean
dar
-26. 8
-16. 7
Ratio dar/Ors
O. 83 O. 80 O. 78 O. 79 O. 70
Mean R
O, 78 O. 50
O. 63 O. 66 O. 54 O. 52
O.11
O. 52
o. 49 l O. 56
standard state, as regards the residual stress by mean of drilling. But in the shot-peened specimen, a fair stress remained after drilling: about -13.0kg/mm2 on the average.
2-4. S-N Curves of Hollow Specimens.
Fig. 7 shows the S-N curves of the three kinds of hollow specimens which have essentially no residual stress except the shot-peened specimens. The shot- peened specimens still have a fair residual stress, therefore it may be considered that the residual stress contributes more or less to the fatigue strength. From Fig. 7, it is seen that the fatigue limits of the three kinds of hollow specimens
are 19.0 kg/mm2 for the annealed specimen, 22.0 kg/mm2 for the not annealed spe- cimen and 23.5 kg/mm2 for the shot-peened specimen. T-hus, the fatigue limits of all three kinds of specimens have decreased in comparison with that of the solid specimens.
AS.P.S nN.A,S OA.S 34
NAg3o)ee28co2624222052
-).
A.-.-
o-.
-
to4 }o5 io6 to7
N
Fig. 7. S-N curves of hollow specimens.
2-5. Variations of Residual Stresses due to Stress Cycilng (Solid specimens).
When we assume that the residual stress (one of the factors which contribute to fatigue strength) is equivalent to the mean stress, it is important to know the variations of residual stress in the fatigue process. By investigating of variation of residual stress due to stress cycling, it will be seen whether the supposition of the initial residual stress as equivalent to the mean stress for estimating the fatigue strength is suitable or not. The selected amplitudes of cyclic stress are above, near and below the fatigue limit.
Whenever the measurement of residual stress was carried out, the specimen was removed from the fatigue test machine and the stress at the same point on the surface was measured. The results are shown in Fig. 8, Fig. 9 and Fig. 10.
a, represents the residual stresses measured during cycling and a.i the initial residual stresses. An ordinate represents the ratio (a./a.i).
(73)
o
e-O•5 bLID
År
6v.9
6
cr
lo4 lcP N Io6 lo7
Fig, 8. Variation of residual stress due to stress cycling on annealed specimens.
Fig. 8 shows the variations of residual stresses of annealed specimens. It can be observed from Fig. 8 that independent of the stress amplitude the compressive residual stresses almost do not change with stress cycles, but it slightly decreases in the fatigue process. The variation of residual stress of annealed specimens in low cycle'srange has been investigated by Taira.'3' He reported that the com- pressive residul stress was generated in the early stage of the stress cycles and then decreased gradually with the increase of the stress cycles. Kawata reported that the residual stresses of S45C annealed specimens changed only within the range of error in measurement.ie)
Fig. 9 represents the variations of residual stresses of the not annealed speci- mens. The compressive residual stress decreases generally with stress cycles, but this aspect of the variation in the fatigue process varies with the stress amplitude. The higher the stress amplitude is, the greater the speed and the de- crease of compressive residual stress. When the stress amplitude is in the fatigue limit, the compressive residual stress decreases to a half of the initial value within a comparatively early stage (about 105 cycles) of the fatigue process.
o
N
io4 to5 to6 io7
O.2 O.4
ttQ6
6"o.s
le..i,o
e
ll x
.
' I
-
.
'
' '
. .
O 3t.O kg/mrf
e2eo ;
A27.o s
m
N Fig. 9. Variation of residual stress due to stress cycling on not annealed specimens.
Kawata reported the same results as the authors and also reported that when the stress amplitude was above the fatigue limt, the residual stress of the machi- ned specimens decreased rapidly in the early stages of the stress cycles. He also
(74)
reported that the compressive residual stress decreased to about 20 % of the initial value during the fatigue process, even when the stress amplitude was below the fatigue limit. On the other hand, there is another investigation which shows that the compressive residual stress increased slightly in the early stages of stress cycles and then decreased rapidly with the increase of the stress cycles.'O) Fig. 10 represents the variations of residual stresses of the shot-peened spe- cimens due to stress cycling. When the stress amplitude is hgiher than the fa- tigue limit, the compressive residual stress decreases rapidly in the early stages of stress cycling. When the stress amplitude is in the fatigue limit, however, it decreases to 70 9o of the initial value. It is interesting that the reduction of compressive residual sress of the shtot-peened specimen smaller than that of the not annealed specimen.
N
6
g
"o--
lo4lo5to6to7
l
/ X
Z " . -- "
--
l.O
.
.
'x).•-o--• . .
O20.0kc/mm2
A27.0sco
e2ass
A35.os N
Fig. 10. Variation of residual stress due to stress cycling on shot-peened specimens.
2-6. Variations of Residual Stresses due to Stress Cyc!ing (Hollow specimens).
Fig. 11 represents the variations of residual stresses of the shot-peened hol-
low specimens which have more or less the compressive residual stress. When the stress amplitude is higher than the fatigue limit, the compressive residual stress decreases very rapidly, and when the stress amplitude is in the fatigue limit, it changes little during the fatigue process.
N O.2
eeO•4
60.6
ÅrO.8 .9 org
Fig. 11. Variation of residual stress due to stress cycling on shot-peened hollow specimens.
(75)
3. DISCUSSION 3-1. S-N Curve.
In spite of the existence of the larger work-hardened layer in the shot-peened solid specimens, the fatigue strength of these is higher by only O.5 kg/mm2, than that of the not annealed specimens.
The following may be regarded as the reasons for this small increase: The shot-peened specimen was electropolished to the surface layer of about 50 pt depth.
This seems to have a considerable effect on the fatigue strength and the roughness of the surface acts likeanotch. The compressive residual stress and the re- markably hardened surface seems to be useful for fatigue strength, but the ro- ughness of the surface reduces the fatigue strength, acting like a notch. With regard to this, Takeuchi proved experimentally that the fatigue limit decreased after the anneling which removed residual stress and recovered the strutcure from plastic flows.'5' Another investigator has described that the concavities of the surface formed by shot peening, act as the geometrical factor of stress con-
Centration.i6)
Now, it is interesting that the fatigue limit of hollow annealed specimens is smaller by 3.5 kg/mm2 than that of the solid annealed specimens, in spite of the same structural states. As reasons for this it may be considered, that a) the aspect of yielding on the surface of solid specimen which are restrained inside is diffe- rent from that of hollow specimens which are unrestrained inside and b) occasional- ly, the defects on the inside surface caused by drilling act as notches.
3-2. Variations of Residual Stress due to Stress Cycling.
It has been seen that the residual stress generally changes during the fatigue process and the manner of its variation differs according te the initial distribu- tion of residual stress and the amplitude of repeated stress.
When the amplitude of stress is higher than the fatigue limit, the residual stress of each kind of specimen usually, rapidly decreases a large amount. When the amplitude of stress near the fatigue limit is repeated, the amount of decrease seems to vary with the different surface treated specimens:such as the not an- nealed or the shot-peened specimens. In this experiment, it was clarified that the compressive residual stress decreases much more in the not annealed specimens which have a narrow zone of distrbution of compressive residual stress than in shot-peened specimens which have a larger zone.
Thus, it is interesting to be able to foresee qualitatively how much fatigue damage is caused during the fatigue process, by measuring the residual stress.
That is, if the residual stress during the fatigue process is much smaller than before the fatigue test, the specimen may soon break by fatigue, but if the re- sidual stress is not smaller, the specimen may not break. However, it must be
(76)
left for a future study to determine the fatigue damage quantitatively.
3-3. The Estimation of Fatigue Limit and the Separation into Two Factors which contribute to Fatigue Strength.
It may be considered that solid specimens have all factors which contribute to fatigue strength and that the hollow specimens generally lose one factor, be- cause of the release of residual stress by drilling. In shot-peened specimens, nevertheless, the residual stress is not removed completely after drilling, and they show a little effect of the residual stress.
Tabel 4 shows the fatigue limits of each solid or hollow specimen. The ex- perimental results where the increase of the fatigue limit (2.5 kg/mm2) in the not annealed hollow specimen depends only on the hardening properties at the surface layer and the increase (4.0 kg/mm2) in the shot-peened hollow specimen depends on the hardening properties and considerable residual stress can be un- derstood based on the theory described above.
Table. 4. Fatigue limits.
l .. S,O,i/iil,., I J.n8,r81Pifiilti,
'
Annealed specimen 23.0
Not annealed specimen l' 27,O I 4.0 shot-peened specimen I• 27.s I 4.{
/l
Hollow o.kg/mm2
19. 5 22.0 23. 5
Increment do.kg/mm2
2. 5 4. 0
Hitherto, the residual stress has been considered to be equivalent to the me- an stress. With consideration of the variation of residual stress due to stress cycling, however, the authors thought it more suitable that the residual stress which keeps an almost constant value after a decrease in the early stage of the fatigue process acts as the mean stress. Also, they thought that the increase in fa- tigue strength by the hardened layer is independent of the mean stress. Therefore, the equation which estimates the fatigue limit of surface treated specimens can be deduced from the endurance curve as follows :
Fig. 12 shows the diagram which helps to understand the idea, schematical- ly. The equation contains the factors of both hardening properties and residual stresses at the surface layer, that is,
Ow === Owo+dOq+AOr ••••••(1)
where
oor - Fatigue limlt of solid specimen with any surface treatment, aw. r= Fatigue limit of solid annealed specimen (or standard specimen), da, == Increase of fatigue limit due to hardening properties at surface layer, da. = Increase due to residual stress at surface layer.
Now,
6b' bv
N...
N...h..NN
b; NNN.h.SN.N
8-...-.N...-....N..
T 6
aok-a as
aTe
Cw=AcrTq+awe(l+-gga!is{;9tgriioaro)
'
Fig. 12. Diagram of endurance limit.
a. : Fatigue limit of surface treatment specimen, a. : Fatigue lirnit of standard specimen,
oT, : Real fracture stress of standard specimen, oro : Residual stress of standard specimen, ort : Residual stress of surface treatment specimen, do,: Increment of fatigue strength due to hardening properties at surface layer,
Ao.: Increment of fatigue strength dueto residual stress, as : Yield point of standard specimen,
ct: Material constant.
do. =( cta}iT-. O'O) av. .,.... (2)
where a == Material constant which represents the decrease of residual stress dur- ing the fatigue process in the fatigue limit,
ori = Initial residual stress of solid specimen with any surface treatment, a.o = Residual stress of the standard specimen before fatigue test, oTo == Real fracture stress of standard specimen.
Consequently, Eq. (1) yields,
av== Aa,+av, (1+ aari.i aro). ...(3)
Taira and Murakami estimated the fatgue limit by considering the initial residual stress as the mean stress, as follows8) ;
ov == (1+ aa';o)ovo ,
am. = Fatigue limit of the standard specimen, oTo = Real fracture stress of the standard specimen,
o.i = Initial residual stress of the specimen with any surface treatment.
Nakamura has schematically estimated the fatigue limit from the hardness (78)
distribution.'7''8' Let's estimate the fatigue limits by each of the methods described above.
(A). Author's method.
1) In the case of the not annealed specimen.
We can obtain the actual incnease due to hardening properties on the assump- tion that, when the amplitude of repeated stress is the fatigue limit, theresidual stress of not only of solid annealed specimens but also of hollow specimens of all kinds do not vary during the fatigue process; that is, a*1.
We use the following equation;
do == doq + Ao. = da, + aw,r (ct OrS i, ,aro') ,
where each factor with a dash, for example avo', means the value of hollow speclmens.
om,' -= 19.5 Kg/mm2 (shown in Table 4), o.i'= 7.7 Kg/mmb (shown in Table 3), a.,' = 4.2 Kg/mm2 (shown in Table 3), aT. -- 90.3 Kg/mm2 (shown in Table 1).
Consequently do,=1.7 Kg/mm2.
Applying Eq. (1),
aw=== da,+aw, ( aa//i arom + 1) ,
where a=l=O.5 (shown in Fig. 9),
a,i === 34.5 Kg/mm2 (shown in Table 3), a.,= 5.3 Kg/mm2 (shown in Table 3), ay, == 23.0 Kg/mm2 (shown in Table 4).
Conseqently, 6ru==27.7 Kg/mm2 is estimated.
2). In the case of the shot-peened specimen.
We can get Aa,==2.0 Kg/mm2 and a.==29.0 Kg/mm2 in the same manner with the use of aÅ}:O.7 as shown in Fig. 10. In comparison with the experimental results, the fatigue limit by Eq. (1) tends to be a little high, in each case. Ho- wever, in the first approximation the fatigue limit by Eq. (1) agrees with the experimental result.
(B). Taira and Murakami's method. .
1). In the case of the not annealed specimen.
om == Ovo (1+ tr-;Loi-) ,
where av.==23.0 Kg/mm2, a,i=-34.5 Kg/mm2, and oT,==90.3 Kg/mm2.
Consequently, ow==31.7 Kg/mm2 . 2). In the case of the shot-peened specimen.
aw==30.6 Kg/mm2 .
The fatigue limits by this method are larger than the author's. It might be considered that the error is due to neglecting the changes of hardening properties and the variation of residual stress in the fatigue process.
(C). Hardness distribution method.
The relation between hardness and fatigue limit was shown in Fig. 13'8'.
Making use of it, the hardness distribution is converted into the distribution of fatigue strength in the cross section of the specimen. The distribution of ben- ding stress is linear. When the distribution of bending stress comes in contact with the distribution of fatigue strength in the cross section, the nominal stress on the surface indicates the fatigue limit of the specimen.
40
I3o
.N
.E
bS20o -
gi
l"to
o
100 200 3oo
Hv
Fig, 13, Relation between hardness and fatigue limit.is)
dwO.1t6Hv
1) In the case of the not annealed specimen, a.'=21.0 kg/mm2 (as shown in Fig.
14).
2) In the case of the shot-peened specimen, a.=25.4 kg/mm2 (as shown in Fig.
15).
In comparison with the experimental results, these values are considerably small. This may be due to neglecting the effect of the residual stress.
Thus, from the above, the auth6rs' method shows comparatively good agree- ment with the experimental results. In this method, nevertheless, it is trouble- some to determine the actual increase due to hardening properties (da,) and the material constants (a) which are related to the decrease of the residual stresses
30w
(
xo
6)20
.r.
.E.
gio
Lt
o Depth frorn surtace:pxIOP
Fig. 14. Fatigue limit according to the hardness distribution. (not annealed specimen) ow =':=-- 21.0 kg/mm2
awo
zE
•iO
te
6
.r-
E
=
..O..'
LO
Cwo 30
20
to
Depth from surface:px105
.Fig. 15. Fatigue limit according to the hardness distribution (shot-peened specimen), Ow :='L 25.4 kg/mm2.
in the fatigue process. It must be left for a future study to determine those
factors easily and accurately. •
Table 5 shows the rate of increase due to each factor in comparison with the total increase. Consequently, in the rotary bending fatigue test, the contribution of residual stresses to fatigue strength is comparable to that of the hardening properties at the surface layer. In the not annealed specimens, the contribution
Table 5. The Increase of fatigue strength due to each factor.
Not annealed specimen Shot-peened specimen
O. I do
kg/mm2 ] kg/mm2
27. 0 27, 5
4.0 4.5
ziaa
kg/mm21 %
i
2. 5 2. 0
63 44
dOr
kg/mm2
1.5 2. 5
%
I 37
56
(81)
of the hardening properties at the surface layer dominate, relatively. On the other hand, in the shot-peened specimens, residual stresses are somewhat domi- nant.
In the tension-compression fatigue test, the contribution of the residual stres- ses is hardly recognized.i9)
4. CONCLUSION.
The conclusions obtained by this experiment are as follows:
1) The distributions of hardness and residual stress in the cross-sections of not annealed and shot-peened specimens are different, but the hardness of their ma- trixes are quite similar.
2) Under a stress amplitude which is higher than thefatigue limit, theresidual stress rapidly decreases a large amount, but under the stress amplitude near the fatigue limit, it decreases in the early stages of the fatigue process and has a general tendency to keep a constant value with increase in stress cycles. The survival of the residual strtss is 70 % of the initial residual stress in shot-peened specimens and about 50 9o in not annealed specimens.
3) The residual stress of solid specimens are almost completely released by
drilling.
4) It is possible to know qualitatively the fatigue damage by measureing the residual stress during the fatigue process.
5) The authors' estimation of the fatigue limit agrees with the experimental
results.
6) In the rotary bending fatigue test, the contribution of residual stresses to the fatigue strength is comparable to that of the hardening properties at the surface layer.
The authors would like to thank Associate Professor Tatsuo ENDO for his advice during this investigation.
REFERENCES
1. "Fatigue of Metals" edited by The Society of Materials Science, Japan, Maruzen Co.
Ltd.
2. T. Yokobori, "Fatigue of Materials" p. 21. Maruzen Co. Ltd.
3. The Society of -Materials Science, Japan, "Fatigue of Materials" p. 4.
4. Michlsen, "Fatigue Durability of Carburized Steel" ASTM. (1957).
5. S. Yonetani, "Science of Machine" Vol. 22, No. 12, p. 1676.
6. S. Yonetani, "Science of Machine" Vol. 23, No. 1, p. 53,
7. K. Hayashi, Y. Natsume, "Journal of The Society of Materials Science, Japan," Vol.
18, No. 195, p. 1105.
8. s. Taira, H. Murakami, "Material TesVi No, 10, 1961, p. 610.
9. H. Kansaki, T. Motoyama, "Journal of The Society of Materials Science, Japan" Vol.
15, No. 159, 1966, pp. 871--874.
10. U. Kawata, M. Kurita, S. Kodama, "Journal of The Society of Materials Science, Ja-
pan" Vol. 17, No. 183, 1968, p. 129. '
11. K. Mitsunaga, M. Ishibashi, "Journal of The Society of Materials Science, Japan"
Vol. 17, No. 17, 1968, p. 1002.
12. "The X-Ray Method of Stress Measurement" edited by The Society of Materials Science, Japan, 1966, Yokendo Co. Ltd.
13. S. Taira, "Journal of The Society of Materials Science, Japan" Vol. 14, No. 147, p.
924.
14. T. Honma, S. Takeuchi, "Metals" Vol.22, No. 2, 1958, p. 55.
15. H. J. Grover, SAE. J., No. 64, 1956, p. 28. '
16. H. Nakamura, "Induction to Hardening and Fatigue Strength" Nikkankogyoshinbun Co.
Ltd., 1963, p. 20.
17. "Design Data of Fatigue Strength, 2, Surface Effect" edited by The Japan Society of Mechanical Engineers, 1965.,
18. S. Natsume, K. Hatsuno, Y. Natsui, H. Nakamura, "Journal of The Society of Materials Science, Japan" Vol. 18, No. 195, 1969, p. 1081.
19. K. Mitsunaga, A. Fukutake, "Bulletin of The Kyushu Institute of Technology (Science and Technology)" No. 25, June 1972, p. 29.
(83)